
IFDP Notes
 Print
PrintDecember 3, 2013
The Energy Boom and Manufacturing in the United States: A First Look
Will Melick
Over the past eight years, the production of both crude oil and natural gas has increased sharply in the United States. To the extent that the energy market is localized, especially true for natural gas, the energy boom will provide a competitive advantage to those U.S. manufacturers that are intensive users of energy. I use industry-level data on investment, production, employment, prices and trade flows to offer a preliminary empirical assessment of the energy boom's impact on U.S. manufacturing.
A positive supply shock for an important input such as energy will lead manufacturers to increase output, in turn pushing out the industry supply curve and lowering prices. To the extent that energy and labor are complementary inputs, manufacturing employment will also increase. Exports of manufactured products should also increase while imports should fall. Investment in the manufacturing sector should increase as existing firms expand and reorient their production processes and new firms enter the sector. All of these effects on industry activity should vary with the energy-intensity of the industry. Thus, I look for relationships between an industry's energy intensity and measures of activity in that industry.
The measure of energy intensity for the manufacturing sector is derived from the Manufacturing Energy Consumption Survey (MECS) conducted by the Department of Energy. Table 1 displays the measures of total energy intensity and natural gas intensity by industry as of the 2006 survey. Because the resurgence in U.S. energy production began around 2006 these data offer a good indication of which industries stand to benefit the most from the positive energy supply shock.
| Table 1 |
|---|
| NAIC Code | Industry | Total Energy | Natural Gas | NAIC Code | Industry | Total Energy | Natural Gas |
|---|---|---|---|---|---|---|---|
| 311 | Food | 5.0 | 2.7 | 3254 | Pharmaceuticals and Medicines | 0.7 | 0.4 |
| 3112 | Grain and Oilseed Milling | 17.5 | 6.0 | 325412 | Pharmaceutical Preparation | 0.6 | 0.3 |
| 311221 | Wet Corn Milling | 43.6 | 12.7 | 325992 | Photographic Film, Paper, Plate, and Chemicals |
3.8 | NA |
| 31131 | Sugar Manufacturing | 31.3 | 6.5 | 326 | Plastics and Rubber Products | 3.7 | 1.3 |
| 3114 | Fruit and Vegetable Preserving and Specialty Foods |
5.5 | 4.5 | 327 | Nonmetallic Mineral Products | 17.5 | 6.4 |
| 3115 | Dairy Products | 4.3 | 3.4 | 327211 | Flat Glass | 34.5 | 28.4 |
| 3116 | Animal Slaughtering and Processing |
4.4 | 2.7 | 327212 | Other Pressed and Blown Glass and Glassware |
39.5 | NA |
| 312 | Beverage and Tobacco Products | 1.4 | 0.5 | 327213 | Glass Containers | 24.3 | 19.4 |
| 3121 | Beverages | 2.4 | 0.9 | 327215 | Glass Products from Purchased Glass |
9.8 | 8.2 |
| 3122 | Tobacco | 0.3 | 0.1 | 327310 | Cements | 52.5 | 2.8 |
| 313 | Textile Mills | 8.6 | 3.8 | 327410 | Lime | 120.1 | 4.9 |
| 314 | Textile Product Mills | 4.6 | 3.0 | 327420 | Gypsum | 18.7 | 16.6 |
| 315 | Apparel | 1.0 | 0.4 | 327993 | Mineral Wool | 12.7 | 8.7 |
| 316 | Leather and Allied Products | 1.1 | 0.3 | 331 | Primary Metals | 20.0 | 7.4 |
| 321 | Wood Products | 10.4 | 2.0 | 331111 | Iron and Steel Mills | 37.7 | NA |
| 321113 | Sawmills | 15.1 | NA | 331112 | Electrometallurgical Ferroalloy Products |
36.1 | NA |
| 3212 | Veneer, Plywood, and Engineered Woods |
17.6 | 4.3 | 3312 | Steel Products from Purchased Steel | 5.0 | 3.6 |
| 3219 | Other Wood Products | 5.6 | 1.2 | 3313 | Alumina and Aluminum | 22.7 | 10.5 |
| 322 | Paper | 28.9 | 5.9 | 331314 | Secondary Smelting and Alloying of Aluminum |
16.1 | 11.4 |
| 322110 | Pulp Mills | 113.2 | 7.4 | 331315 | Aluminum Sheet, Plate and Foils | 13.6 | NA |
| 322121 | Paper Mills, except Newsprint | 35.3 | NA | 331316 | Aluminum Extruded Products | 8.6 | 7.0 |
| 322122 | Newsprint Mills | 40.8 | NA | 3314 | Nonferrous Metals, except Aluminum | 6.7 | 3.3 |
| 322130 | Paperboard Mills | 64.4 | 12.0 | 3315 | Foundries | 8.0 | 4.1 |
| 323 | Printing and Related Support | 1.5 | 0.6 | 331511 | Iron Foundries | 12.0 | NA |
| 324 | Petroleum and Coal Products | 27.0 | 6.7 | 331521 | Aluminum Die-Casting Foundries | 9.8 | NA |
| 324110 | Petroleum Refineries | 29.2 | 7.1 | 331524 | Aluminum Foundries, except Die-Casting |
7.9 | NA |
| 324199 | Other Petroleum and Coal Products |
82.7 | 3.8 | 332 | Fabricated Metal Products | 2.6 | 1.4 |
| 325 | Chemicals | 9.4 | 5.1 | 333 | Machinery | 1.2 | 0.5 |
| 325110 | Petrochemicals | 29.8 | 4.1 | 334 | Computer and Electronic Products | 0.7 | 0.2 |
| 325120 | Industrial Gases | 21.6 | 12.1 | 334413 | Semiconductors and Related Devices |
1.2 | 0.3 |
| 325181 | Alkalies and Chlorine | 61.9 | 32.6 | 335 | Electrical Equip., Appliances, and Components |
1.8 | 0.7 |
| 325182 | Carbon Black | 25.0 | 29.6 | 336 | Transportation Equipment | 1.7 | 1.0 |
| 325188 | Other Basic Inorganic Chemicals | 16.8 | 5.6 | 336111 | Automobiles | 1.5 | 0.8 |
| 325192 | Cyclic Crudes and Intermediates | 8.8 | NA | 336112 | Light Trucks and Utility Vehicles | 1.3 | 0.7 |
| 325193 | Ethyl Alcohol | 23.7 | NA | 3364 | Aerospace Product and Parts | 0.9 | 0.4 |
| 325199 | Other Basic Organic Chemicals | 26.7 | NA | 336411 | Aircraft | 0.6 | 0.2 |
| 325211 | Plastics Materials and Resins | 24.9 | 13.5 | 337 | Furniture and Related Products | 1.1 | 0.4 |
| 325212 | Synthetic Rubber | 17.8 | 11.5 | 339 | Miscellaneous | 0.6 | 0.3 |
| 325222 | Noncellulosic Organic Fibers | 20.1 | NA | ||||
| 325311 | Nitrogenous Fertilizers | 131.1 | 210.7 | ||||
| 325312 | Phosphatic Fertilizers | 15.3 | 15.1 |
Note: The Total Intensities are taken directly from the MECS while the Natural Gas Intensities are calculated using MECS data on natural gas usage and ASM data on value added. Thus the two columns are not completely consistent. The only apparent discrepency is for nitrogenous fertilizers.
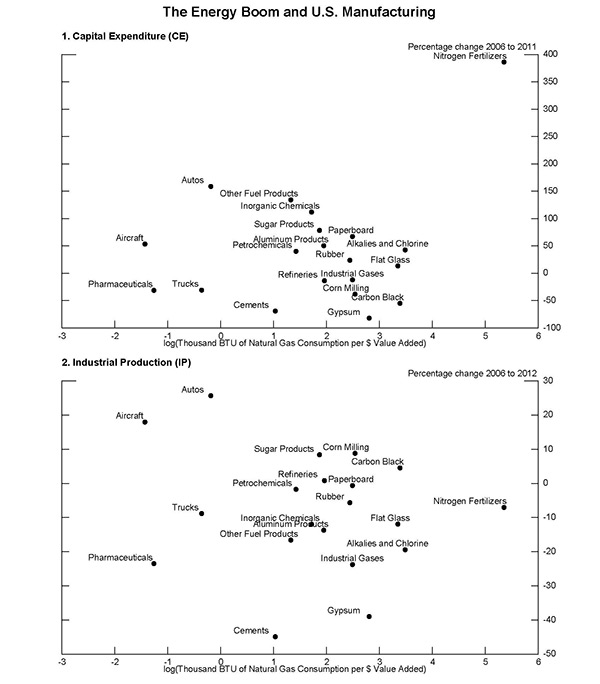
The energy intensity data are matched with industry-level data on investment, output, prices, employment and trade flows. Exhibit 1 provides a visual summary of the logic behind the analysis. In the two panels of the exhibit, the percentage change over the past several years in a measure of economic activity for manufacturing industries is plotted against natural gas intensity in these industries. All else equal, one would expect to see a generally positive relationship whereby firms that use natural gas intensively undertake greater investment (top panel) and increase production (bottom panel). Both figures show a slight positive scatter, but it is far from overwhelming.1
However, the absence of control variables in the scatter plots may be obscuring the impact of the energy boom. Therefore, a regression strategy is used to determine if the energy boom is playing out as expected. The regressions estimate the long-run effect of a drop in natural gas prices on industry activity, allowing for larger effects in the more energy-intensive industries. Control variables include oil prices, commodity prices, U.S. GDP, aggregate foreign GDP and the real exchange rate.
The estimated effects should be negative and significant in the regressions for capital expenditure, output, employment, and exports because a drop in natural gas prices will lead firms to invest more, produce more, hire more and export more. Conversely, the estimated effects should be positive and significant in the price and import equations as a drop in natural gas prices will lead firms to lower prices and discourage imports from foreign manufactures.
Results are presented in Table 2 and show the percentage impact on the six activity measures given a 50 percent drop in natural gas prices. For each activity measure the estimate is calculated three times: for the industry that is the least intensive user of natural gas, for the median industry, and for the industry that is the most intensive user of natural gas. Probability values for a test that the effect of a change in natural gas prices is equal to zero are also shown. As an example, the estimates indicate that a 50 percent decline in natural gas prices is associated with an almost 8 percent increase in employment for the most natural gas intensive industry.
| Table 2 |
|---|
| Activity Variable | Expected Sign | Estimate at Minimum Intensity | Estimate at Median Intensity | Estimate at Maximum Intensity | p-Value |
|---|---|---|---|---|---|
| Output | ( + ) | 0.011 | 0.570 | 33.525 | 0.00 |
| Prices | ( - ) | -0.014 | -0.680 | -29.277 | 0.00 |
| Employment | ( + ) | 0.045 | 1.081 | 7.669 | 0.00 |
| Exports | ( + ) | 0.011 | 0.543 | 31.651 | 0.14 |
| Imports | ( - ) | -0.015 | -0.771 | -32.524 | 0.01 |
| Capital Expenditure | ( + ) | 0.001 | 0.066 | 3.420 | 0.90 |
Estimated effects are calculated from regressions of the change in activity variables on the change in natural gas prices interacted with intensity of natural gas use and control variables. Data are annual from 1997 through 2012, except for Capital Expenditures which is through 2011. Estimates in bold are statistically significant at the five percent level.
With regard to economic significance, the estimated effects of a 50 percent decline in natural gas prices for the median industry (Column 4) are quite modest, ranging from a bit more than one percent increase in employment to a roughly three-quarters of a percent decline in imports. For the most intensive industry (Column 5) the estimated effects are much larger, ranging from an almost 35 percent increase in output to an almost 35 percent decline in imports. For every activity measure the estimated effects are of the expected sign, and for four of the six measures the estimated effects are statistically significant (in bold).
The estimates in Table 2 suggest that the energy boom has had a relatively small impact in the manufacturing sector as a whole. For most industries the 50 percent decline in natural gas prices over the past eight years is estimated to induce a perhaps one to two percent change in activity. Results are quite a bit stronger for the most intensive users of natural gas.
These results point to two possible conclusions. On the one hand, it could be that the energy boom will only ever be noticeable for the most intensive users of natural gas. These intensive users make up a fairly small piece of the manufacturing sector so that the overall impact on the entire sector will be relatively modest. For example, the four most intensive users of natural gas account for 0.5 percent of value added in manufacturing.
Alternatively, the timing of manufacturers' adjustment to more abundant natural gas will also surely vary by the intensity of natural gas usage. Early impacts should be seen in the most intensive industries, with others to follow. Perhaps the impact of the energy boom has yet to fully play out, calling for continued monitoring and analysis of developments in the manufacturing sector.
1. The nitrogenous fertilizers industry stands out due to its use of methane from natural gas to produce ammonia and thereby nitric acid. Return to text
Please cite as:
Melick, William R. (2013). "The Energy Boom and Manufacturing in the United States: A First Look," IFDP Notes. Washington: Board of Governors of the Federal Reserve System, December 03, 2013. https://doi.org/10.17016/2573-2129.03
Disclaimer: IFDP Notes are articles in which Board economists offer their own views and present analysis on a range of topics in economics and finance. These articles are shorter and less technically oriented than IFDP Working Papers.
