
IFDP Notes
 Print
PrintNovember 17, 2015
Debt Statistics a la Carte: Alternative Recipes for Measuring Government Indebtedness
Daniel A. Dias and Mark L. J. Wright1, 2
1. Introduction
According to Eurostat, the Greek government owed Euro 317 billion in debt at the end of 2014. This is equivalent to more than 177% of GDP, 387% of tax revenue and amounts to almost Euro 30,000 per person. This seems like a very large sum. For comparison, of the other highly indebted European countries that received financial assistance, Portuguese government debt amounted to 130% of GDP while Irish government debt amounted to 110% of GDP.
As a result of these large debt numbers, there have been increasing calls for debt relief to be offered to Greece and, in some cases, also to the other highly indebted countries of Europe. For example, the International Monetary Fund has recently announced that it considers Greek debt unsustainable (IMF 2015a,b). Rogoff (2015a,b) also argues that Greek debt is unsustainable and has advocated a wider European debt relief effort. On the other hand, wider debt relief found little support in a recent symposium of 30 economists (International Economy, 2015), and numerous commentators have pointed to the fact that Greece's debt has been issued at low interest rates and at long maturities to argue that Greece's debt is sustainable (for example, Gross 2015). Especially provocatively, some commentators and investors have argued that, if measured under International Public Sector Accounting Standards (IPSAS), Greece's debt could amount to as little as 70% of GDP (Soll, 2015, Giugliano, 2015).
Is Greece more or less indebted than either Portugal or Ireland? Which of the three countries is most burden by its debt? In our recent research (Dias, Richmond and Wright 2014 and 2015), we have argued that in order to obtain answers to these questions it is necessary to look closely at statistics on government indebtedness and the process by which these statistics have been constructed. We have also proposed a number of measurement changes for sovereign indebtedness and shown how different statistics can give at times a radically different impression as to indebtedness patterns throughout the developing world.
In this note, we apply our same measurement techniques to the debts of Greece, Ireland and Portugal and show that plausible alternative measures of indebtedness suggest that Greece is anywhere from as much as 50% more indebted, to as little as half as indebted as either Portugal or Ireland. We argue that most reasonable measures imply that Greece is far less indebted than is commonly reported, and that indebtedness levels across these three economies are roughly similar.
2. The Measurement Problem
To illustrate the effect that measurement choices have on estimates of the relative indebtedness of countries, we created estimates of the cash flows required to repay the debts of Greece, Ireland and Portugal as they are projected to be at the end of 2015. In light of the scant available details, we do not adjust cash flows for the most recent Greek bailout announced in August. The data we use come from multiple sources. Data on expected Greek debt payments is taken from the Wall Street Journal (WSJ), published in June 2015. The article contains information about all future principal repayments Greece is expected to make from mid-2015 until end-2057. Data on interest rates come from the WSJ, IMF and EFSF reports, and Zettelmeyer, Trebesch and Gulati (2013). In comparison to the aggregate official values at the end of the first quarter of 2015, our data on principal repayments are about 10% smaller. Our data does not include short term loans (repos), most of the debt to the European Investment Bank, and loans from the Greek central bank because we do not have information about the distribution of future payments.
The data from Portugal and Ireland come almost entirely from their public debt management authorities (IGCP in Portugal and NTMA in Ireland). The IGCP and NTMA publish data on expected principal repayments on its medium and long term debt, and also provide information on interest rates which can be matched to the projected principal repayments. The data for Portugal is based on information at end-January 2015, while for Ireland it is for the start of August 2015. In the cases of Portugal and Ireland, our data on principal repayments are about 15% smaller than the official debt stock reported by the Eurostat. This difference is mostly due to non-tradeable debt for which we were not able to find information beyond its face value.
With the data on principal repayments and corresponding interest rates, we estimate the annual interest payments that are expected at every point in time from 2016 until the date of the last expected principal repayment. We take into account the existence of different types of instruments (e.g., coupon bonds, amortizing bonds), as well as information on grace periods from official creditors such as the EFSF.
| Figure 1: End 2015 debt repayment profile in percent of 2014 GDP for Greece, Portugal and Ireland |
|---|
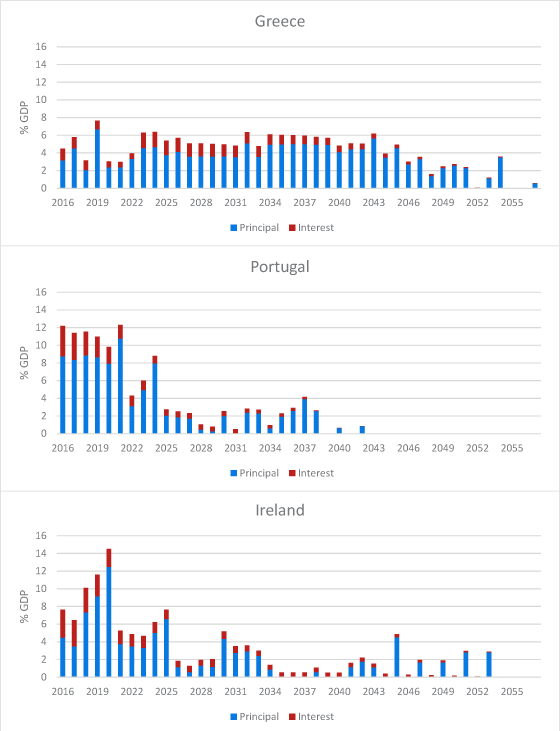 |
Source: Wall Street Journal (WSJ), Instituto de Gestão da Tesouraria de Credito Publico (IGCP), National Treasury Management Agency (NTMA), EUROSTAT, and author's calculations. |
The resulting projections of cash flows, scaled by 2014 GDP for comparability, are plotted in Figure 1. Blue bars represent principal repayments and red bars represent interest payments. Three facts are immediately clear. First, interest payments make up a relatively small fraction of Greece's projected cash flows, reflecting the fact that they have been able to borrow from official sources at subsidized interest rates. Second, both Portugal and Ireland face far larger cash flow requirements, relative to the size of their economies, than Greece for the next ten years. Third, after this ten year period, the required repayments on Greece's debt will far exceed those of Portugal and Ireland, measured as a fraction of their economies.
From these graphs it should be clear that whether or not we view Greece as more or less indebted than Portugal and Ireland depends on how we weight cash flows in the near future (next ten years) versus cash flows in the far future (more than ten years). Different statistics that weight these cash flows in different ways can be expected to give very different answers.
3. Alternative Recipes for Quantifying Government Debt
How do debt statistics currently weigh together these cash flows? For the most part, debt stocks are measured and reported at face value [1]. Defined as the undiscounted sum of future principal repayments, face values simply add up the heights of the various blue columns in each panel of Figure 1. Not surprisingly, Greece has a lot of debt when measured at face value; as shown in Table 1, the face value of Greece's tradable debts totals 144.1% of GDP compared to 98.5% for Portugal and 92.5% for Ireland. That is, at face values, Greece is 57% relatively more indebted than Ireland, and 46% more indebted than Portugal.
| Table 1. Debt stocks at the end of 2015 in billion euros and as percent of 2014 GDP based on face |
|---|
| Billion euros | % GDP | |
|---|---|---|
| Greece | 258.1 | 144.1 |
| Portugal | 170.4 | 98.5 |
| Ireland | 169.7 | 91.5 |
As show in Figure 1 by the small red columns, Greece has been able to borrow at much lower interest rates than either Ireland or Portugal. An alternative measure of indebtedness takes the undiscounted sum of all payments on debt, principal plus interest (Dias, Richmond and Wright (2014) refer to it as the zero-coupon equivalent (ZCE) face value of the debt). As shown in Table 2, the difference between the countries narrows somewhat when ZCE face values are used: Greece now has only 43% more debt than Ireland and 44% more than Portugal.
| Table 2. Debt stocks at the end of 2015 in billion euros and as percent of 2014 GDP based on zero coupon equivalent values |
|---|
| Billion euros | % GDP | |
|---|---|---|
| Greece | 318.8 | 178 |
| Portugal | 213.3 | 123.3 |
| Ireland | 230.7 | 124.4 |
The attractive feature of ZCE face values is that they control for differences in the contractual structure of a countries debts---differences in interest rates, maturities, and whether or not the debts were sold at par or at a discount---and measure relative debt stocks under the assumption of a common portfolio of debt contracts. Of course, although they are very useful for many purposes, there is no reason why we should focus exclusively on zero-coupon debts; we could as easily construct 5% coupon equivalent face values of debt. This turns out to be equivalent to simply measuring the present value of the cash flows associated with a country's debts. Using a 5% interest rate assumption, Table 3 shows that Greece now has 7% more debt than Ireland and 5% less debt than Portugal.
| Table 3. Debt stocks at the end of 2015 in billion euros and as percent of 2014 GDP based on 5 percent coupon equivalent values |
|---|
| Billion euros | % GDP | |
|---|---|---|
| Greece | 148.3 | 82.8 |
| Portugal | 150.9 | 87.2 |
| Ireland | 143.1 | 77.2 |
Is 5% the right interest rate to use? It is certainly a conventional choice (e.g. Schumacher and Weder, 2015, and IMF 2013). But in this era of very low interest rates, 5% may be a little high. One interesting calculation is to ask what the value of these debts would be if they had been issued by a country with no risk of default, such as Germany. Using yield curves for German government bonds, we can construct risk free present values, and present them in Table 4. Using this measure, Greece's debts barely change as they are already borrowing at very low rates, while Portugal and Ireland's debts rise: Greece is now 30% more indebted than Ireland and 24% more indebted than Portugal.
| Table 4. Debt stocks at the end of 2015 in billion euros and as percent of 2014 GDP based on risk free present values |
|---|
| Billion euros | % GDP | |
|---|---|---|
| Greece | 258.6 | 144.4 |
| Portugal | 201.3 | 116.4 |
| Ireland | 206.4 | 111.3 |
As one last alternative, we can discount a country's entire debt repayment cash flows by the interest rates embodied in their currently traded debts to obtain an estimate of the market value of a country's debt. This assumes that the likelihood of repayment of Greece's EFSF debt, for example, is the same as that for privately held bonds. Under these assumptions, as shown in Table 5, Greece appears to have less than half as much debt as either Portugal or Ireland. These numbers are closer to the estimates computed under the IPSAS standard, which records a debt at market value at the time of issue, and allows for the accretion of this debt if the contracted interest rate on the debt is less than the yield to maturity of the debt. This approach has the counterintuitive implication that the more likely a country is to default, the less indebted it will look.
| Table 5. Debt stocks at the end of 2015 in billion euros and as percent of 2014 GDP based on market rates present values |
|---|
| Billion euros | % GDP | |
|---|---|---|
| Greece | 75.5 | 42.1 |
| Portugal | 180.7 | 104.5 |
| Ireland | 194.3 | 104.8 |
In sum, depending on the choice of statistic, we can find that Greece is either half again as indebted as Ireland and Portugal, or less than half as indebted.
4. Is There a "Right" Debt Statistic?
In our previous work, we have argued that the right debt statistic to use is probably going to be quite sensitive to the precise purpose for which the data will be used. In the case of forecasting default, for example, the right measure to use will probably also need to reflect the particular circumstances of the country being considered. In some cases, it is also necessary to look at other statistics, such as net interest expenses, as well as debt stock measures in order to obtain a complete picture of a country's debt portfolio. Forced to work with one statistic, we have tended to emphasize ZCE face values as they are a theoretical upper bound on calculated face values and are convenient for mapping to models which assume a zero coupon debt structure.
For some purposes, however, it may be possible to come up with a sufficient statistic that is useful in addressing a particular question independently of the model assumed by the researcher. In Dias, Richmond and Wright (2015) we show that when a researcher is interested in the welfare benefits of debt relief and debt forgiveness, it is sufficient to use the consumption capital asset pricing model (CCAPM) to value a country's debt stock (or the change in that stock as a result of debt relief). In what follows, we estimate the CCAPM under the assumption that real consumption growth rates in Euro's for each country follows a first order autoregressive process [2].
| Table 6. Debt stocks at the end of 2015 in billion euros and as percent of 2014 GDP based on social cost present values |
|---|
| Billion euros | % GDP | |
|---|---|---|
| Greece | 114 | 63.7 |
| Portugal | 125.3 | 72.4 |
| Ireland | 110.4 | 59.5 |
Table 6 shows that the equivalent variation, in terms of current period consumption, of forgiving all of Greece's debts is less than that for Portugal and roughly the same as for Ireland. This reflects both the time path of cash flows and the level of current consumption in each country. For Greece, current consumption is very low so that forgiving far future cash flows, after consumption is expected to have recovered, is worth relatively little in terms of current consumption; for Portugal, forgiveness is worth more because the required cash flows are higher in the near future when consumption is expected to remain low.
Comparing Tables 5 and 6, we can see that the social cost of the debt (Table 6) is less than the market value of the debt (Table 5) for both Portugal and Ireland. In normal times, this is the expected state of affairs: a country is a borrower precisely because they value future debt repayments less than the market values them. If markets were perfect and borrowing unconstrained, Portugal and Ireland would borrow until the two values were equated; the fact that they are not equated suggests that maturity extensions for both that preserved market values would be Pareto-improving. [3]
For Greece, however, market values are less than social values, implying that debt forgiveness---a complete debt write-off---would increase Greek welfare more than creditor welfare was reduced. This is under our assumption that official debts are valued at the rates encoded in privately traded debts. If, alternatively, Greece's official debts were valued using risk free discounting (Table 4), the market value would lie above the social cost and simple maturity extensions would be Pareto improving for all three countries.
5. Concluding Thoughts
Much of the debate about the debts of Greece and the rest of peripheral Europe has been informed by statistics that measure debt stocks at face value and which show that Greece is significantly more indebted than Ireland and Portugal. We have shown that alternative, and arguably preferable, measures of debt stocks paint a very different picture, with some suggesting that Greece is roughly as indebted as either Ireland or Portugal. Measures based on the welfare cost of servicing debt, in particular, provide a case for debt forgiveness for Greece and maturity extensions for Portugal and Ireland.
At the same time, GDP may not be the right measure of available resources to a country as it does not includes net factor income from abroad. An alternative measure that takes this fact into account is GNI (Gross National Income). In the cases of Greece and Portugal, this distinction is not very relevant, as the two measures are virtually identical for the two countries. In the case of Ireland this is not the case. In 2014, GDP in Ireland was 185.4 billion euros, while GNI was 158.3 billion euros. This large difference means that if the calculations shown above were presented in percent of GNI, all figures for Ireland would be 17% larger.
Endnote:
[1] For example, the World Bank (various) reports the face value of outstanding and disbursed debt. Until 1989, the U.S. statutory debt limit was defined in terms of face values. Until 1997, Eurostat measured the face value of all debts; since 1997, it has departed from this practice for zero-coupon and deep-discounted bonds (Eurostat 1997a,b).
[2] The implicit long run average per capita real consumption growth per year is 0.7% for Greece, 1.4% for Portugal and 1.8% for Ireland.
[3] In the weeks since these calculations were completed, Greek yields have fallen and the market value of Greece's debt has increased, which may reverse this conclusion and instead support further maturity extensions for Greece as well.
References:
Dias, Daniel A., Richmond, Christine, and Wright, Mark L. J. (2014), 'The Stock of External Sovereign Debt: Can We Take the Data at `Face Value'?',  Journal of International Economics, 94 (1), 1-17.
Dias, Daniel A., Richmond, Christine, and Wright, Mark L. J. (2015), 'In for a Penny, In for a Hundred Billion Pounds: Quantifying the Welfare Effects of Debt Relief', unpublished paper.
EFSF, www.efsf.europa.eu/about/index.htm
Eurostat, 1997a. Deficit and debt: Eurostat rules on accounting issues. Eurostat Press Release 97 (10).
Eurostat, 1997b. Accounting rules: complementary decisions of Eurostat on deficit and debt. Eurostat Press Release 97 (24).
Giugliano, Ferdinando. 2015. Is Greek government debt really 177% of GDP? Financial Times. January 26.
Gross, Daniel. 2015. The Greek Austerity Myth. Project Syndicate. February 10.
IGCP, www.igcp.pt
International Economy. 2015. Does Europe Need Debt Relief: A Symposium of Views. Spring.
IMF, www.imf.org
IMF. 2013. Unification of Discount Rates Used in External Debt Analysis for Low-Income Countries. Washington, D.C.
IMF. 2014. Fiscal Monitor. October.
IMF, 2015a. Greece: Preliminary Draft Debt Sustainability Analysis. Country Report 15/165.
IMF. 2015b. Greece: An Update of IMF Staff's Preliminary Public Debt Sustainability Analysis. Country Report 15/186.
NTMA, http://www.ntma.ie
OECD. 2015. National Accounts of OECD Countries, Financial Balance Sheets 2014.
Rogoff, Kenneth. 2015a. What is Plan B for Greece? Project Syndicate, February 2.
Rogoff, Kenneth. 2015b. A New Deal for Debt Overhangs?, Project Syndicate, August 4.
Schumacher, Julian and Weder di Mauro, Beatrice. 2015. Debt sustainability puzzles: Implications for Greece. VoxEU. July 12.
Soll, Jacob. 2015. Greece's Accounting Problem. New York Times. January 20.
World Bank. various. Global Development Finance. World Bank Washington D.C.
WSJ - http://graphics.wsj.com/greece-debt-timeline/
Zettlemeyer, Jeromin, Trebesch, Christoph and Gulati, Mitu, 2013, "The Greek Debt Restructuring: An Autopsy", CESifo WP 4333, July.
1. We thank Christine Richmond for all her help in the writing of this note. Return to text
2. This note reflects the views of the authors and does not necessarily represent those of the Board of Governors of the Federal Reserve System, the Federal Reserve Bank of Chicago, the Federal Reserve System, or the National Bureau of Economic Research. Return to text
Please cite as:
Dias, Daniel A., and Mark L. J. Wright (2015). "Debt Statistics a la Carte: Alternative Recipes for Measuring Government Indebtedness," IFDP Notes. Washington: Board of Governors of the Federal Reserve System, November 17, 2015. https://doi.org/10.17016/2573-2129.12
Disclaimer: IFDP Notes are articles in which Board economists offer their own views and present analysis on a range of topics in economics and finance. These articles are shorter and less technically oriented than IFDP Working Papers.