 Print
Print
Minutes of the Federal Open Market Committee
April 27-28, 2010
| FOMC Minutes | Summary of Economic Projections |
FOMC participants' forecasts for economic activity and inflation were broadly similar to their previous projections, which were made in conjunction with the January 2010 FOMC meeting. As depicted in figure 1, the economic recovery was expected to be gradual, with real gross domestic product (GDP) expanding at a rate only moderately above the participants' assessment of its longer-run sustainable growth rate and unemployment declining slowly over the next few years. Most participants also anticipated that inflation would remain subdued over this period. As indicated in table 1, participants generally made modest upward revisions to their projections for real GDP growth in 2010. Beyond 2010, however, the contours of participants' projections for economic activity and inflation were little changed. Participants continued to expect the pace of the economic recovery to be restrained by household and business uncertainty, only gradual improvement in labor market conditions, and slow easing of credit conditions in the banking sector. Participants generally expected that it would take some time for the economy to converge fully to its longer-run path--characterized by a sustainable rate of output growth and by rates of employment and inflation consistent with participants' interpretation of the Federal Reserve's dual objectives--but only a minority anticipated that the convergence process would take more than five to six years. As in January, most participants judged the risks to their growth outlook as balanced, and most also saw balanced risks surrounding their inflation projections. Participants in general continued to judge the uncertainty surrounding their projections for economic activity and inflation as unusually high relative to historical norms.
Percent
| Variable | Central tendency1 | Range2 | ||||||
|---|---|---|---|---|---|---|---|---|
| 2010 | 2011 | 2012 | Longer run | 2010 | 2011 | 2012 | Longer run | |
| Change in real GDP | 3.2 to 3.7 | 3.4 to 4.5 | 3.5 to 4.5 | 2.5 to 2.8 | 2.7 to 4.0 | 3.0 to 4.6 | 2.8 to 5.0 | 2.4 to 3.0 |
| January projection | 2.8 to 3.5 | 3.4 to 4.5 | 3.5 to 4.5 | 2.5 to 2.8 | 2.3 to 4.0 | 2.7 to 4.7 | 3.0 to 5.0 | 2.4 to 3.0 |
| Unemployment rate | 9.1 to 9.5 | 8.1 to 8.5 | 6.6 to 7.5 | 5.0 to 5.3 | 8.6 to 9.7 | 7.2 to 8.7 | 6.4 to 7.7 | 5.0 to 6.3 |
| January projection | 9.5 to 9.7 | 8.2 to 8.5 | 6.6 to 7.5 | 5.0 to 5.2 | 8.6 to 10.0 | 7.2 to 8.8 | 6.1 to 7.6 | 4.9 to 6.3 |
| PCE inflation | 1.2 to 1.5 | 1.1 to 1.9 | 1.2 to 2.0 | 1.7 to 2.0 | 1.1 to 2.0 | 0.9 to 2.4 | 0.7 to 2.2 | 1.5 to 2.0 |
| January projection | 1.4 to 1.7 | 1.1 to 2.0 | 1.3 to 2.0 | 1.7 to 2.0 | 1.2 to 2.0 | 1.0 to 2.4 | 0.8 to 2.0 | 1.5 to 2.0 |
| Core PCE inflation3 | 0.9 to 1.2 | 1.0 to 1.5 | 1.2 to 1.6 | 0.7 to 1.6 | 0.6 to 2.4 | 0.6 to 2.2 | ||
| January projection | 1.1 to 1.7 | 1.0 to 1.9 | 1.2 to 1.9 | 1.0 to 2.0 | 0.9 to 2.4 | 0.8 to 2.0 | ||
Note: Projections of change in real gross domestic product (GDP) and in inflation are from the fourth quarter of the previous year to the fourth quarter of the year indicated. PCE inflation and core PCE inflation are the percentage rates of change in, respectively, the price index for personal consumption expenditures (PCE) and the price index for PCE excluding food and energy. Projections for the unemployment rate are for the average civilian unemployment rate in the fourth quarter of the year indicated. Each participant's projections are based on his or her assessment of appropriate monetary policy. Longer-run projections represent each participant's assessment of the rate to which each variable would be expected to converge under appropriate monetary policy and in the absence of further shocks to the economy. The January projections were made in conjunction with the meeting of the Federal Open Market Committee on January 26-27, 2010.
1. The central tendency excludes the three highest and three lowest projections for each variable in each year. Return to table
2. The range for a variable in a given year consists of all participants' projections, from lowest to highest, for that variable in that year. Return to table
3. Longer-run projections for core PCE inflation are not collected. Return to table
Figure 1. Central tendencies and ranges of economic projections, 2010-12 and over the longer run*
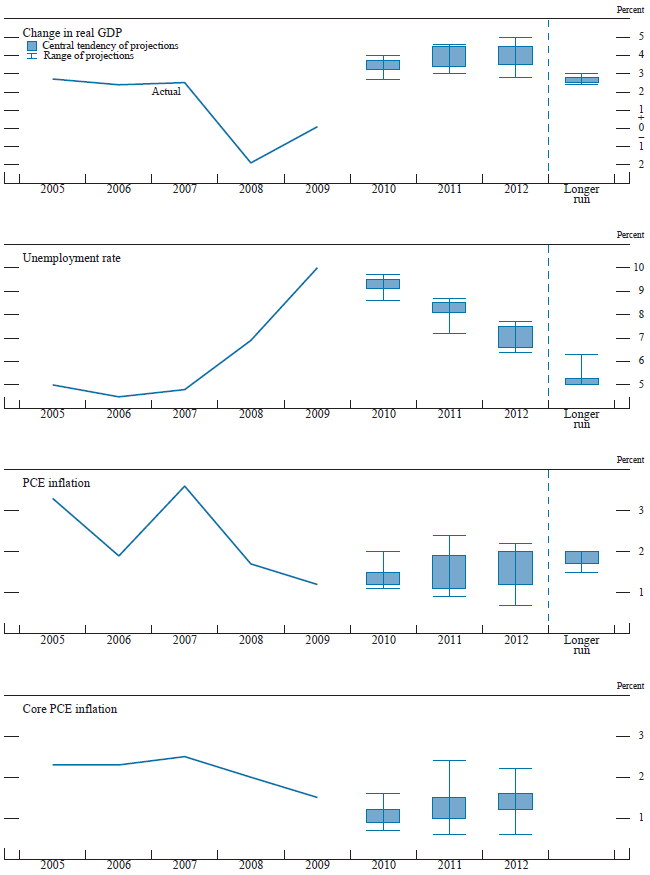
*Accessible version of figure 1 | Return to figure 1
The Outlook
Participants' projections for real GDP growth in 2010 had a central tendency of 3.2 to 3.7 percent, a little higher than in January. Readings on consumer spending and business outlays for equipment and software were seen as broadly consistent with a moderate pace of economic recovery. The labor market appeared to be starting to improve, but job growth was expected to be modest. Participants pointed to a number of factors that would support the continued expansion of economic activity, including accommodative monetary policy and the improved condition of financial markets and institutions. Several participants also noted that fiscal policy was currently providing substantial support to real activity. However, they expected less impetus to GDP growth from this factor later in the year and anticipated that budgetary pressures would probably continue to weigh on spending at the state and local levels. Many participants thought that the expansion was likely to be restrained by firms' caution in hiring and spending in light of the considerable uncertainty regarding the economic outlook, and by limited access to credit by small businesses and consumers.
Looking further ahead, participants' projections were for real GDP growth to pick up somewhat in 2011 and 2012; the projections for growth in both years had a central tendency of about 3½ to 4½ percent. As in January, participants generally expected the ongoing recovery in household wealth and gradual improvements in credit availability to bolster consumer spending. As the recovery became more firmly established, businesses were seen as likely to boost their outlays on equipment and software and to increase production in order to rebuild their inventories. Nevertheless, participants indicated several factors that would likely restrain the pace of expansion, including a higher household saving rate as households repair balance sheets, significant uncertainty on the part of households and businesses about the outlook for the economy, and a slow recovery in nonresidential construction. Moreover, although financial conditions had improved noticeably in recent months, ongoing strains in the commercial real estate sector were expected to pose risks to the balance sheets of banking institutions for some time. Terms and standards on bank loans remained restrictive, and participants anticipated only a gradual easing of credit conditions for many households and smaller firms. In the absence of further shocks, participants generally expected that real GDP growth would converge over time to an annual rate of 2.5 to 2.8 percent, the longer-run pace that appeared to be sustainable in view of expected trends in the labor force and improvements in labor productivity.
Participants anticipated that labor market conditions would improve slowly over the next several years. The central tendency of their projections for the average unemployment rate in the fourth quarter of 2010 was 9.1 to 9.5 percent, only modestly below the levels of late last year. In line with their outlook for moderate output growth, participants generally expected that the unemployment rate would decline only to about 6.6 to 7.5 percent by the end of 2012, remaining well above their assessments of its longer-run sustainable rate. Although some participants noted concerns that substantial ongoing structural adjustments in product and labor markets would reduce the sustainable level of employment, participants' longer-term unemployment projections had a central tendency of 5.0 to 5.3 percent, essentially the same as in January.
Most participants revised down slightly their near-term projections for inflation, and participants generally anticipated that inflation would remain subdued over the next several years. The central tendency of their projections for personal consumption expenditures (PCE) inflation was 1.2 to 1.5 percent for 2010, 1.1 to 1.9 percent for 2011, and 1.2 to 2.0 percent for 2012. Many participants anticipated that increases in food and energy prices would lead headline PCE inflation to run slightly above core PCE inflation over the next few years. Most expected that inflation would rise gradually toward their individual assessments of the measured rate of inflation judged to be most consistent with the Federal Reserve's dual mandate. As in January, the central tendency of projections of the longer-run inflation rate was 1.7 to 2.0 percent. A majority of participants anticipated that inflation in 2012 would still be below their assessments of the mandate-consistent inflation rate, while the remainder expected that inflation would be at or slightly above its longer-run value by that time.
Uncertainty and Risks
Most participants continued to see their projections of future economic activity and unemployment as subject to greater-than-average uncertainty.1 Participants generally perceived the risks to their projections as roughly bal-anced, although a few indicated that they now viewed the risks to economic growth as tilted to the upside. Many participants pointed to stronger incoming data as suggesting that the economic recovery was more firmly established than had been the case in January, but they emphasized that predicting macroeconomic outcomes in the wake of a financial crisis and a severe recession was particularly difficult. In addition, participants cited uncertainties regarding the likely persistence of both the recent pickup in the growth of consumer spending and rapid labor productivity growth and noted the risk that severe strains in the commercial real estate sector could continue to impair bank balance sheets, thus limiting credit availability and restraining growth of output and employment.
Most participants continued to see the uncertainty surrounding their inflation projections as elevated. However, a few judged that uncertainty in the outlook for inflation was about in line with typical levels, and one viewed the uncertainty surrounding the inflation outlook as lower than average. Nearly all participants judged the risks to the inflation outlook as roughly balanced; however, two saw these risks as tilted to the upside, while two regarded the risks as weighted to the downside. Several participants noted that inflation expectations were well anchored, likely mitigating the tendency for inflation to decline in response to continued slack in resource utilization. Others cited the risk that expected and actual inflation could increase, especially if extraordinarily accommodative monetary policy measures were not unwound in a timely fashion.
Diversity of Views
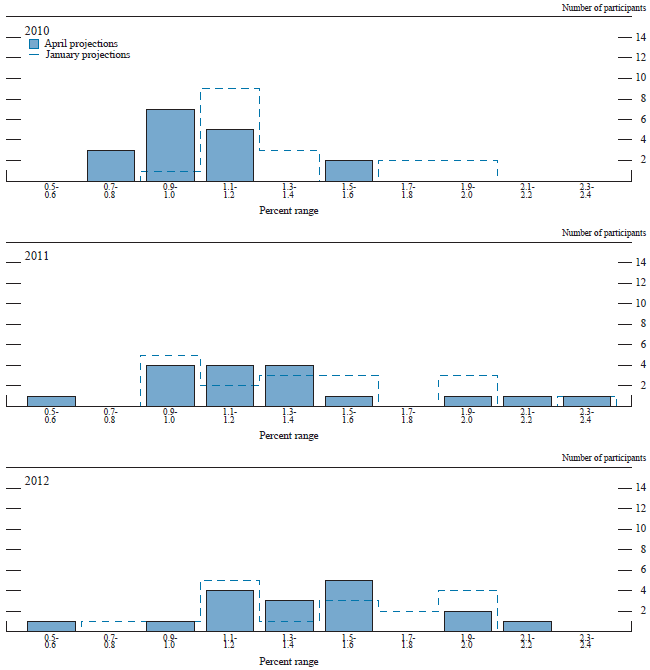
Figures 2.A and 2.B provide further details on the diversity of participants' views regarding the likely outcomes for real GDP growth and the unemployment rate. The distributions of participants' projections for real GDP growth this year and next year were slightly narrower than the distributions of their projections in January, but the distribution of projections for real GDP growth in 2012 was little changed. As in earlier projections, the dispersion in participants' forecasts for output growth appeared to reflect the diversity of their assessments regarding the current degree of underlying momentum in economic activity, the evolution of consumer and business sentiment, the likely pace of easing of bank lending standards and terms, and other factors. Regarding participants' unemployment rate projections, the distribution for 2010 shifted down somewhat, but the distributions of their unemployment rate projections for 2011 and 2012 did not change appreciably. The distributions of participants' estimates of the longer-run sustainable rates of output growth and unemployment were essentially the same as in January.
Table 2. Average historical projection error ranges
Percentage points
| Variable | 2010 | 2011 | 2012 |
|---|---|---|---|
| Change in real GDP1 | ±1.1 | ±1.7 | ±1.8 |
| Unemployment rate1 | ±0.5 | ±1.2 | ±1.5 |
| Total consumer prices2 | ±0.9 | ±1.0 | ±1.1 |
1. For definitions, refer to general note in table 1. Return to table
2. Measure is the overall consumer price index, the price measure that has been most widely used in government and private economic forecasts. Projection is percent change, fourth quarter of the previous year to the fourth quarter of the year indicated. Return to table
Corresponding information about the diversity of participants' views regarding the inflation outlook is provided in figures 2.C and 2.D. For overall and core PCE inflation, the distributions of participants' projections for 2010 shifted a bit lower relative to the distributions in January. The distributions of overall and core inflation for 2011 and 2012, however, were little changed and remained fairly wide. The dispersion in participants' projections over the next few years was mainly due to differences in their judgments regarding the determinants of inflation, including their estimates of prevailing resource slack and their assessments of the extent to which such slack affects actual and expected inflation. In contrast, the relatively tight distribution of participants' projections for longer-run inflation illustrates their substantial agreement about the measured rate of inflation that is most consistent with the Federal Reserve's dual objectives of maximum employment and stable prices.
Figure 2.A. Distribution of participants' projections for the change in real GDP, 2010-12 and over the longer run*
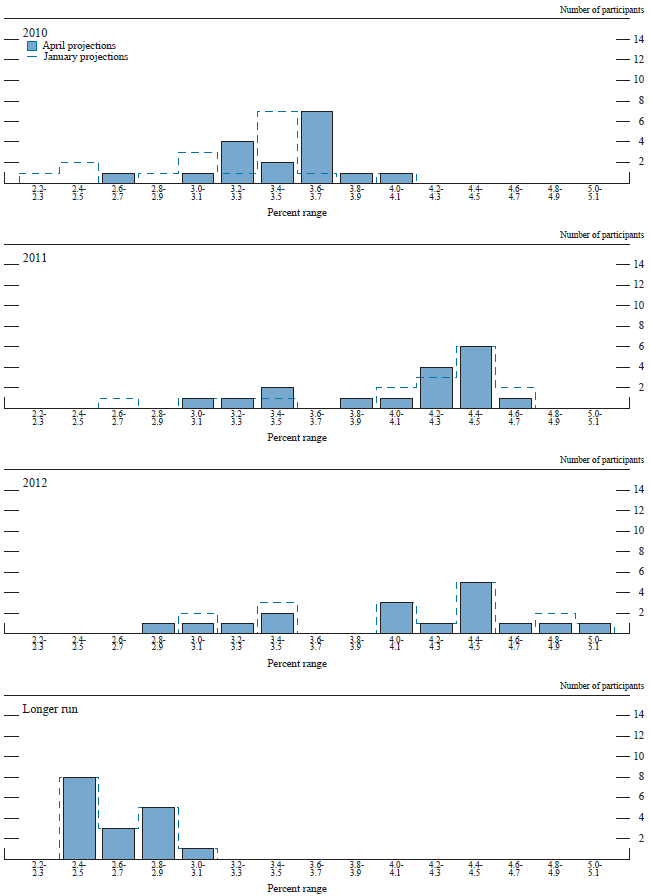
*Accessible version of figure 2.A. | Return to figure 2.A.
Figure 2.B. Distribution of participants' projections for the unemployment rate, 2010-12 and over the longer run*
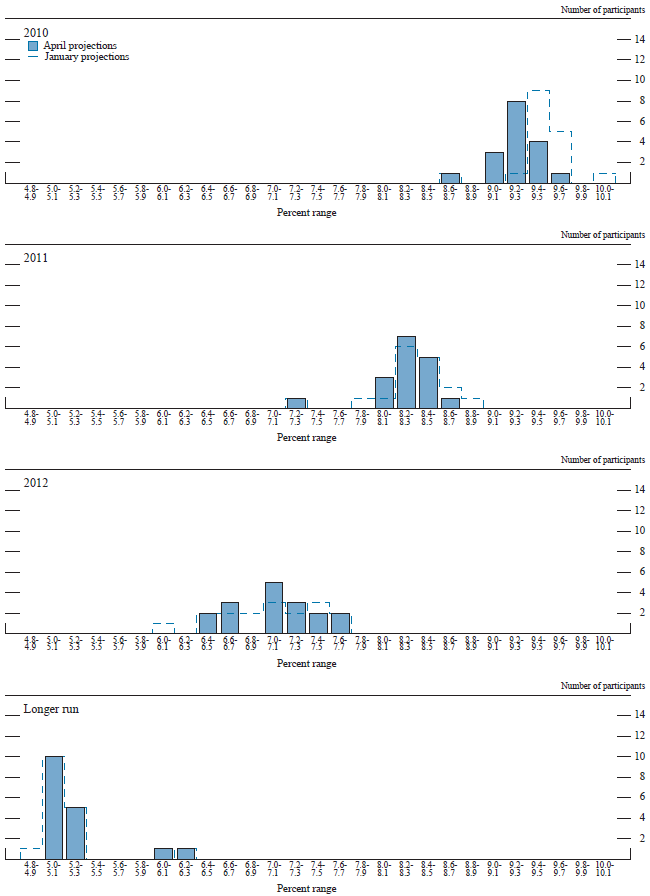
*Accessible version of figure 2.B. | Return to figure 2.B.
Figure 2.C. Distribution of participants' projections for PCE inflation, 2010-12 and over the longer run*
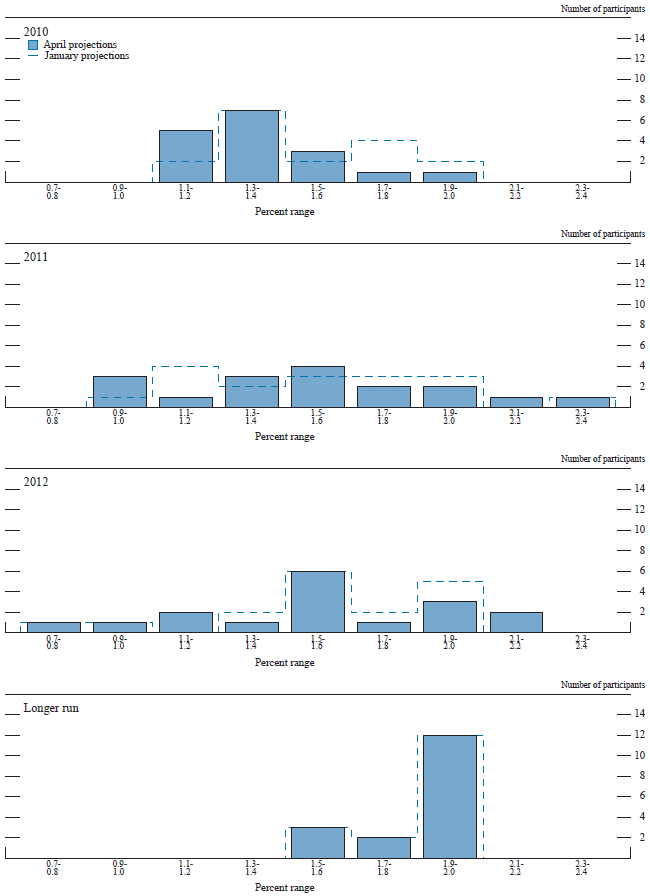
*Accessible version of figure 2.C. | Return to figure 2.C.
Figure 2.D. Distribution of participants' projections for core PCE inflation, 2010-12*
*Accessible version of figure 2.D. | Return to figure 2.D.
Forecast Uncertainty
The economic projections provided by the members of the Board of Governors and the presidents of the Federal Reserve Banks inform discussions of monetary policy among policy-makers and can aid public understanding of the basis for policy actions. Considerable uncertainty attends these projections, however. The economic and statistical models and relationships used to help produce economic forecasts are necessarily imperfect descriptions of the real world. And the future path of the economy can be affected by myriad unforeseen developments and events. Thus, in setting the stance of monetary policy, participants consider not only what appears to be the most likely economic outcome as embodied in their projections, but also the range of alternative possibilities, the likelihood of their occurring, and the potential costs to the economy should they occur.
Table 2 summarizes the average historical accuracy of a range of forecasts, including those reported in past Monetary Policy Reports and those prepared by Federal Reserve Board staff in advance of meetings of the Federal Open Market Committee. The projection error ranges shown in the table illustrate the considerable uncertainty associated with economic forecasts. For example, suppose a participant projects that real gross domestic product (GDP) and total consumer prices will rise steadily at annual rates of, respectively, 3 percent and 2 percent. If the uncertainty attending those projections is similar to that experienced in the past and the risks around the projections are broadly balanced, the numbers reported in table 2 would imply a probability of about 70 percent that actual GDP would expand within a range of 1.9 to 4.1 percent in the current year, 1.3 to 4.7 percent in the second year, and 1.2 to 4.8 percent in the third year. The corresponding 70 percent confidence intervals for overall inflation would be 1.1 to 2.9 percent in the current year, 1.0 to 3.0 percent in the second year, and 0.9 to 3.1 percent in the third year.
Because current conditions may differ from those that prevailed, on average, over history, participants provide judgments as to whether the uncertainty attached to their projections of each variable is greater than, smaller than, or broadly similar to typical levels of forecast uncertainty in the past as shown in table 2. Participants also provide judgments as to whether the risks to their projections are weighted to the upside, are weighted to the downside, or are broadly balanced. That is, participants judge whether each variable is more likely to be above or below their projections of the most likely outcome. These judgments about the uncertainty and the risks attending each participant's projections are distinct from the diversity of participants' views about the most likely outcomes. Forecast uncertainty is concerned with the risks associated with a particular projection rather than with divergences across a number of different projections.

