
 Print
Print
Minutes of the Federal Open Market Committee
November 1-2, 2011
- FOMC Minutes
- Summary of Economic Projections
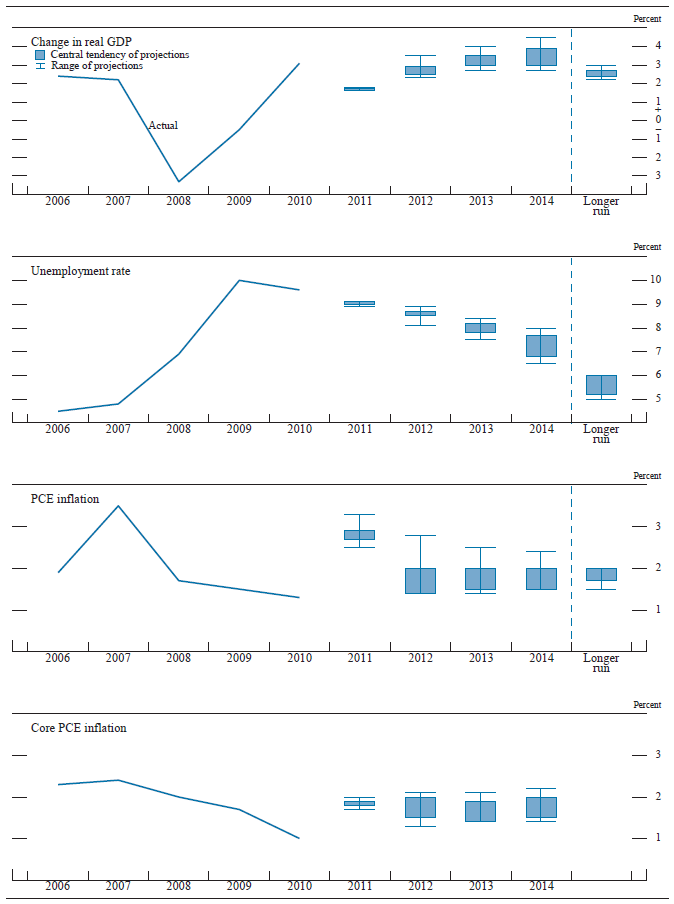
As depicted in figure 1, FOMC participants expected the economic recovery to continue at a moderate pace, with the growth of real gross domestic product (GDP) slowing this year compared with its pace in 2010 but then picking up gradually through 2014. With expectations that the pace of economic growth will modestly exceed participants' estimates of the longer-run sustainable rate of increase in real GDP, the unemployment rate is projected to decline only gradually over this projection period. As a result, participants anticipated that, at the end of 2014, the unemployment rate would remain well above their estimates of the unemployment rate that they see as consistent, over the longer run, with the Committee's dual mandate of maximum employment and price stability. Most participants anticipated that the factors underlying the noticeable rise in overall inflation in 2011 would be largely transitory and that inflation would move lower in 2012; thereafter, inflation was expected to remain at levels roughly consistent with or below rates that they see as consistent with the Committee's dual mandate. Participants generally viewed the rate of core inflation as likely to remain at or somewhat below its 2011 level throughout the projection period.
On balance, as indicated in table 1, participants anticipated somewhat slower economic growth and somewhat higher unemployment relative to their projections in June; they raised their projections for inflation in 2011 but left their projections for inflation from 2012 onward about unchanged since the June meeting. All of the participants made substantial downward revisions to their projections for GDP growth in 2011, and most marked down their projections for economic growth in 2012 and 2013; however, participants did not materially alter their expectations for the normal rate of economic growth that would prevail in the longer run. Although participants continue to expect a gradual decline in the unemployment rate over time, most participants revised up their projections for the path of the unemployment rate over the forecast period, and some participants also raised their projections of the longer-run rate of unemployment compared with June. Participants' projections for overall and core inflation this year were slightly higher than in June, but their projections for 2012, 2013, and over the longer run were broadly similar to those made in June.
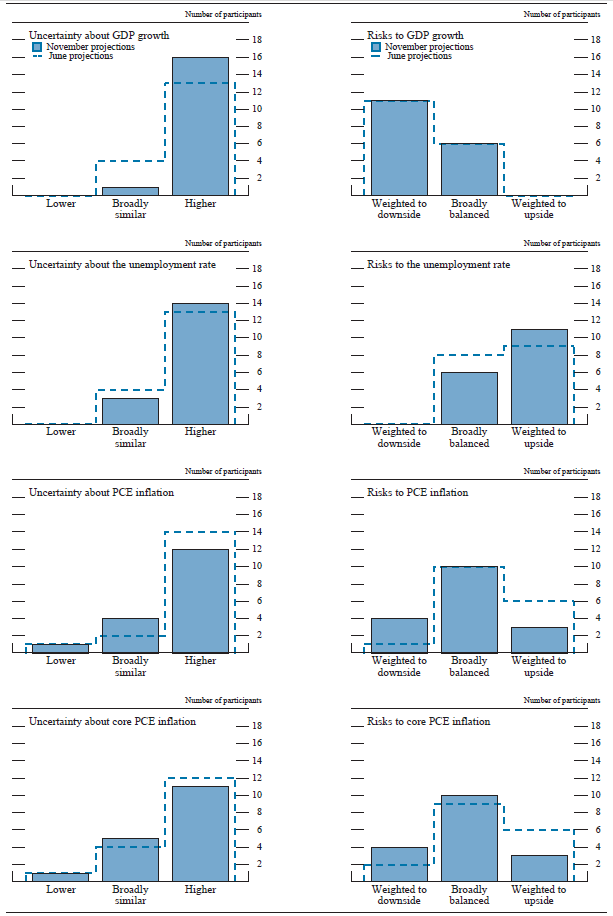
As indicated in figure 2, a sizable majority of participants continued to attach an unusually high level of uncertainty to their projections for economic growth, the unemployment rate, and inflation relative to historical norms. Most participants viewed the risks to output growth as being weighted to the downside and the risks to the unemployment rate as being weighted to the upside. Most participants saw the risks to overall and core inflation as broadly balanced.
Table 1. Economic projections of Federal Reserve Board members and Federal Reserve Bank presidents, November 2011
Percent
| Variable | Central tendency1 | Range2 | ||||||||
|---|---|---|---|---|---|---|---|---|---|---|
| 2011 | 2012 | 2013 | 2014 | Longer run | 2011 | 2012 | 2013 | 2014 | Longer run | |
| Change in real GDP | 1.6 to 1.7 | 2.5 to 2.9 | 3.0 to 3.5 | 3.0 to 3.9 | 2.4 to 2.7 | 1.6 to 1.8 | 2.3 to 3.5 | 2.7 to 4.0 | 2.7 to 4.5 | 2.2 to 3.0 |
| June projection | 2.7 to 2.9 | 3.3 to 3.7 | 3.5 to 4.2 | n.a. | 2.5 to 2.8 | 2.5 to 3.0 | 2.2 to 4.0 | 3.0 to 4.5 | n.a. | 2.4 to 3.0 |
| Unemployment rate | 9.0 to 9.1 | 8.5 to 8.7 | 7.8 to 8.2 | 6.8 to 7.7 | 5.2 to 6.0 | 8.9 to 9.1 | 8.1 to 8.9 | 7.5 to 8.4 | 6.5 to 8.0 | 5.0 to 6.0 |
| June projection | 8.6 to 8.9 | 7.8 to 8.2 | 7.0 to 7.5 | n.a. | 5.2 to 5.6 | 8.4 to 9.1 | 7.5 to 8.7 | 6.5 to 8.3 | n.a. | 5.0 to 6.0 |
| PCE inflation | 2.7 to 2.9 | 1.4 to 2.0 | 1.5 to 2.0 | 1.5 to 2.0 | 1.7 to 2.0 | 2.5 to 3.3 | 1.4 to 2.8 | 1.4 to 2.5 | 1.5 to 2.4 | 1.5 to 2.0 |
| June projection | 2.3 to 2.5 | 1.5 to 2.0 | 1.5 to 2.0 | n.a. | 1.7 to 2.0 | 2.1 to 3.5 | 1.2 to 2.8 | 1.3 to 2.5 | n.a. | 1.5 to 2.0 |
| Core PCE inflation3 | 1.8 to 1.9 | 1.5 to 2.0 | 1.4 to 1.9 | 1.5 to 2.0 | 1.7 to 2.0 | 1.3 to 2.1 | 1.4 to 2.1 | 1.4 to 2.2 | ||
| June projection | 1.5 to 1.8 | 1.4 to 2.0 | 1.4 to 2.0 | n.a. | 1.5 to 2.3 | 1.2 to 2.5 | 1.3 to 2.5 | n.a. | ||
1. The central tendency excludes the three highest and three lowest projections for each variable in each year. Return to table
2. The range for a variable in a given year consists of all participants' projections, from lowest to highest, for that variable in that year. Return to table
3. Longer-run projections for core PCE inflation are not collected. Return to table
Figure 1. Central tendencies and ranges of economic projections, 2011-14 and over the longer run*
Accessible version of figure 1 | Return to figure 1
The Outlook
Participants marked their forecasts down significantly for real GDP growth in 2011, with the central tendency of their projections forming a narrow band from 1.6 to 1.7 percent, down from 2.7 to 2.9 percent in June. Participants stated that the downward revision reflected the body of economic data received since June, particularly the comprehensive annual revisions and the estimate of second-quarter GDP published by the Bureau of Economic Analysis, which showed that the expansion in real GDP in the first half of the year had been considerably slower than the participants had expected at the time of their June projections. More-recent data indicated that output growth strengthened during the third quarter, reflecting in part a reversal of the temporary factors that had weighed on real activity earlier in the year, including the damping effect of higher food and energy prices on consumer purchasing power and spending as well as supply chain disruptions associated with the disaster in Japan. However, several participants indicated that some of the factors contributing to the slowdown in GDP growth earlier in the year, including reduced spending by state and local governments, were likely to be more persistent. Participants also noted that heightened uncertainty regarding economic and financial developments, as well as low confidence among businesses and consumers, continued to restrain economic activity.
Looking further ahead, participants continued to expect a moderate pickup in the pace of the economic recovery over the next couple of years, albeit to growth rates somewhat below those previously projected. The central tendency of participants' projections for output growth in 2012 was 2.5 to 2.9 percent, followed by central tendencies of 3.0 to 3.5 percent in 2013 and 3.0 to 3.9 percent in 2014. Participants anticipated that the economic expansion would be supported by continued monetary policy accommodation, reduced commodity cost pressures, strengthening household balance sheets, and improving financial conditions. However, in downgrading the trajectory of their projections compared with those in June, participants cited a number of forces that were likely to restrain the pace of output growth over the next few years, including tighter fiscal policy at all levels of government, ongoing drag from the troubled housing sector, volatility in financial markets, and possibly reduced external demand. Many also pointed to the additional headwinds of still-tight credit conditions for some households and smaller businesses, weak consumer and business sentiment, persistently high unemployment, and slow income growth. In addition, some participants noted that although energy and commodity prices had fallen back, they remain at elevated levels that might weigh on spending for a time. The central tendency of participants' projections for the longer-run rate of real GDP growth, in the absence of further shocks, was 2.4 to 2.7 percent, a bit slower than projected in June.
In response to the ongoing weakness in labor market conditions and the downward revisions to their assessments of the economic outlook, participants marked up their forecasts for the unemployment rate over the forecast period. For the fourth quarter of this year, the central tendency of participants' projections rose to 9.0 to 9.1 percent from 8.6 to 8.9 percent reported in June. Similar upward revisions were made for 2012 and 2013, with the central tendencies of the unemployment rate projections for those years now at 8.5 to 8.7 percent and 7.8 to 8.2 percent, respectively. The central tendency of their unemployment rate projections for the end of 2014 was 6.8 to 7.7 percent, indicating expectations for an ongoing, gradual improvement in the employment situation, but one that continued to leave the unemployment rate well above the 5.2 to 6.0 percent central tendency of participants' estimates of the unemployment rate that would prevail over the longer run in the absence of further shocks. The upper bound of the central tendency of participants' longer-run projections was higher than in June, although the range of participants' estimates was unchanged.
Participants noted that measures of consumer price inflation had increased this year relative to both their levels in 2010 and the projections made in June, reflecting in part higher prices of oil and other commodities that had larger effects than previously expected. The central tendency of their estimates for total personal consumption expenditures (PCE) inflation in 2011 rose to 2.7 to 2.9 percent compared with 2.3 to 2.5 percent in June. Most participants anticipated that the influence of higher commodity prices and supply chain disruptions from Japan would be temporary and that inflation pressures in the next several years would be subdued as commodity prices stabilized, inflation expectations remained well anchored, and large margins of slack in labor markets kept labor costs in check. As a result, the central tendency of participants' projections of total PCE inflation was about 1.5 to 2.0 percent in 2012, 2013, and 2014, similar to their forecasts in June and at or slightly below the 1.7 to 2.0 percent central tendency of their estimates of the longer-run, mandate-consistent rate of inflation. The central tendency of participants' projections of core PCE inflation in 2011 shifted up to 1.8 to 1.9 percent, compared with 1.5 to 1.8 percent in June, as some of this year's run-up in commodity prices passed through to core prices. However, the central tendencies of the projections of core inflation for the next three years were approximately 1.5 to 2.0 percent, essentially unchanged from their June levels and roughly similar to participants' projections for headline inflation.
Table 2. Average historical projection error ranges
Percentage points
| Variable | 2011 | 2012 | 2013 | 2014 |
|---|---|---|---|---|
| Change in real GDP1 | ±0.6 | ±1.4 | ±1.7 | ±1.8 |
| Unemployment rate1 | ±0.2 | ±0.9 | ±1.5 | ±1.8 |
| Total consumer prices2 | ±0.5 | ±0.9 | ±1.0 | ±1.0 |
Note: Error ranges shown are measured as plus or minus the root mean squared error of projections for 1991 through 2010 that were released in the summer by various private and government forecasters. As described in the box "Forecast Uncertainty," under certain assumptions, there is about a 70 percent probability that actual outcomes for real GDP, unemployment, and consumer prices will be in ranges implied by the average size of projection errors made in the past. Further information is in David Reifschneider and Peter Tulip (2007), "Gauging the Uncertainty of the Economic Outlook from Historical Forecasting Errors," Finance and Economics Discussion Series 2007-60 (Washington: Board of Governors of the Federal Reserve System, November).
1. For definitions, refer to general note in table 1. Return to table
2. Measure is the overall consumer price index, the price measure that has been most widely used in government and private economic forecasts. Projection is percent change, fourth quarter of the previous year to the fourth quarter of the year indicated. Return to table
Uncertainty and Risks
In their assessments of the uncertainty and risks associated with their projections, a substantial majority of participants continued to judge that the levels of uncertainty associated with their projections for economic growth, the unemployment rate, and inflation were greater than the average levels that had prevailed over the past 20 years.1 They pointed to a number of factors that raised their assessments of uncertainty regarding output growth and unemployment, including concerns about the ongoing developments in Europe, the severity of the recent recession, and the pace at which the numerous financial and economic headwinds buffeting the economy will recede. However, slightly fewer participants reported a higher-than-average degree of uncertainty around their inflation projections than in June. Participants noted that uncertainties about the pace of economic recovery and the effects of the Federal Reserve's extraordinary monetary policy accommodation, as well as the timing of exit from it, were significant sources of uncertainty in the outlook for inflation. However, a number of participants highlighted that inflation currently remains anchored by stable longer-term inflation expectations.
Although several participants noted that the risks of a near-term recession had likely diminished, most participants continued to judge that the balance of risks to economic growth was weighted to the downside (that is, they judged that economic growth was more likely to be below their projection of its most likely outcome than above it). The remaining participants saw the risks as balanced. The most frequently cited downside risks to growth included possible financial market and economic spillovers from an intensification of the financial strains in Europe, vulnerabilities related to weak consumer and business confidence, the possible effects on spending of uncertainties about regulatory policy, and the potential consequences of larger-than-expected near-term fiscal consolidation. The risks surrounding participants' forecasts of the unemployment rate shifted higher, with a larger number of participants relative to June viewing the risks to their projections as weighted to the upside, and the remaining participants seeing the risks as broadly balanced.
A majority of the participants continued to judge the risks to their projections of overall and core inflation to be broadly balanced. Compared with their assessments in June, a smaller number of participants viewed the risks to inflation as being weighted to the upside, and more participants indicated that the risks were weighted to the downside; the changes left the number of participants who saw a skew in either direction more evenly distributed. Some participants saw a risk that elevated resource slack could put more downward pressure on inflation than expected. Nevertheless, some participants noted the risk that commodity prices could experience renewed volatility or have a longer-lasting influence than expected. A few participants pointed to the possibility that the current highly accommodative stance of monetary policy, if it were maintained for longer than is appropriate, could lead to higher inflation expectations and actual inflation; some also thought that fiscal imbalances could have a similar effect.
Figure 2. Uncertainty and risks in economic projections*
Accessible version of figure 2. | Return to figure 2.
Diversity of Views
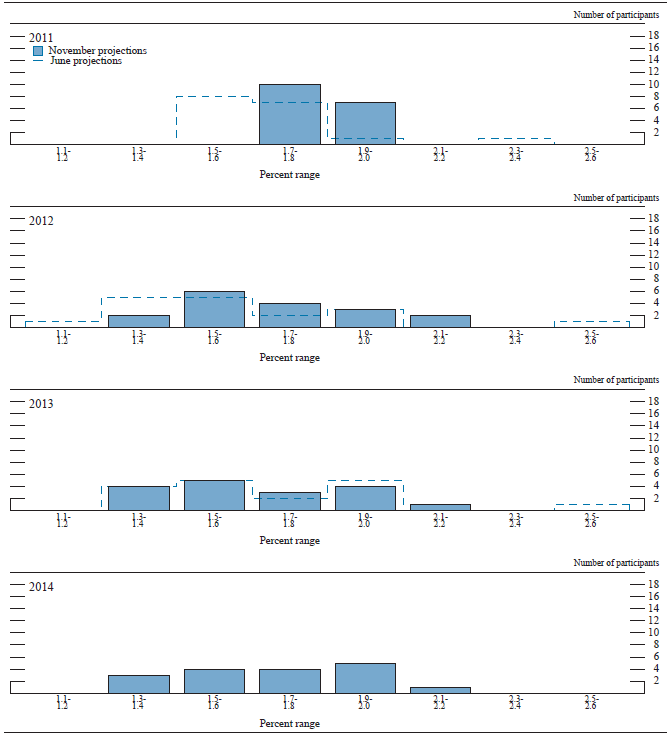
Figures 3.A and 3.B provide further details on the diversity of participants' views regarding the likely outcomes for real GDP growth and the unemployment rate over the next few years and over the longer run. The dispersion in these projections continued to reflect differences in participants' assessments of many factors, including the underlying momentum in economic activity, appropriate future monetary policy and its effects on economic activity, the effects of the European situation, and the future path of U.S. fiscal policy. With much of the data for 2011 now in hand, the dispersion of participants' projections of output growth and the unemployment rate this year narrowed substantially relative to June. The range of participants' projections for these variables in 2012 and 2013 also narrowed somewhat; however, the range of projections for real GDP growth in each of those years shifted to the lower end of the range of their June projections, and the range of projections for the unemployment rate shifted to the higher end of the June distribution. The dispersion associated with participants' longer-run projections of output growth and the unemployment rate changed very little, although the dispersion of their
projections in 2014 exceeded the dispersion of their longer-run ranges, suggesting greater agreement among policymakers about the economy's longer-run performance than the path of convergence toward it. A sizable majority of the participants judged that, in the absence of any additional shocks, the economy would converge fully to its longer-run rates of GDP growth, unemployment, and inflation within about five or six years; a few participants indicated that convergence might take a longer period of time, and one participant believed convergence could occur more rapidly.
Figures 3.C and 3.D provide corresponding information about the diversity of participants' outlooks for inflation. The center of mass of the distributions of participants' projections for overall and core PCE inflation in 2011 shifted to the right relative to the ranges of these projections provided in June. The dispersion of projections for total PCE inflation in 2012 and 2013 changed little, although the top end of the range of participants' projections was somewhat higher than that of their projections for core inflation, suggesting that a few participants are concerned that elevated price increases for food and energy will persist for a time. The dispersion of projections for core inflation narrowed somewhat, driven predominantly by a decline in the upper end of the ranges. The ranges of inflation projections for 2014 were similar to those for 2012 and 2013. In general, the dispersion of participants' inflation forecasts for the next few years represented differences in judgments regarding the fundamental determinants of inflation, including the degree of resource slack and the extent to which resource slack influences inflation outcomes and expectations, as well as estimates of how the stance of monetary policy may influence inflation expectations. By contrast, the unchanged and relatively concentrated distribution of participants' projections for overall inflation over the longer run continued to reflect broad similarity in participants' assessments of the approximate level of inflation that is consistent with the Federal Reserve's dual objectives of maximum employment and price stability.
Figure 3.A. Distribution of participants' projections for the change in real GDP, 2011-14 and over the longer run*
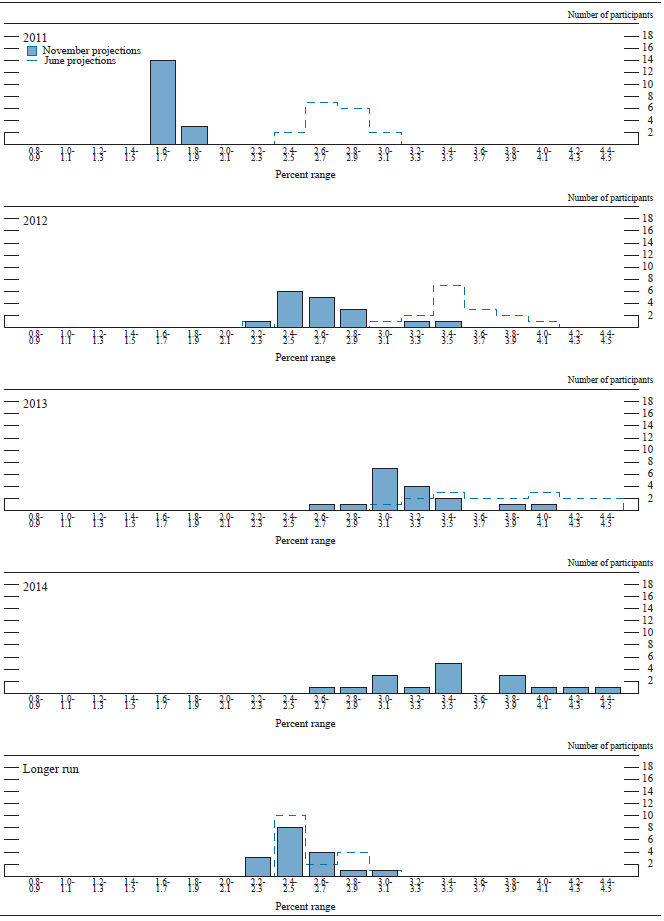
Accessible version of figure 3.A. | Return to figure 3.A.
Figure 3.B. Distribution of participants' projections for the unemployment rate, 2011-14 and over the longer run*
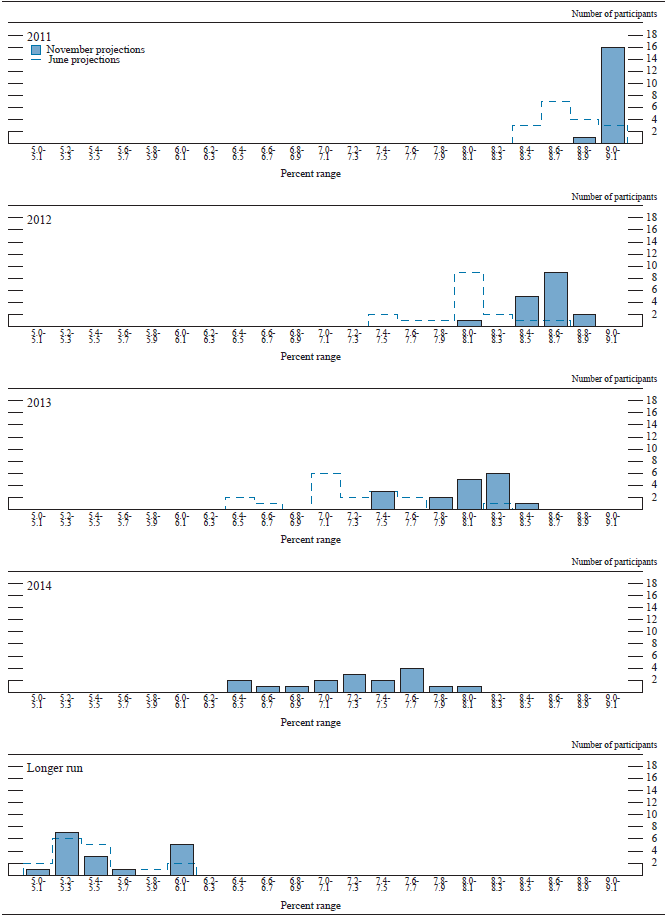
Accessible version of figure 3.B. | Return to figure 3.B.
Figure 3.C. Distribution of participants' projections for PCE inflation, 2011-14 and over the longer run*
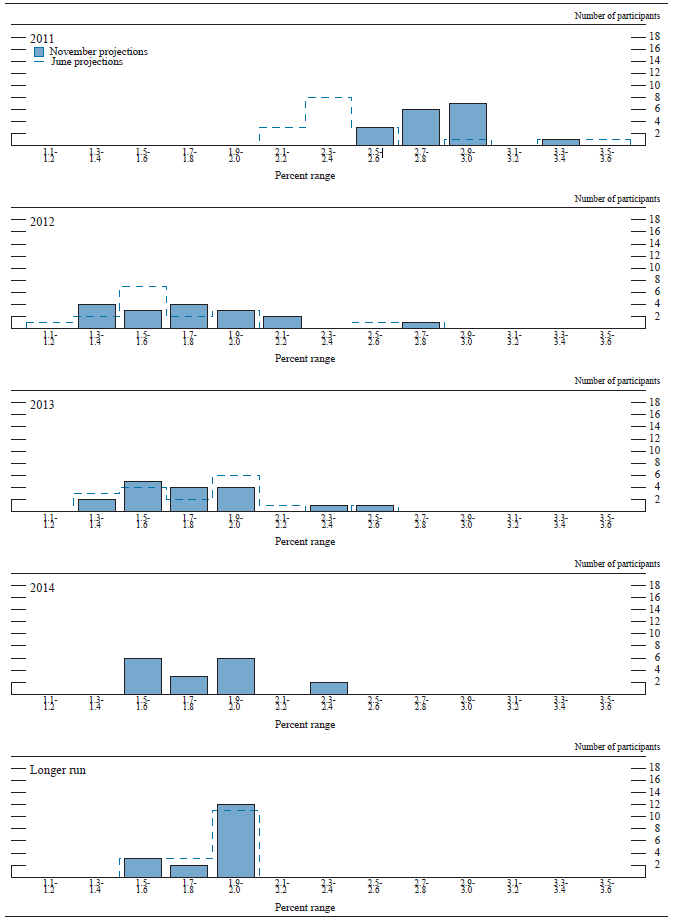
Accessible version of figure 3.C. | Return to figure 3.C.
Figure 3.D. Distribution of participants' projections for core PCE information, 2011-14*
Accessible version of figure 3.D. | Return to figure 3.D.
The economic projections provided by the members of the Board of Governors and the presidents of the Federal Reserve Banks inform discussions of monetary policy among policymakers and can aid public understanding of the basis for policy actions. Considerable uncertainty attends these projections, however. The economic and statistical models and relationships used to help produce economic forecasts are necessarily imperfect descriptions of the real world, and the future path of the economy can be affected by myriad unforeseen developments and events. Thus, in setting the stance of monetary policy, participants consider not only what appears to be the most likely economic outcome as embodied in their projections, but also the range of alternative possibilities, the likelihood of their occurring, and the potential costs to the economy should they occur.
Table 2 summarizes the average historical accuracy of a range of forecasts, including those reported in past Monetary Policy Reports and those prepared by the Federal Reserve Board's staff in advance of meetings of the Federal Open Market Committee. The projection error ranges shown in the table illustrate the considerable uncertainty associated with economic forecasts. For example, suppose a participant projects that real gross domestic product (GDP) and total consumer prices will rise steadily at annual rates of, respectively, 3 percent and 2 percent. If the uncertainty attending those projections is similar to that experienced in the past and the risks around the projections are broadly balanced, the numbers reported in table 2 would imply a probability of about 70 percent that actual GDP would expand within a range of 2.4 to 3.6 percent in the current year, 1.6 to 4.4 percent in the second year, 1.3 to 4.7 percent in the third year, and 1.2 to 4.8 percent in the fourth year. The corresponding 70 percent confidence intervals for overall inflation would be 1.5 to 2.5 percent in the current year, 1.1 to 2.9 percent in the second year, and 1.0 to 3.0 percent in the third and fourth years.
Because current conditions may differ from those that prevailed, on average, over history, participants provide judgments as to whether the uncertainty attached to their projections of each variable is greater than, smaller than, or broadly similar to typical levels of forecast uncertainty in the past, as shown in table 2. Participants also provide judgments as to whether the risks to their projections are weighted to the upside, are weighted to the downside, or are broadly balanced. That is, participants judge whether each variable is more likely to be above or below their projections of the most likely outcome. These judgments about the uncertainty and the risks attending each participant's projections are distinct from the diversity of participants' views about the most likely outcomes. Forecast uncertainty is concerned with the risks associated with a particular projection rather than with divergences across a number of different projections.

