- February 24, 2015: Summary
- Part 1
- Part 2
- Part 3
- Abbreviations
- Printable Version (1.21 MB PDF)

Sections of Part 1
Part 1: Recent Economic and Financial Developments
Monetary Policy Report submitted to the Congress on February 24, 2015, pursuant to section 2B of the Federal Reserve ActThe labor market continued to improve in the second half of last year and early this year. Job gains have averaged close to 280,000 per month since June, and the unemployment rate fell from 6.1 percent in June to 5.7 percent in January. Even so, the labor market likely has not yet fully recovered, and wage growth has remained slow. Since June, a steep drop in crude oil prices has exerted downward pressure on overall inflation, and non-energy price increases have been subdued as well. The price index for personal consumption expenditures (PCE) increased only 3/4 percent during the 12 months ending in December, a rate that is well below the Federal Open Market Committee's (FOMC) longer-run objective of 2 percent; the index excluding food and energy prices was up 1-1/4 percent over this period. Survey measures of longer-run inflation expectations have been stable, but measures of inflation compensation derived from financial market quotes have moved down. Meanwhile, real gross domestic product (GDP) increased at an estimated annual rate of 3-3/4 percent in the second half of the year, up from a reported rate of just 1-1/4 percent in the first half. The growth in GDP has been supported by accommodative monetary policy and generally favorable financial conditions, the boost to households' purchasing power from lower oil prices, and improving consumer and business confidence. However, housing market activity has been advancing only slowly, and sluggish growth abroad and the higher foreign exchange value of the dollar have weighed on net exports. Longer-term interest rates in the United States and other advanced economies declined, on net, amid disappointing growth and low inflation abroad and the associated actual and anticipated accommodative monetary policy actions by foreign central banks.
Domestic Developments
The labor market has strengthened further...
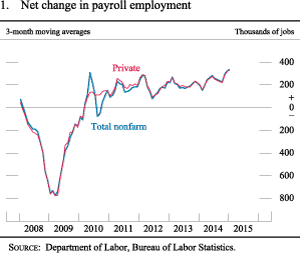
Employment rose appreciably and the unemployment rate fell in the second half of 2014 and early this year. Payroll employment has increased by an average of about 280,000 per month since June, almost 40,000 faster than in the first half of last year (figure 1). The gain in payroll employment for 2014 as a whole was the largest for any year since 1999. In addition, the unemployment rate continued to move down, declining from 6.1 percent in June to 5.7 percent in January of this year, a rate more than 4 percentage points below its peak in 2009. Furthermore, a substantial portion of the decline in unemployment over the past year came from a decrease in the number of individuals reporting unemployment spells longer than six months.
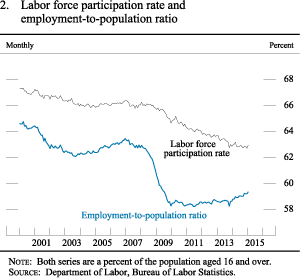
The labor force participation rate has been roughly flat since late 2013 after having declined not only during the recession, but also during much of the recovery period when most other indicators of labor market health were improving figure 2. While much of that decline likely reflected ongoing demographic trends--such as the aging of members of the baby-boom generation into their retirement years--some of the decline likely reflected workers' perceptions of poor job opportunities. Judged against the backdrop of a declining trend, the recent stability of the participation rate likely represents some cyclical improvement. Nevertheless, the participation rate remains lower than would be expected given the unemployment rate, and thus it continues to suggest more cyclical weakness than is indicated by the unemployment rate.
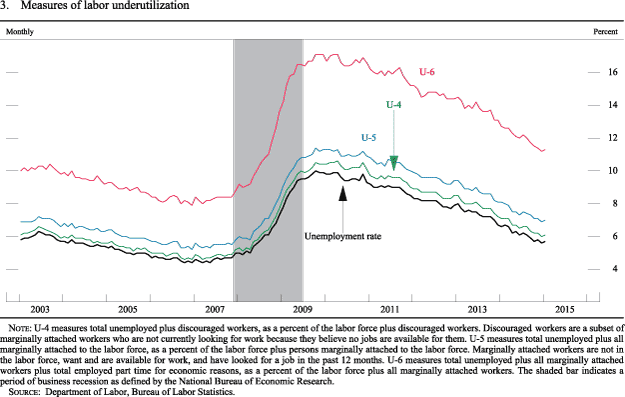
Another sign that the labor market remains weaker than indicated by the unemployment rate alone is the still-elevated share of workers who are employed part time but would like to work full time. This share of involuntary part-time employees has generally shown less improvement than the unemployment rate over the past few years; in part for this reason, the more comprehensive U-6 measure of labor underutilization remains quite elevated (figure 3).
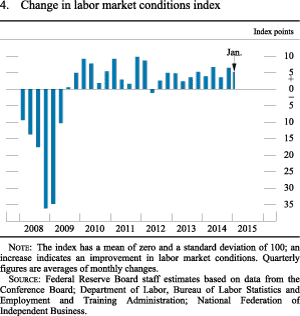
Nevertheless, most broad measures of labor market health have improved. With employment rising and the participation rate holding steady, the employment-to-population ratio climbed noticeably higher in 2014 and early 2015 after having moved more or less sideways for much of the recovery. The quit rate, which is often perceived as a measure of worker confidence in labor market opportunities, has largely recovered to its pre-recession level. Moreover, an index constructed by Federal Reserve Board staff that aims to summarize movements in a wide array of labor market indicators also suggests that labor market conditions strengthened further in 2014, and that the gains have been quite strong in recent months (figure 4).1
...while gains in compensation have been modest...
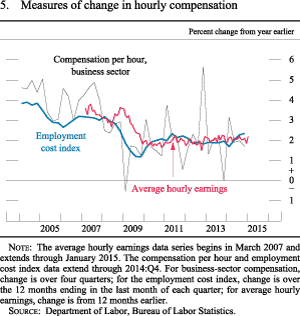
Even as the labor market has been improving, most measures of labor compensation have continued to show only modest gains. The employment cost index (ECI) for private industry workers, which measures both wages and the cost of employer-provided benefits, rose 2-1/4 percent over the 12 months ending in December, only slightly faster than the gains of about 2 percent that had prevailed for several years. Two other prominent measures of compensation--average hourly earnings and business-sector compensation per hour--increased slightly less than the ECI over the past year and have shown fewer signs of acceleration (figure 5). Over the past five years, the gains in all three of these measures of nominal compensation have fallen well short of their pre-recession averages and have only slightly outpaced inflation. That said, the drop in energy prices has pushed up real wages in recent months.
...and productivity growth has been lackluster
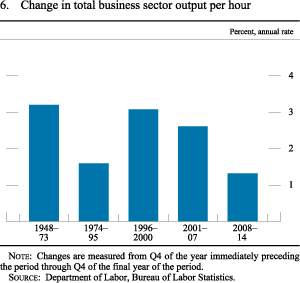
Over time, increases in productivity are the central determinant of improvements in living standards. Labor productivity in the private business sector has increased at an average annual pace of 1-1/4 percent since the recession began in late 2007. This pace is close to the average that prevailed between the mid-1970s and the mid-1990s, but it is well below the pace of the earlier post-World War II period and the period from the mid-1990s to the eve of the financial crisis (figure 6). In recent years, productivity growth has been held down by, among other factors, the sharp drop in businesses' capital expenditures over the recession and the moderate recovery in expenditures since then. Productivity gains may be better supported in the future as investment continues to strengthen.
A plunge in crude oil prices has held down consumer prices...
As discussed in the box "The Effect of the Recent Decline in Oil Prices on Economic Activity," crude oil prices have plummeted since June 2014. This sharp drop has caused overall consumer price inflation to slow, mainly due to falling gasoline prices: The national average of retail gasoline prices moved down from about $3.75 per gallon in June to about $2.20 per gallon in January. Crude oil prices have turned slightly higher in recent weeks, and futures markets suggest that prices are expected to edge up further in coming years; nevertheless, oil prices are still expected to remain well below the levels that had prevailed through last June.
Over the past six months, increases in food prices have moderated. Consumer food price increases had been somewhat elevated in early 2014 as a result of rising food commodity prices, but those commodity prices have since eased, and increases at the retail level have slowed accordingly.
The Effect of the Recent Decline in Oil Prices on Economic Activity
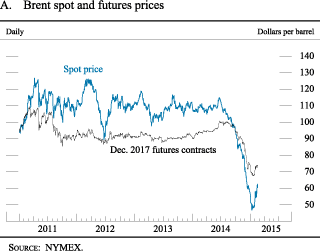
Since June, the price of crude oil has fallen sharply, on net, with the spot price of Brent (the blue line in figure A) dropping about 50 percent and the price of the December 2017 futures contract (the black line in figure A) declining about 25 percent. Although weaker-than-expected global oil demand has contributed to the fall in prices, much of the decline is likely due to favorable supply factors, including the rapid growth of U.S. oil production, the surprising strength of oil exports from Libya and Iraq, and OPEC's decision to maintain production levels despite declining prices. The drop in oil prices has a number of economic implications, including a sizable but temporary reduction in consumer price inflation. This discussion reviews some of the channels through which the recent fall in oil prices is anticipated to affect economic activity in the United States and globally.
One important channel through which a decline in oil prices affects the global economy is the transfer of wealth from oil producers to oil consumers. As shown in the table, the largest net oil-importing countries--and thus the prime beneficiaries of lower oil prices--are the emerging Asian economies, Japan, the euro area, and, despite recent sharp increases in oil production, the United States.1 Losses are concentrated in the oil-producing countries, including those of the Middle East, Russia, Venezuela, and, to a lesser extent, Canada and Mexico. (Lower oil prices have also destabilized financial markets in Russia and Venezuela.) Globally, the wealth transfer nets to zero, but the overall effect on global economic activity is likely to be stimulative in the near term; oil consumers tend to spend a substantial portion of the windfall, while oil producers generally absorb at least some of the initial effect through reduced saving or higher borrowing.
Net oil and petroleum product exports
| Millions of barrels per day | Percent of GDP | |
|---|---|---|
| Emerging Asia ex. China | -9.9 | -5.9 |
| Japan | -4.4 | -3.7 |
| Euro area | -9.2 | -3.0 |
| China | -5.8 | -2.6 |
| United States | -6.6 | -1.6 |
| Central and South America ex. Venezuela | -0.8 | -0.8 |
| Mexico | 0.9 | 2.8 |
| Canada | 1.6 | 3.7 |
| Russia | 7.0 | 13.8 |
| Middle East | 19.1 | 29.8 |
| Venezuela | 1.7 | 31.0 |
Note: The data are for 2013. Share of GDP is an approximation based on net export volumes valued at the Brent price on June 17, 2014 ($113.30). GDP is gross domestic product.
Source: Department of Energy; International Monetary Fund.
In the United States, the wealth transfer just discussed is likely to be most apparent in supporting consumer spending, as lower gasoline prices boost the real disposable income of consumers. Indeed, the recent rise in consumer sentiment and improvements in survey measures of expected income growth suggest that households are reacting quite positively to lower gasoline prices.
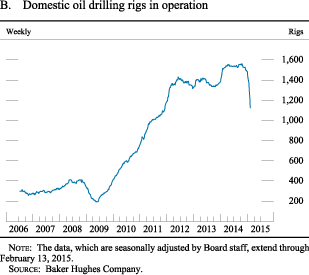
The stimulus from higher U.S. consumption is likely to be somewhat offset by reduced investment in the oil sector. Already there has been a sharp decline in the number of oil drilling rigs in operation figure B), and a number of oil companies have cut their capital expenditure plans. Nonetheless, the direct effect on U.S. gross domestic product (GDP) of such a decline will be small because investment in the oil sector--though rising in recent years--accounts for only about 1 percent of GDP.
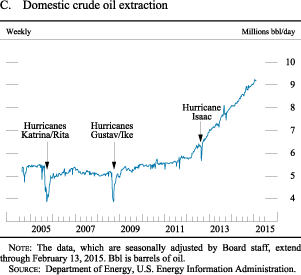
Lower oil-sector investment is likely to weigh on U.S. oil production, which has grown at a torrid pace in recent years (figure C). So far, however, U.S. oil production has yet to decline. The continued strength of production despite falling investment reflects both a propensity to cut investment in the least productive projects first and a large stock of partially completed wells that are likely to still come on line.
While there is a general consensus that lower oil prices should boost U.S. and global economic activity, considerable uncertainty exists regarding the ultimate size of the effect. All in all, however, for the United States as a whole, it is likely that the additional disposable income resulting from lower gasoline prices will provide a significant boost to consumer spending that will far exceed the drag from lower investment in the oil sector.
Footnotes
1. Although many of the largest oil importers also are oil producers, and thus have some domestic losses as well as gains, net exports of oil by country provides a useful proxy for the global distribution of gains and losses following a price change. Return to text
...but even outside of the energy and food categories, inflation has remained subdued
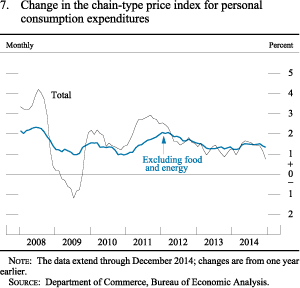
Inflation for items other than food and energy (so-called core inflation) remains modest. Core PCE prices rose at an annual rate of only about 1 percent over the last six months of 2014 after having risen at a 1-3/4 percent rate in the first half of the year; for 2014 as a whole, core PCE prices were up a little more than 1-1/4 percent (figure 7). The trimmed mean PCE price index, an alternative indicator of underlying inflation constructed by the Federal Reserve Bank of Dallas, also increased more slowly in the second half of last year. Falling import prices likely held down core inflation in the second half of the year; lower oil prices, and easing prices for commodities more generally, may have played a role as well. In addition, ongoing resource slack has reinforced the low-inflation environment, though with the improving economy, downward pressure from this factor is likely waning.
Looking at the overall basket of items that people consume, price increases remain muted and below the FOMC's longer-run objective of 2 percent. In December, the PCE price index was only 3/4 percent above its level from a year earlier. With retail surveys showing a further sharp decline in gasoline prices in January, overall consumer prices likely moved lower early this year.
Survey-based measures of longer-term inflation expectations have remained stable, while market-based measures of inflation compensation have declined
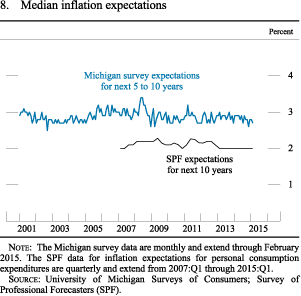
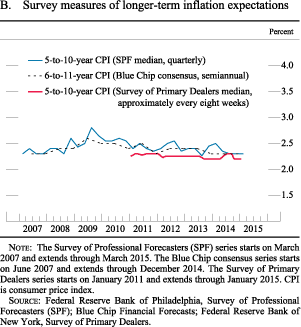
The Federal Reserve tracks indicators of inflation expectations because such expectations likely factor into wage- and price-setting decisions and so influence actual inflation. Survey-based measures of longer-term inflation expectations, including surveys of both households and professional forecasters, have been quite stable over the past 15 years; in particular, they have changed little, on net, over the past few years (figure 8). In contrast, measures of longer-term inflation compensation derived from financial market instruments have fallen noticeably during the past several months. As is discussed in more detail in the box "Challenges in Interpreting Measures of Longer-Term Inflation Expectations," deducing the sources of changes in inflation compensation is difficult because such movements may be caused by factors other than shifts in market participants' inflation expectations.
Challenges in Interpreting Measures of Longer-Term Inflation Expectations
In many economic models, inflation expectations are an important determinant of the behavior of actual inflation. For this reason, measures of inflation expectations are widely followed. Although none of the available measures is perfect, surveys of individuals, economists, and professional forecasters all shed some light on the inflation expectations of different groups. For the most part, these survey-based measures have been quite stable in recent years in the United States. Many analysts credit that stability with helping to keep the variation in actual inflation fairly limited despite pressures (such as the deep recession and sharp changes in energy prices) that might have had the potential to induce more substantial and long-lasting changes in inflation.
Measures of expected inflation can also be derived from financial instruments whose payouts are linked to inflation. For example, inflation compensation implied by Treasury Inflation-Protected Securities (TIPS), known as the TIPS breakeven inflation rate, is defined as the difference, at comparable maturities, between yields on nominal Treasury securities and yields on TIPS, which are indexed to headline consumer price index (CPI) inflation. Inflation swaps--contracts in which one party makes payments of certain fixed nominal amounts in exchange for cash flows that are indexed to cumulative CPI inflation over some horizon--provide alternative measures of inflation compensation. These measures of inflation compensation provide information about market participants' expectations of inflation, but that information is generally obscured by other sources of variation.
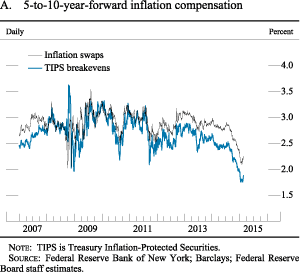
Both of those market-based measures of inflation compensation have declined noticeably since early August (figure A). Focusing on inflation compensation 5 to 10 years ahead is useful, particularly for monetary policy, because it gives a sense of where market participants expect inflation to settle in the long term after developments influencing inflation in the short term have run their course. The 5-to-10-year-forward inflation compensation measure computed from TIPS fell from an annual rate of around 2-1/2 percent in early August to below 2 percent in January; over the same period, the swaps-based measure fell from around 2-3/4 percent to a little more than 2 percent. Market participants have offered several potential explanations for these declines, including the effects of the plunge in oil prices and soft readings on overall and core inflation as well as concerns about the global growth outlook and disinflationary pressure abroad.1
The Federal Open Market Committee's (FOMC) 2 percent inflation objective is stated in terms of the price index for personal consumption expenditures (PCE), and PCE price inflation tends to run a few tenths of a percentage point lower, on average, than the CPI inflation used in pricing TIPS and inflation swaps. Thus, if these recent readings on inflation compensation could be interpreted as direct measures of expected CPI inflation, then they would probably correspond to expectations for PCE inflation that are lower than the Committee's objective. Recent FOMC statements have noted that the Committee will monitor both survey measures and these market-based inflation compensation measures closely.
Inflation compensation is distinct from inflation expectations, however, as both TIPS- and swaps-based measures of inflation compensation reflect not only expected inflation, but also an inflation risk premium--the compensation that holders of nominal securities demand for bearing inflation risk--as well as other premiums driven by liquidity differences and shifts in the relative supply and demand of nominal versus inflation-indexed securities. Federal Reserve System staff maintain several term structure models aimed at disentangling the various components of inflation compensation and providing estimates of inflation expectations and risk premiums.2 Most staff models suggest that 5-to-10-year inflation expectations have remained relatively stable since last summer. Instead, the models tend to attribute at least part of the decline in inflation compensation to some reduction in inflation risk premiums and the effects of the other factors included in the models. However, these models cannot fully explain the recent decline in inflation compensation.
Distributions of future inflation derived from surveys and inflation options also display an interesting divergence. Distributions of inflation 5 to 10 years ahead that are derived from surveys of primary dealers have remained stable since last summer--consistent with the stability of the other survey measures cited earlier. In contrast, information gleaned from 10-year inflation options (that is, caps and floors, which pay the holder when inflation is higher or lower than specified levels) suggests that investors may have recently become more concerned about lower inflation outcomes and less concerned about higher inflation outcomes. This shift could reflect an increase in the investors' perceived likelihood of low inflation outcomes, but it could also reflect an increased willingness to pay higher premiums for insurance against such outcomes as well as other possible factors depressing long-horizon inflation compensation.
Thus, the results from the Federal Reserve's staff models are consistent with readings from surveys of primary dealers, economists, professional forecasters, and consumers, all of which indicate that longer-run inflation expectations have remained generally stable (figure B). However, given the uncertainties in inferring inflation expectations from the market measures of inflation compensation, one cannot rule out a decline in inflation expectations among market participants.
Footnotes
1. In support of the latter explanation, market participants also noted the decline of inflation compensation abroad, in particular in the euro area. One possible reason for the effects of oil prices and realized inflation on longer-term inflation compensation is that, in response to changes in the intermediate-term inflation outlook, investors are reportedly more likely to adjust their positions in the more recently issued, and thus more liquid, longer-term TIPS rather than the older-vintage TIPS with shorter remaining maturities. Return to text
2. For further details, see Michael Abrahams, Tobias Adrian, Richard Crump, and Emanuel Moench (2012), "Decomposing Real and Nominal Yield Curves," Federal Reserve Bank of New York Staff Reports , no. 570 (New York: FRB New York, September, revised October 2013), www.newyorkfed.org/research/staff_reports/sr570.html ![]() ; and Joseph G. Haubrich, George G. Pennacchi, and Peter Ritchken (2012), "Inflation Expectations, Real Rates, and Risk Premia: Evidence from Inflation Swaps,"Review of Financial Studies, vol. 25 (5), pp. 1588–629. Return to text
; and Joseph G. Haubrich, George G. Pennacchi, and Peter Ritchken (2012), "Inflation Expectations, Real Rates, and Risk Premia: Evidence from Inflation Swaps,"Review of Financial Studies, vol. 25 (5), pp. 1588–629. Return to text
Economic activity expanded at a strong pace in the second half of 2014
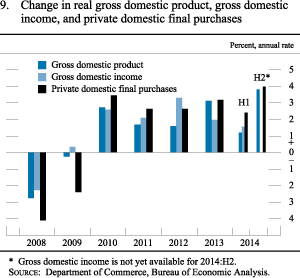
Real GDP is estimated to have increased at an annual rate of 3-3/4 percent in the second half of last year after a reported increase of just 1-1/4 percent in the first half, when output was likely restrained by severe weather and other transitory factors (figure 9). Private domestic final purchases--a measure of household and business spending that tends to exhibit less quarterly variation than GDP--also advanced at a substantial pace in the second half of last year.
The second-half gains in GDP reflected solid advances in consumer spending and in business investment spending on equipment and intangibles (E&I) as well as subdued gains for both residential investment and nonresidential structures. More generally, the growth in GDP has been supported by accommodative financial conditions, including declines in the cost of borrowing for many households and businesses; by a reduction in the restraint from fiscal policy relative to 2013; and by increases in spending spurred by continuing job gains and, more recently, by falling oil prices. The gains in GDP have occurred despite an appreciating U.S. dollar and concerns about global economic growth, which remain an important source of uncertainty for the economic outlook.
Consumer spending was supported by continuing improvement in the labor market and falling oil prices, ...
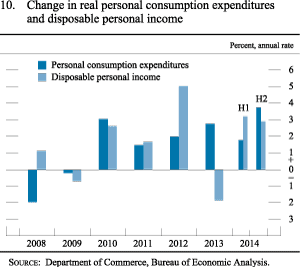
Real PCE rose at an annual rate of 3-3/4 percent in the second half of 2014--a noticeable step-up from the sluggish rate of only about 2 percent in the first half (figure 10). The increases in spending have been supported by the improving labor market. In addition, the fall in gasoline and other energy prices has boosted purchasing power for consumers, especially those in lower- and middle-income brackets who spend a sizable share of their income on gasoline. Real disposable personal income--that is, income after taxes and adjusted for price changes--rose 3 percent at an annual rate in the second half of last year, roughly double the average rate recorded over the preceding five years.
...further increases in household wealth and low interest rates, ...
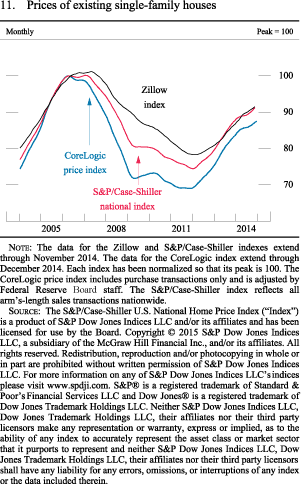
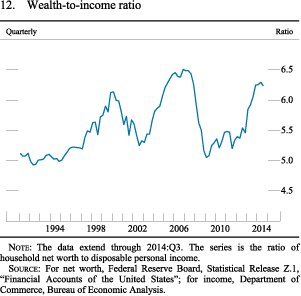
Consumer spending growth was also likely supported by further increases in household net worth, as the stock market continued to rise and house prices moved up in the second half of last year. The value of corporate equities rose about 10 percent in 2014, on top of the 30 percent gain seen in 2013. Although the gains in house prices slowed last year--for example, the CoreLogic national index increased only 5 percent after having risen more substantially in 2012 and 2013--these gains affected a larger share of the population than did the gains in equities, as more individuals own homes than own stocks (figure 11). Reflecting increases in home and equity prices, aggregate household net wealth has risen appreciably from its levels during the recession and its aftermath to more than six times the value of disposable personal income (figure 12).
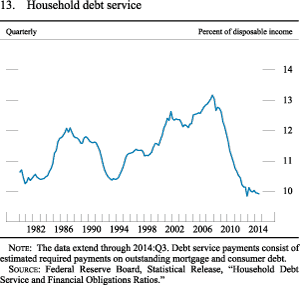
Coupled with low interest rates, the rise in incomes has lowered debt payment burdens for many households. The household debt service ratio--that is, the ratio of required principal and interest payments on outstanding household debt to disposable personal income--has remained at a very low level by historical standards (figure 13).
. . . and increased credit availability for consumers
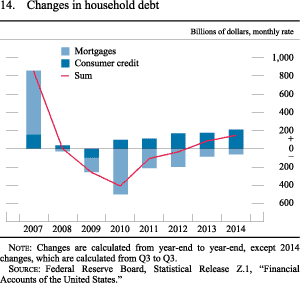
Consumer credit continued to expand through late 2014, as auto and student loans have remained available even to borrowers with lower credit scores (figure 14). In addition, credit cards have become somewhat more accessible to individuals on the lower end of the credit spectrum, and overall credit card debt increased moderately last year.
Consumer confidence has moved up
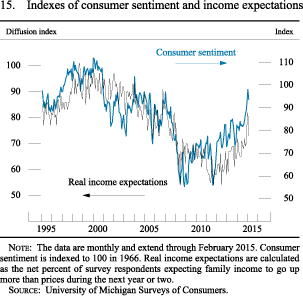
Consistent with the improvement in the labor market and the fall in energy prices, indicators of consumer sentiment moved up noticeably in the second half of last year. The University of Michigan Surveys of Consumers' index of consumer sentiment--which incorporates households' views about their own financial situations as well as broader economic conditions--has moved up strongly, on net, in recent months and is now close to its long-run average (figure 15). The Michigan survey's measure of households' expectations of real income changes in the year ahead has also continued to trend up over the past several months, perhaps reflecting the fall in gasoline prices. However, this measure remains substantially below its historical average and suggests a more guarded outlook than the headline sentiment index.
However, the pace of homebuilding has improved only slowly
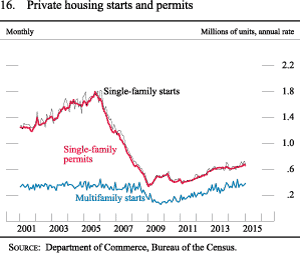
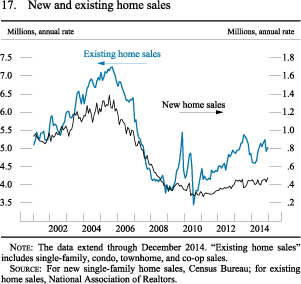
After advancing reasonably well in 2012 and early 2013, the recovery in residential construction activity has slowed markedly. Single-family housing starts only edged up in 2014, and multifamily construction activity was also little changed (figure 16). And sales of both new and existing homes were flat, on net, last year (figure 17). In all, real residential investment rose only 2-1/2 percent in 2014, and it remains well below its pre-recession peak. The weak recovery in construction likely relates to the rate of household formation, which, notwithstanding tentative signs of a recent pickup, has generally stayed very low despite the improvement in the labor market.
Lending policies for home purchases remained tight overall, although there are some indications that mortgage credit has started to become more widely accessible. Over the course of 2014, the fraction of home-purchase mortgages issued to borrowers with credit scores on the lower end of the spectrum edged up. Additionally, in the Senior Loan Officer Opinion Survey on Bank Lending Practices (SLOOS), several large banks reported having eased lending standards on prime home-purchase loans in the third and fourth quarters of last year.2 In January, the Federal Housing Administration reduced its mortgage insurance premiums by about one-third of the level that had prevailed during the past four years--a step that may lower the cost of credit for households with small down payments and low credit scores. Even so, mortgages have remained difficult to obtain for many households.
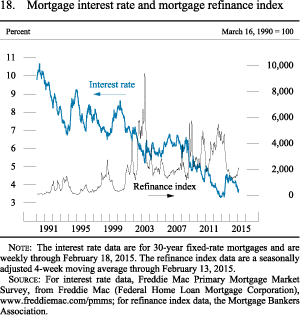
Meanwhile, for borrowers who can qualify for a mortgage, the cost of credit is low. After rising appreciably around mid-2013, mortgage interest rates have since retraced much of those increases. The 30-year fixed mortgage rate declined roughly 60 basis points in 2014, and it has edged down further, on net, this year to a level not far from its all-time low in 2012 (figure 18). Likely related to the most recent decline in mortgage rates, refinancing activity rose modestly in January.
Overall business investment has moved up, but investment in the energy sector is starting to be affected by the drop in oil prices
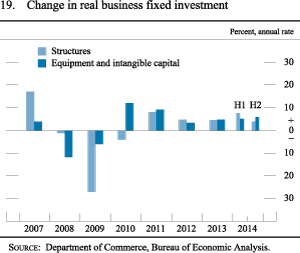
Business fixed investment rose at an annual rate of 5-1/4 percent in the second half of 2014, close to the rate of increase seen in the first half. Spending on E&I capital rose at an annual rate of about 6 percent, while spending on nonresidential structures moved up about 4 percent (figure 19). Business investment has been supported by strengthening final demand as well as by low interest rates and generally accommodative financial conditions. Regarding nonresidential structures, vacancy rates for existing properties have been declining, and financing conditions for new construction have eased further--both factors that bode well for future construction. More recently, however, the steep decline in the number of drilling rigs in operation suggests that a sharp falloff in the drilling and mining component of investment in nonresidential structures may be under way.
Corporate financing conditions were generally favorable
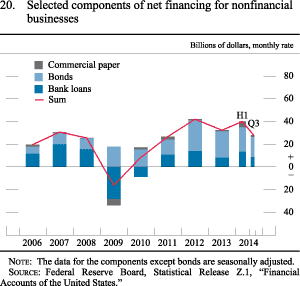
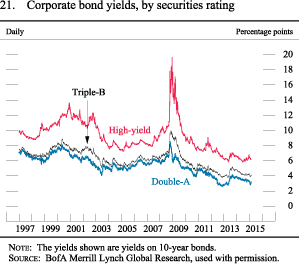
The financial condition of large nonfinancial firms generally remained solid in the second half of last year; profitability stayed high, and default rates on nonfinancial corporate bonds were generally very low. Nonfinancial firms have continued to raise funds through capital markets at a robust pace, given sturdy corporate credit quality, historically low interest rates on corporate bonds, and highly accommodative lending conditions for most firms (figures 20 and 21). Bond issuance by investment-grade nonfinancial firms, and syndicated lending to those firms, have both been particularly strong. However, speculative-grade issuance in those markets, which had remained elevated for most of 2014, diminished late in the year, because volatility increased and spreads widened and perhaps also because of greater scrutiny by regulators of syndicated leveraged loans with weaker credit quality and lower repayment capacity.
Credit also was readily available to most bank-dependent businesses. According to the October 2014 and January 2015 SLOOS reports, banks generally continued to ease price and nonprice terms on commercial and industrial (C&I) loans to firms of all sizes in the second half of 2014. That said, in the fourth quarter, several banks reported having tightened lending policies for oil and gas firms or, more broadly, in response to legislative, supervisory, or accounting changes. In addition, although overall C&I loans on banks' books registered substantial increases in the second half of 2014, loans to businesses in amounts of $1 million or less--a proxy for lending to small businesses--increased only modestly. The weak growth in these small loans appears largely due to sluggish demand; however, bank lending standards to small businesses are still reportedly somewhat tighter than the midpoint of their range over the past decade despite considerable loosening over the past few years.
Net exports held down second-half real GDP growth slightly
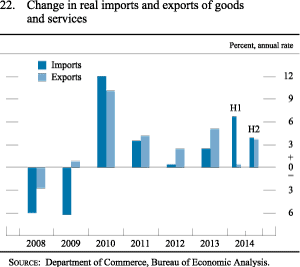
Exports increased at a modest pace in the second half of 2014, held back by lackluster growth abroad as well as the appreciation of the dollar. Import growth was also relatively subdued, despite the impetus from the stronger dollar, and was well below the pace observed in the first half (figure 22). All told, real net trade was a slight drag on real GDP growth in the second half of 2014.
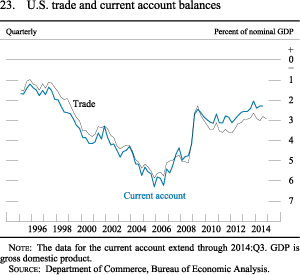
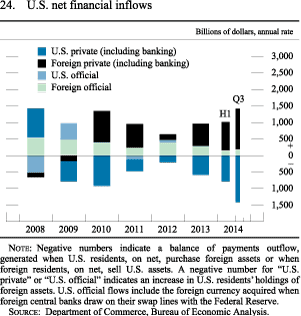
The current account deficit was little changed in the third quarter of 2014 and, at 2-1/4 percent of nominal GDP, was near its narrowest reading since the late 1990s (figure 23). The current account deficit in the first three quarters of 2014 was financed mainly by purchases of Treasury and corporate securities by foreign private investors (figure 24). In contrast, the pace of foreign official purchases in the first three quarters of the year was the slowest in more than a decade, reflecting a significant slowdown in reserve accumulation by emerging market economies (EMEs).
Federal fiscal policy was less of a drag on GDP...
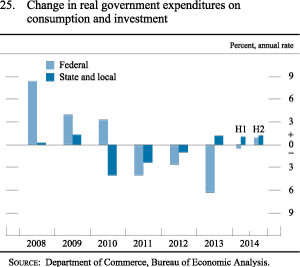
Fiscal policy at the federal level had been a factor restraining GDP growth for several years, especially in 2013. In 2014, however, the contractionary effects of tax and spending changes eased appreciably as the restraining effects of the 2013 tax increases abated and there was a slowing in the declines in federal purchases due to sequestration and the Budget Control Act of 2011 (figure 25). Moreover, some of the overall drag on demand was offset in 2014 by an increase in transfers resulting from the Affordable Care Act.
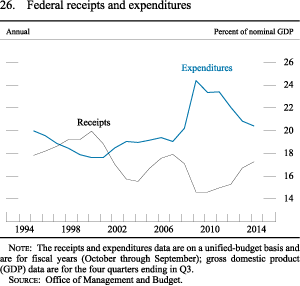
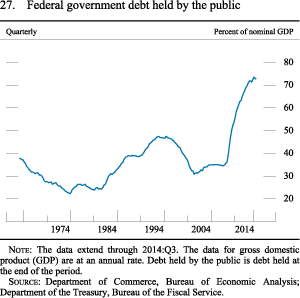
The federal unified deficit narrowed further last year, reflecting both the previous years' spending cuts and an increase in tax receipts resulting from the ongoing economic expansion (figure 26). The budget deficit was 2-3/4 percent of GDP for fiscal year 2014, and the Congressional Budget Office projects that it will be about 2-1/2 percent in 2015. As a result, overall federal debt held by the public stabilized as a share of GDP in 2014, albeit at a relatively high level (figure 27).
...and state and local government expenditures are also turning up
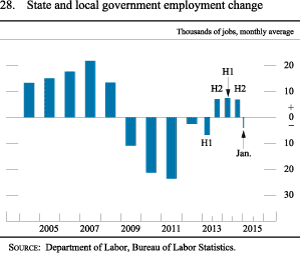
The expansion of economic activity has also led to continued slow improvements in the fiscal position of most state and local governments. Consistent with improving finances, states and localities expanded employment rolls in 2014 (figure 28). Furthermore, state and local expenditures on construction projects rose a touch last year following several years of declines.
Financial Developments
The expected path for the federal funds rate flattened
Market participants seemed to judge the incoming domestic economic data since the middle of last year, especially the employment reports, as supporting expectations for continued economic expansion in the United States; however, concerns about the foreign economic outlook weighed on investor sentiment. On balance, market-based measures of the expected (or mean) path of the federal funds rate through late 2017 have flattened, but the expected timing of the initial increase in the federal funds rate from its current target range was about unchanged. In addition, according to the results of the most recent Survey of Primary Dealers and the Survey of Market Participants, both conducted by the Federal Reserve Bank of New York just prior to the January FOMC meeting, respondents judged that the initial increase in the target federal funds rate was most likely to occur around mid-2015, little changed from the results of those surveys from last June.3 Meanwhile, in part because the passage of time brought the anticipated date of the initial increase in the federal funds rate closer, measures of policy rate uncertainty based on interest rate derivatives edged higher, on net, from their mid-2014 levels.
Longer-term Treasury yields and other sovereign benchmark yields declined
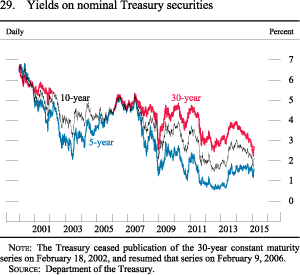
Yields on longer-term Treasury securities have continued to move down since the middle of last year on net (figure 29). In particular, the yields on 10- and 30-year nominal Treasury securities declined about 40 basis points and 60 basis points, respectively, from their levels at the end of June 2014. The decreases in longer-term yields were driven especially by reductions in longer-horizon forward rates. For example, the 5-year forward rate 5 years ahead dropped about 80 basis points over the same period. Long-term benchmark sovereign yields in advanced foreign economies (AFEs) have also moved down significantly in response to disappointing growth and very low and declining rates of inflation in a number of foreign countries as well as the associated actual and anticipated changes in monetary policy abroad.
The declines in longer-term Treasury yields and long-horizon forward rates seem to largely reflect reductions in term premiums--the extra return investors expect to obtain from holding longer-term securities as opposed to holding and rolling over a sequence of short-term securities for the same period. Market participants pointed to several factors that may help to explain the reduction in term premiums. First, very low and declining AFE yields and safe-haven flows associated with the deterioration in the foreign economic outlook likely have increased demand for Treasury securities. Second, the weaker foreign economic outlook coupled with the steep decline in oil prices may have led investors to put higher odds on scenarios in which U.S. inflation remains quite low for an extended period. Investors may see nominal long-term Treasury securities as an especially good hedge against such risks. Finally, market participants may have increased the probability they attach to outcomes in which U.S. economic growth is persistently subdued. Indeed, the 5-year forward real yield 5 years ahead, obtained from yields on Treasury Inflation-Protected Securities, has declined further, on net, since the middle of last year and stands well below levels commonly cited as estimates of the longer-run real short rate.
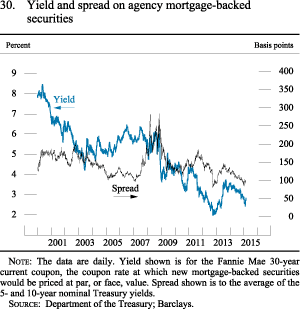
Consistent with moves in the yields on longer-term Treasury securities, yields on 30-year agency mortgage-backed securities (MBS)--an important determinant of mortgage interest rates--decreased about 30 basis points, on balance, over the second half of 2014 and early 2015 (figure 30).
Liquidity conditions in Treasury and agency MBS markets were generally stable...
On balance, indicators of Treasury market functioning remained stable over the second half of 2014 even as the Federal Reserve trimmed the pace of its asset purchases and ultimately brought the purchase program to a close at the end of October. The Treasury market experienced a sharp drop in yields and significantly elevated volatility on October 15, as technical factors reportedly amplified price movements following the release of the somewhat weaker-than-expected September U.S. retail sales data. However, market conditions recovered quickly and liquidity measures, such as bid-asked spreads, have been generally stable since then. Moreover, Treasury auctions generally continued to be well received by investors.
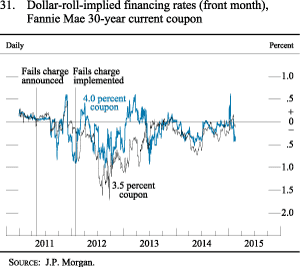
As in the Treasury market, liquidity conditions in the agency MBS market were generally stable, with the exception of mid-October. Dollar-roll-implied financing rates for production coupon MBS--an indicator of the scarcity of agency MBS for settlement-- suggested limited settlement pressures in these markets over the second half of 2014 and early 2015 (figure 31).
...and short-term funding markets also continued to function well as rates moved slightly higher overall
Conditions in short-term dollar funding markets also remained stable during the second half of 2014 and early 2015. Both unsecured and secured money market rates moved modestly higher late in 2014 but remained close to their averages since the federal funds rate reached its effective lower bound. Unsecured offshore dollar funding markets generally did not exhibit signs of stress, and the repurchase agreement, or repo, market functioned smoothly with modest year-end pressures.
Money market participants continued to focus on the ongoing testing of the Federal Reserve's monetary policy tools. The offering rate in the overnight reverse repurchase agreement (ON RRP) exercise has continued to provide a soft floor for other rates on secured borrowing, and the term RRP testing operations that were conducted in December and matured in early January seemed to help alleviate year-end pressures in money markets. For a detailed discussion of the testing of monetary policy tools, see the box "Additional Testing of Monetary Policy Tools" in Part 2.
Broad equity price indexes rose despite higher volatility, while risk spreads on corporate debt widened
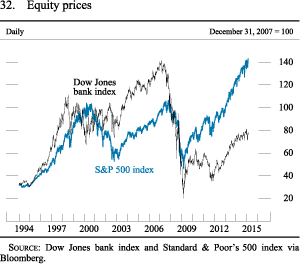
Over the second half of 2014 and early 2015, broad measures of U.S. equity prices increased further, on balance, but stock prices for the energy sector declined substantially, reflecting the sharp drops in oil prices (figure 32). Although increased concerns about the foreign economic outlook seemed to weigh on risk sentiment, the generally positive tone of U.S. economic data releases as well as declining longer-term interest rates appeared to provide support for equity prices. Overall equity valuations by some conventional measures are somewhat higher than their historical average levels, and valuation metrics in some sectors continue to appear stretched relative to historical norms. Implied volatility for the S&P 500 index, as calculated from options prices, increased moderately, on net, from low levels over the summer.
Corporate credit spreads, particularly those for speculative-grade bonds, widened from the fairly low levels of last summer, in part because of the underperformance of energy firms. Overall, corporate bond spreads across the credit spectrum have been near their historical median levels recently. For further discussion of asset prices and other financial stability issues, see the box "Developments Related to Financial Stability."
Developments Related to Financial Stability
The financial vulnerabilities in the U.S. financial system overall have remained moderate since the previous Monetary Policy Report. In the past few years, capital and liquidity positions in the banking sector have continued to improve, net wholesale short-term funding in the financial sector has decreased substantially, and aggregate leverage of the private nonfinancial sector has not picked up. However, valuation pressures are notable in some asset markets, although they have eased a little on balance. Leverage at lower-rated nonfinancial firms has become more pronounced. Recent developments in Greece have rekindled concerns about the country defaulting and exiting the euro system.
With regard to asset valuations, price-to-earnings and price-to-sales ratios are somewhat elevated, suggesting some valuation pressures. However, estimates of the equity premium remain relatively wide, as the long-run expected return on equity exceeds the low real Treasury yield by a notable margin, suggesting that investors still expect somewhat higher-than-average compensation relative to historical standards for bearing the additional risk associated with holding equities. Risk spreads for corporate bonds have widened over recent months, especially for speculative-grade firms, in part because of concerns about the credit quality of energy-related firms, though yields remain near historical lows, reflecting low term premiums. Residential real estate valuations appear within historical norms, with recent data pointing to some cooling of house price gains in regions that recently experienced rapid price appreciation. However, valuation pressures in the commercial real estate market may have increased in recent quarters as prices have risen relative to rents, and underwriting standards in securitizations have weakened somewhat, though debt growth remains moderate.
The private nonfinancial sector credit-to-GDP ratio has declined to roughly its level in the mid-2000s. At lower-rated and unrated nonfinancial businesses, however, leverage has continued to increase with the rapid growth in high-yield bond issuance and leveraged loans in recent years. The underwriting quality of leveraged loans arranged or held by banking institutions in 2014:Q4 appears to have improved slightly, perhaps in response to the stepped-up enforcement of the leveraged lending guidance. However, new deals continue to show signs of weak underwriting terms and heightened leverage that are close to levels preceding the financial crisis.
As a result of steady improvements in capital and liquidity positions since the financial crisis, U.S. banking firms, in aggregate, appear to be better positioned to absorb potential shocks--such as those related to litigation, falling oil prices, and financial contagion originating abroad--and to meet strengthening credit demand. The sharp decline in oil prices, if sustained, may lead to credit strains for some banks with concentrated exposures to the energy sector, but at banks that are more diversified, potential losses are likely to be offset by the positive effects of lower oil prices on the broader economy. Thirty-one large bank holding companies (BHCs) are currently undergoing their annual stress tests, the results of which are scheduled to be released in March.
Leverage in the nonbank financial sector appears, on balance, to be at moderate levels. New securitizations, which contribute to financial sector leverage, have been boosted by issuance of commercial mortgage-backed securities (CMBS) and collateralized loan obligations (CLOs), which remained robust amid continued reports of relatively accommodative underwriting standards for the underlying assets. That said, the risk retention rules finalized in October, which require issuers to retain at least 5 percent of any securitizations issued, have the potential to affect market activity, especially in the private-label residential mortgage-backed securities, non-agency CMBS, and CLO sectors.
Reliance on wholesale short-term funding by nonbank financial institutions has declined significantly in recent years and is low by historical standards. However, prime money market funds with a fixed net asset value remain vulnerable to investor runs if there is a fall in the market value of their assets. Furthermore, the growth of bond mutual funds and exchange-traded funds (ETFs) in recent years means that these funds now hold a much higher fraction of the available stock of relatively less liquid assets--such as high-yield corporate debt, bank loans, and international debt--than they did before the financial crisis. As mutual funds and ETFs may appear to offer greater liquidity than the markets in which they transact, their growth heightens the potential for a forced sale in the underlying markets if some event were to trigger large volumes of redemptions.
Since the previous Monetary Policy Report, the Federal Reserve has taken further steps to improve the resiliency of the financial system. First, the Federal Reserve Board and other federal banking agencies finalized several rules to enhance the capital and liquidity positions of large banking organizations. In particular, a final rule on a liquidity coverage ratio was issued, requiring large and internationally active banking organizations to hold a certain minimum amount of high-quality liquid assets, such as central bank reserves and government and corporate debt that can be converted easily and quickly into cash. Another final rule was adopted to modify the definition of the supplementary leverage ratio in a manner consistent with the recent changes agreed to by the Basel Committee on Banking Supervision. The technical modifications adjust the amount of certain off-balance-sheet items included in the ratio, such as credit derivatives, repurchase agreement-style transactions, and lines of credit. The changes strengthen the ratio by more appropriately capturing a banking organization's on- and off-balance-sheet exposures and, based on estimates, would increase capital requirements, on balance, across banking firms.
In addition, the Federal Reserve issued several rules to conform to Dodd-Frank Act mandates. A final rule was issued to implement section 622 of the act, which generally prohibits a financial company (defined generally as an insured depository institution or depository institution holding company) from combining with another company if the resulting company's liabilities would exceed 10 percent of the aggregate consolidated liabilities of all such financial companies. Another final rule, issued jointly by several federal agencies, requires the sponsors of asset-backed securities (ABS) to retain not less than 5 percent of the credit risk of the assets collateralizing the ABS issuance unless certain underwriting criteria on the securitized assets are met. The rule also generally prohibits the sponsor from transferring or hedging that credit risk. Moreover, several federal agencies jointly issued a proposed rule establishing minimum margin requirements for certain swap contracts that are not cleared through central counterparties.
In addition, the Federal Reserve proposed a rule to further strengthen the capital positions of the most systemically important U.S. bank holding companies (BHCs). The proposal establishes a methodology to identify whether a U.S. BHC is a global systemically important banking organization (GSIB) and so would be subject to a risk-based capital surcharge calibrated based on its systemic profile. A GSIB would be required to calculate its capital surcharge under two methods and would be subject to the higher of the two surcharges. The first method is consistent with the Basel framework, which results in capital surcharges ranging from 1.0 to 2.5 percent. The second method, which takes into account a measure of the firm's' reliance on short-term wholesale funding, results in capital surcharges ranging from 1.0 to 4.5 percent. Failure to maintain the capital surcharge would subject the GSIB to restrictions on capital distributions and discretionary bonus payments.
Finally, the Federal Reserve invited public comment on enhanced prudential standards for the regulation and supervision of General Electric Capital Corporation (GECC), a nonbank financial company that the Financial Stability Oversight Council has designated for supervision by the Federal Reserve Board. In light of the substantial similarity of GECC's activities and risk profile to those of a similarly sized BHC, the Federal Reserve is proposing to apply enhanced prudential standards to GECC similar to those applied to large BHCs.
Return to textBank credit and the M2 measure of the money stock continued to expand
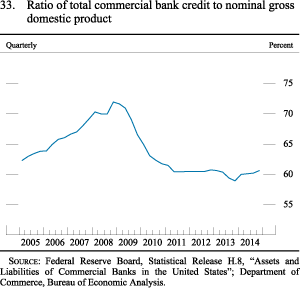
Aggregate credit provided by commercial banks increased at a solid pace in the second half of 2014 (figure 33). The expansion in bank credit was mainly driven by moderate loan growth coupled with continued robust expansion of banks' holdings of U.S. Treasury securities, which was reportedly influenced by efforts of large banks to meet the new Basel III Liquidity Coverage Ratio requirements. The growth of loans on banks' books was generally consistent with the SLOOS reports of increased loan demand and further easing of lending standards for many loan categories over the second half of 2014. Meanwhile, delinquency and charge-off rates fell across most major loan types.
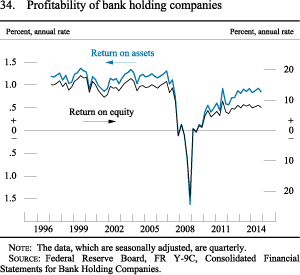
Measures of bank profitability were little changed in the second half of 2014, on net, and remained below their historical averages (figure 34). Equity prices of large domestic bank holding companies (BHCs) have increased moderately, on net, since the middle of last year (figure 32). Credit default swap (CDS) spreads for large BHCs were about unchanged.
The M2 measure of the money stock has increased at an average annualized rate of about 5-1/2 percent since last June, below the pace registered in the first half of 2014 and about in line with the pace of nominal GDP. The deceleration was driven by a moderation in the growth rate of liquid deposits in the banking sector relative to the first half of 2014. Although demand for currency weakened in the third quarter of 2014 relative to the first half of the year, currency growth has been strong since November.
Municipal bond markets functioned smoothly, but some issuers remained strained
Credit conditions in municipal bond markets have generally remained stable since the middle of last year. Over that period, the MCDX--an index of CDS spreads for a broad portfolio of municipal bonds--and ratios of yields on 20-year general obligation municipal bonds to those on longer-term Treasury securities increased slightly.
Nevertheless, significant financial strains were still evident for some issuers. Puerto Rico, with speculative-grade-rated general obligation bonds, continued to face challenges from subdued economic performance, severe indebtedness, and other fiscal pressures. Meanwhile, the City of Detroit emerged from bankruptcy late in 2014 after its debt restructuring plan was approved by a federal judge.
International Developments
Bond yields in the advanced foreign economies continued to decline...
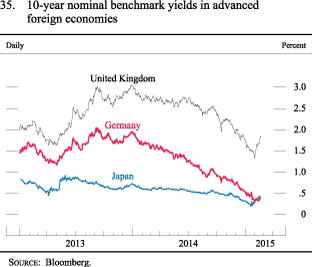
As noted previously, long-term sovereign yields in the AFEs moved down further during the second half of 2014 and into early 2015 on continued low inflation readings abroad and heightened concerns over the strength of foreign economic growth as well as amid substantial monetary policy accommodation (figure 35). German yields fell to record lows, as the European Central Bank (ECB) implemented new liquidity facilities, purchased covered bonds and asset-backed securities, and announced it would begin buying euro-area sovereign bonds. Specifically, the ECB said that it would purchase €60 billion per month of euro-area public and private bonds through at least September 2016. Japanese yields also declined, reflecting the expansion by the Bank of Japan (BOJ) of its asset purchase program. In the United Kingdom, yields fell as data showed declining inflation and some moderation in economic growth, although they have retraced a little of that move in recent weeks, in part as market sentiment toward the U.K. outlook appears to have improved somewhat. In emerging markets, yields were mixed--falling, for the most part, in Asia and generally rising modestly in Latin America--as CDS spreads widened amid growing credit concerns, particularly in some oil-exporting countries.
...while the dollar has strengthened markedly
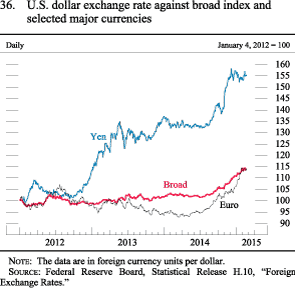
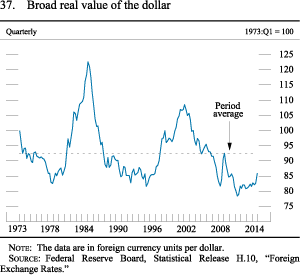
The broad nominal value of the dollar has increased markedly since the middle of 2014, with the U.S. dollar appreciating against almost all currencies (figure 36). The increase in the value of the dollar was largely driven by additional monetary easing abroad and rising concerns about foreign growth--forces similar to those that drove benchmark yields lower--in the face of expectations of solid U.S. growth and the anticipated start of monetary tightening in the United States later this year. Both the euro and the yen have depreciated about 20 percent against the dollar since mid-2014. Notwithstanding the sharp nominal appreciation of the dollar since mid-2014, the real value of the dollar, measured against a broad basket of currencies, is currently somewhat below its historical average since 1973 and well below the peak it reached in early 1985 (figure 37).
Economic growth in the advanced foreign economies, while still generally weak, firmed toward the end of the year
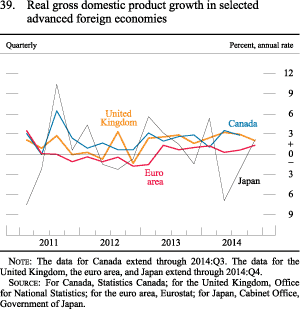
Economic growth in the AFEs, which was weak in the first half of 2014, firmed toward the end of the second half of the year, supported in part by lower oil prices and more accommodative monetary policies (figure 39). The euro-area economy barely grew in the third quarter and unemployment remained near record highs, but the pace of economic activity moved up in the fourth quarter. Notwithstanding more supportive monetary policy and the recent pickup in euro-area growth, negotiations over additional financial assistance for Greece have the potential to trigger adverse market reactions and resurrect financial stresses that might impair growth in the broader euro-area economy. Japanese real GDP contracted again in the third quarter, following a tax hike-induced plunge in the second quarter, but it rebounded toward the end of the year as exports and household spending increased. In contrast, economic activity in the United Kingdom and Canada was robust in the third quarter but moderated in the fourth quarter.
The fall in oil prices and other commodity prices pushed down headline inflation across the major AFEs. Most notably, 12-month euro-area inflation continued to trend down, falling to negative 0.6 percent in January. Declines in inflation and in market-based measures of inflation expectations since mid-2014 prompted the ECB to increase its monetary stimulus. Similar considerations led the BOJ to step up its pace of asset purchases in October. The Bank of Canada lowered its target for the overnight rate in January in light of the depressing effect of lower oil prices on Canadian inflation and economic activity, as oil exports are nearly 20 percent of total goods exports. Several other foreign central banks lowered their policy rates, either reaching or pushing further into negative territory, including in Denmark, Sweden, and Switzerland--the last of which did so in the context of removing its floor on the euro-Swiss franc exchange rate.
Growth in the emerging market economies improved but remained subdued
Following weak growth earlier last year, overall economic activity in the EMEs improved a bit in the second half of 2014, but performance varied across economies. Growth in Asia was generally solid, supported by external demand, particularly from the United States, and improved terms of trade due to the sharp decline in commodity prices. In contrast, the decline in commodity prices, along with macroeconomic policy challenges, weighed on economic activity in several South American countries.
In China, exports expanded rapidly in the second half of last year, but fixed investment softened, as real estate investment slowed amid a weakening property market. Responding to increased concerns over the strength of growth, the authorities announced additional targeted stimulus measures in an effort to prevent the economy from slowing abruptly. In much of the rest of emerging Asia, exports, particularly to the United States, supported a step-up in growth from the first half of the year. The Mexican economy continued to grow at a moderate pace in the second half of 2014, with solid exports to the United States but lingering softness in household demand. In Brazil, economic activity remained lackluster amid falling commodity prices, diminished business confidence, and tighter macroeconomic policy. Declining oil prices were especially disruptive for several economies with heavy dependence on oil exports, including Russia and Venezuela.
Inflation continued to be subdued in most EMEs. The fall in the price of oil contributed to a moderation of headline inflation in several EMEs, including China. However, this contribution was limited in many EMEs due to the prevalence of administered energy prices, which lower the pass-through of changes in oil prices to consumer prices. In several countries, including Indonesia and Malaysia, the fall in energy prices prompted governments to cut fuel subsidies, leading to a rise in domestic prices of fuel and in inflation late in 2014. With inflation low or declining, some central banks, including those of China, Korea, and Chile, loosened monetary policy to support growth. In other EMEs, including Brazil and Malaysia, inflationary pressures stemming from depreciating currencies or from reductions in fuel subsidies prompted central banks to raise policy rates. The central bank of Russia sharply tightened monetary policy to combat inflationary pressures and stabilize its financial markets, which came under considerable pressure in late 2014.
Footnotes
1. For details on the construction of the labor market conditions index, see Hess Chung, Bruce Fallick, Christopher Nekarda, and David Ratner (2014), "Assessing the Change in Labor Market Conditions," Finance and Economics Discussion Series 2014-109 (Washington: Board of Governors of the Federal Reserve System, December), www.federalreserve.gov/econresdata/feds/2014/files/2014109pap.pdf. Return to text
2. The SLOOS is available on the Board's website at www.federalreserve.gov/boarddocs/snloansurvey. Return to text
3. The results of the Survey of Primary Dealers and of the Survey of Market Participants are available on the Federal Reserve Bank of New York's website at www.newyorkfed.org/markets/primarydealer_survey_questions.html ![]() , respectively. Return to text
, respectively. Return to text

