December 03, 2018
The Structure of the Treasury Market: What Are We Learning?
Governor Lael Brainard
At "The Evolving Structure of the U.S. Treasury Market" Fourth Annual Conference Hosted by the Federal Reserve Bank of New York, New York, New York
I am pleased to join the fourth annual conference on the evolving structure of the U.S. Treasury market. Four years ago, the Treasury "flash rally" served as a wake-up call for regulators and market participants alike that the structure of the Treasury market had changed radically from the conventional view. Since the surprising sharp spike in Treasury prices on October 15, 2014, the public sector has devoted significant effort and resources to monitoring the ongoing changes in the Treasury market. The interagency working group's (IAWG) Joint Staff Report on the events of October 15, the Treasury Department's request for information on the report's recommendations, and the subsequent collection of transactions data by the Financial Industry Regulatory Authority (FINRA) through its Trade Reporting and Compliance Engine (TRACE) system have offered us a much better understanding of this market.1
But the market is not resting, and neither can we. Even in the past year, much has changed in the Treasury market, and technology is continuing to drive rapid transformation in the competitive landscape. I would like to talk about the changes we are seeing, what we are learning from the TRACE data, and emerging developments that are important to monitor. In particular, I want to highlight an initiative that the Federal Reserve is considering to expand the public sector's access to transactions data in order to help ensure the IAWG is able to keep up with the market.
Still Changing
At the first Treasury conference in 2015, market participants were still processing the results of the Joint Staff Report.2 It came as a surprise to many that the high-frequency trading activity conducted by "proprietary trading firms," or PTFs, accounted for a majority of trading in the interdealer platforms that are so central to the Treasury market. Indeed, the names of the largest proprietary trading firms were new even to some seasoned professionals. At that time, the discussion often drew a very bright line between traditional dealers and proprietary trading firms and, in particular, the trading activities associated with each.
The distinction between broker-dealers and proprietary trading firms remains important today with regard to why they are trading, but less and less with regard to how they are trading. Now, as then, broker-dealers intermediate financial transactions primarily to serve their clients' needs, and, for this reason, they are required to register with FINRA. Conversely, the hallmark of proprietary trading firm activity was and still is high-frequency proprietary trading. Proprietary trading firms trade for their own account rather than that of a client, which places them outside of FINRA's jurisdiction and many other forms of oversight. This distinction remains important today.
But the distinction in how broker-dealers and proprietary trading firms trade was already starting to blur by the time of the first conference. For example, some of the larger dealers had already invested heavily in electronic trading systems by 2015. Since that time, the distinctions have blurred considerably further. Almost all midsize and large dealers now possess autoquoting capabilities and deploy them on Treasury trading platforms. Several primary dealers have even entered direct partnerships with proprietary trading firms, effectively outsourcing some parts of their market-making operations.
The evolution of the dealer business model to incorporate advanced technology is not limited only to trading activity. A number of developers of emerging financial technologies, or fintech, have arisen in recent years to provide dealers and other market participants with back-office tools that reduce costs by automating routine processes, streamlining regulatory reporting, and more efficiently allocating capital, collateral, and margin among competing uses. On the front end, dealers are increasingly offering their customers web-based research and analytic tools, trading and execution engines, and even apps that allow clients access to internal software for pricing and structuring transactions.
The landscape for proprietary trading firms has changed considerably in recent years, too. Since 2015, we have witnessed the first initial public offering by a proprietary trading firm, as well as a few high-profile mergers and acquisitions.3 The industry is contending with declining revenue growth and diminished returns by expanding operations into new asset classes and geographies. Proprietary trading firms are also adapting in other ways. Some have begun to offer broker-dealer services themselves or appear to be contemplating such a business model change. Still others have entered joint ventures with one another to finance new investment in faster microwave communications and defray the high costs of that infrastructure.4 Third-party providers are also offering high-speed links to firms that wish to engage in high-frequency trading without investing directly in microwave tower infrastructure.
We have seen important recent changes among infrastructure providers as well. CME Group's acquisition of NEX and the BrokerTec platform has recently been finalized, with direct implications for the structure of the Treasury market.5 We have also witnessed the conclusion of J.P. Morgan's exit from broker-dealer settlement services in the triparty Treasury repo market and the transition to BNY Mellon Government Securities Services Corp. as a subsidiary offering Treasury market settlement services. Beyond these changes, some new trading platforms are experimenting with the very structure of the market.6 These platforms are promoting new trading models such as all-to-all trading, in which many buy-side and sell-side participants transact directly, and direct streaming, in which live continuous, executable prices are delivered electronically under bilaterally or multilaterally negotiated terms. These services can potentially bridge all of the venues of the Treasury market, connecting not just dealers and proprietary trading firms, but also those entities with buy-side clients.
And, finally, the macroeconomic landscape has undergone some significant changes that have important implications for the Treasury market. At the time of the flash rally in October 2014, the Federal Reserve was still actively purchasing Treasury securities, and the federal funds rate was still at the effective lower bound. With the economy now at or beyond full employment and inflation around target, the Federal Open Market Committee has since gradually increased its target for the federal funds rate to between 2 and 2-1/4 percent, and normalization of the balance sheet is well under way. Since October 2017, the portfolio of the System Open Market Account has decreased in size from $4.2 trillion to about $3.9 trillion.
What Have We Learned So Far?
Against this changed backdrop and with more than a year's worth of information from the TRACE data available, it is a good time to ask what we have learned since the initial market event and what questions remain. First, the initiation of policy normalization and the ongoing reduction of the Federal Reserve's balance sheet do not appear to have sparked a deterioration in Treasury market liquidity. Standard metrics such as bid-ask spreads have not materially changed for benchmark securities since 2014. Market functioning has also been orderly during a number of recent events that were characterized by high trading volume and elevated price volatility, such as in early February of this year.
Second, some segments of the market seem much more active than observers may have feared before the collection of TRACE data. In particular, according to the TRACE data as shown in figure 1, off-the-run trading accounts for 27 percent of overall trading volume, while deep off-the-run notes and bonds--seasoned securities older than the first or second off-the-run--account for 14 percent of all coupon activity.7 Likewise, the data show that Treasury Inflation-Protected Securities (TIPS) trade in significant volumes as well.
Due to the TRACE data, we are now able to measure with reasonable precision the transaction volumes in these securities. Off-the-run and TIPS activity is largely concentrated in the dealer-to-client (DTC) and voice venues of the market, segments into which the public sector had only limited insight before the TRACE data. While substantial analysis with respect to pricing and liquidity remains to be done in these market segments, the early results allow us to conclude that these securities do trade in meaningful amounts.
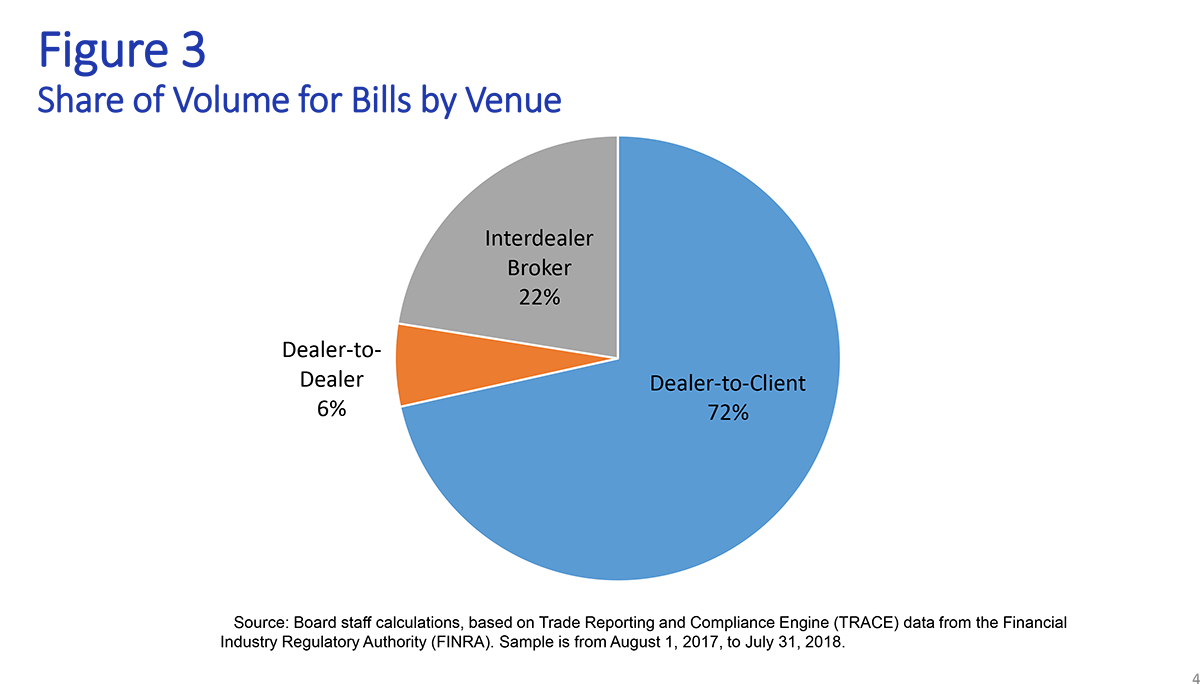
Third, although there was speculation that proprietary trading firms had already eclipsed bank dealers in benchmark Treasury trading or would come to threaten the dealer business model more broadly, neither has occurred.8 Based on the TRACE data, as shown in figure 2, we can now state with a reasonable amount of confidence that dealers generally--and primary dealers particularly--still intermediate the majority of activity in all Treasury securities.9 In the market for Treasury bills in particular, primary dealers play an important role in allocating issuance to investors. This can be seen where most activity in bills occurs, as shown in figure 3, which depicts the share of trading volume of bills in the DTC, interdealer broker (IDB), and interdealer segments of the market. Federal Reserve staff analysis of the TRACE data reveals that nearly three-fourths of total trading volume of bills is in the DTC market, where dealers are, of course, the main intermediary. From this and other analysis, there is substantial evidence that the dealer business model plays a central role in this market and will continue to do so into the future.10
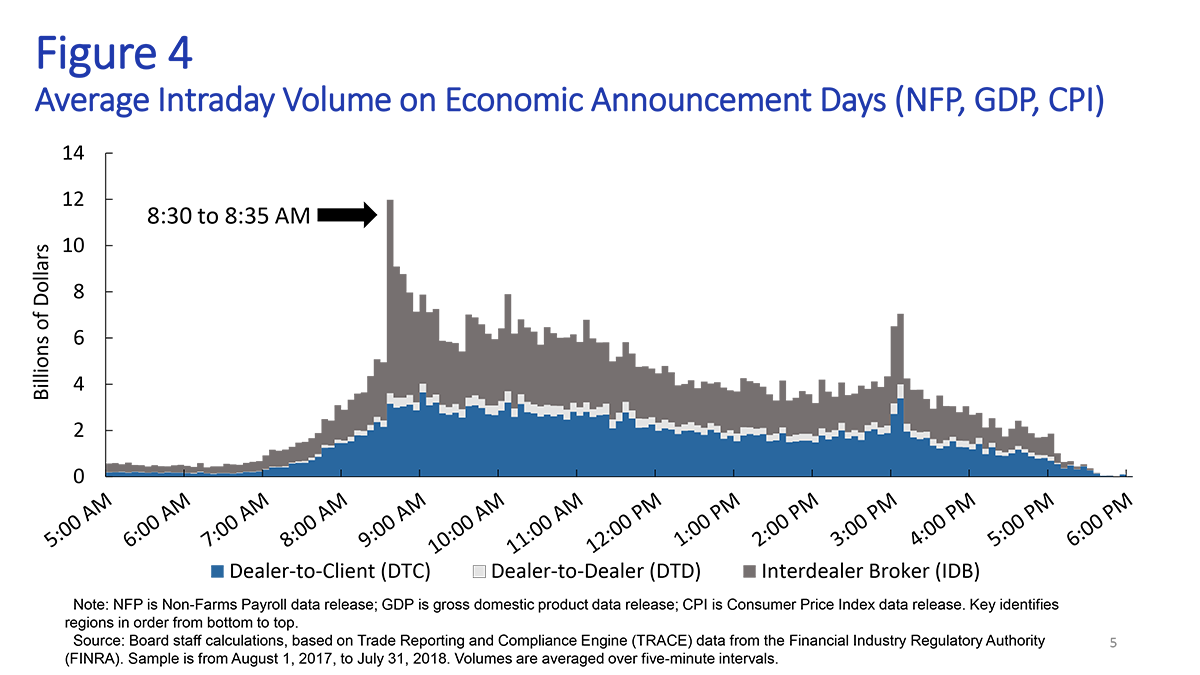
That said, proprietary trading firms do occupy an important space in the Treasury market alongside dealers, and it is clear that they, too, are here to stay. When it comes to areas where speed is paramount--for instance, in trading across and between asset classes and trading venues‑‑proprietary trading firms are deploying technology and infrastructure in ways that are having lasting effects. This is evident in the Treasury market in the intervals following economic data releases. Again turning to the TRACE data, we see in figure 4 a depiction of average trading volumes of all Treasury securities across five-minute intervals on days in which the Employment Situation report, gross domestic product data, or consumer price index data are announced. The TRACE volume data indicate that the immediate surge in trading activity following these announcements occurs mainly in the electronic IDB venue, where proprietary trading firms dominate.
In short, the TRACE data are enabling us to put some old puzzles to rest. Our analysis makes clear that the Treasury market has adapted well to the post-crisis regulatory regime, the normalization of monetary policy, and technological changes in trading processes, and that both broker-dealers and proprietary trading firms play important, often complementary, roles in the market structure that has emerged.
Looking Ahead
Of course, the structure of the Treasury market will continue to evolve, along with changes in technology and the broader financial environment. Looking forward, we will need to ask more of the data as we seek to understand what is next for the structure of the Treasury market. As I mentioned earlier, experimentation with new protocols is occurring now. Although all-to-all trading in the Treasury market was contemplated at the first conference, direct streaming largely was not, which might prompt us to ask what else is on the horizon.
In addition to direct streaming, another development that bears watching is the batch auction platforms that have arisen in the voice IDB market, something that has not received as much attention from market participants. Started after the financial crisis, batch auctions are now conducted by a number of IDB firms at regular intervals throughout the trading day. Like any closed auction, the IDB collects anonymous bids and offers for a specific security in specific amounts during a relatively short window of time, generally on the order of a few minutes. After the batch auction closes, the orders are matched, and participants are notified of their awards.11 Figure 5, based on TRACE data, depicts average trading volumes of TIPS securities in the IDB venue of the market across five-minute intervals. As you can see, the level of activity rises significantly at intervals, which correspond to the timing of the auctions. While it is not a large part of the overall market, this activity appears to be an important innovation for segments often deemed to be less liquid--in particular, for off-the-run and TIPS trading on voice IDBs. Before the collection of the TRACE data, there was limited insight into this area of the market, which made it difficult to assess the significance of such innovations.
No doubt there are other innovations that have yet to be assessed. Recently, the debate over liquidity has turned toward the participation of proprietary trading firms in the off-the-run segment of the market, an area outside of their traditional domain. All-to-all and direct-streaming platforms are also attempting to establish a foothold in the off-the-run segment by offering new services. I look forward to further analysis as the structure of the market continues to evolve.
Keeping Up
As the Treasury market has evolved, the public sector has had to evolve as well in order to keep up. Many of the recommendations in the Joint Staff Report have now been implemented. Our colleagues at Treasury, the Securities and Exchange Commission, and FINRA deserve credit for the work to begin collecting Treasury transaction data on FINRA's TRACE system. My hope is that you will take away from my remarks, along with those of my colleagues from other agencies, a comprehensive picture of how all of the IAWG agencies are using the data to work through the many issues that intersect with our various policy missions and mandates.
As the market continues to innovate and the broader financial environment continues to shift, we will maintain our focus on the resilience of the Treasury market specifically and the financial system more broadly.12 In this regard, the staff at the Federal Reserve continues to work on important issues raised by the events of October 15, 2014. Markets have been able to weather several episodes of short-lived market turbulence well in the past few years. But the fact that sharp market movements--some on the order of seven or eight standard deviations outside the norm--can occur even in the absence of clear news drivers remains a concern and highlights the potential risks to financial stability posed by the high-speed transmission of price and liquidity shocks across multiple markets and trading venues.
The TRACE data now allow us to monitor events when equity and bond markets move sharply. For instance, take the turbulence in equity and bond markets on February 5, 2018. While trading volumes in both the electronic IDB and DTC market segments were markedly higher than average, some metrics of liquidity, such as market depth near the top of the order book on major electronic IDB platforms, deteriorated and remained low through the week. The pattern of a spike in trading volumes followed by a persistent decline in market depth has been characteristic of three recent market turmoil episodes: (1) the Treasury flash rally on October 15, 2014; (2) the flash crash in the British pound on October 7, 2016; and (3) the spike in the VIX on February 5, 2018.13 Figure 6 shows this pattern for February 5, 2018. These seemingly contradictory dynamics are easier to reconcile if the prevalent role played by high-speed electronic trading in the Treasury market is taken into account, particularly under stressed conditions. As previously noted in the Joint Staff Report, high-speed market makers are able to manage perceived risks from sudden adverse price moves by greatly reducing the sizes of orders placed on electronic execution venues while, at the same time, increasing order placement rates as much as needed to accommodate increased trading volumes without the need to widen bid-ask spreads.
That said, the ability of high-speed market makers to nearly simultaneously adjust liquidity provision across multiple closely linked markets can create potential challenges for large institutional investors seeking to reliably aggregate posted liquidity among otherwise distinct trading venues.14 The dynamic nature of liquidity provision by high-speed market makers makes static measures of liquidity, such as posted bid-ask spreads and market depth, less useful. For the purposes of improving our assessment of financial stability, it is therefore necessary to look for alternative ways of gauging liquidity and transaction costs in these markets. For example, measures such as implementation shortfall aim to account directly for the difference between the original decision price and the final execution price for a trade split into multiple smaller transactions.15 As IAWG staff members continue to refine the TRACE data to assess market resilience more accurately in light of changes in structure and speed, it will be important to incorporate alternative measures of liquidity and transaction costs.
Separately, the increased role of managed funds is also having an effect on the Treasury market. TRACE data can help us keep up with that development as well. As in other asset classes, 3 p.m. has become an important liquidity point during the trading day for Treasury securities. There is a regular spike in trading activity around 3 p.m., as can be seen in figure 7, which depicts average trading volumes across five-minute intervals. Federal Reserve staff analysis reveals that the 3 p.m. spike in trading volumes tends to be fairly evenly divided between the DTC and IDB market segments, suggesting that both dealers and proprietary trading firms play an important role during this narrow window of activity. In the DTC market, the increase around 3 p.m. would be consistent with trading related to mutual fund daily and end-of-month portfolio rebalancing. In the electronic IDB market, the increase around 3 p.m. would be consistent with the increased role of proprietary trading firms in intraday intermediation and the possible closeout of positions toward the end of the main part of the trading day. From a market resilience perspective, it would be valuable to analyze these systematic intraday spikes in trading volumes, particularly as they may influence price formation and liquidity provision in the Treasury market.
The large spike in flows toward the end of the trading day points to a financial stability consideration that is worth flagging. The Treasury Market Practices Group (TMPG) has done valuable work in mapping out clearing and settlement patterns in the Treasury market. One issue that this analysis highlights is the currently limited potential for same day, or T+0, settlement on transactions conducted near the end of the day. The flash events we have seen in the Treasury market so far have occurred early enough in the day to allow time for prices to recover before market close, and they have not been accompanied by any participant's failure to perform, let alone a major participant, platform, or exchange.
As the TMPG's work shows, most transactions in the Treasury market settle the next day, or T+1. As can be seen in figure 8, Federal Reserve staff analysis based on the transactions recorded in TRACE shows that same-day settlement volumes, on average, represent only about 4 percent of total daily volume, with the rest concentrated primarily on one-day settlement. Same-day settlement volumes since the inception of TRACE have never exceeded roughly 10 percent of the daily total. Fortunately, we have not recently observed a large liquidation of Treasury holdings for cash at the end of the same day. But we cannot rule out that this will always be the case. It is not clear from the TRACE data whether the market could accommodate a large sale of Treasury securities later in the day, perhaps associated with a need to raise cash quickly to settle outstanding positions, without causing a substantial move in prices. It will be important to follow closely how the market evolves in light of the potential risks and resilience issues identified in the recent TMPG white paper on clearing and settlement in the secondary market for U.S. Treasury securities.16
Before I conclude, let me discuss one other step the Board is planning to take to help us keep up with the changing nature of markets. The TRACE data are indispensable in the IAWG's ability to track and understand this market. However, FINRA's collections are limited only to its members. The Federal Reserve is close to finalizing an agreement with FINRA to act as our agent in expanding the collection of Treasury transactions to key banks that are also active in this market. In addition, in light of recent changes in the market, the Board has decided to issue a notice of proposed rulemaking to seek public comment on collecting agency mortgage-backed securities (MBS) and debt transactions as well. This collection will help round out the IAWG's view of these markets and ensure continuous coverage in circumstances where trading moves between the bank and the broker-dealer within a firm. It is important that reporting thresholds be appropriately tailored to avoid imposing undue burden on smaller firms, and we will be particularly attentive to public comments on this matter.
I see important potential benefits of transparency under appropriate circumstances. The Treasury Department is currently considering these issues, and we would seek to harmonize our approach with any future decisions by the Treasury Department and the IAWG in making Treasury transactions data available to the public. Our expectation is also that Federal Reserve policy would be harmonized with FINRA's practices in making anonymized agency MBS and debt transactions publicly available, taking into account what we learn from the comment process.
Conclusion
In sum, we recognize it is vitally important for the Federal Reserve and other agencies to keep up with the rapid changes we are seeing in the Treasury market. The Treasury market is a cornerstone of the global financial system: Treasury securities are used to finance the federal government, represent a store of value for investors and households alike, and serve as the primary reserve asset for the global financial system. The Treasury market is also vital to the Federal Reserve: It is central to the transmission of our monetary policy, provides key signals on market expectations for inflation and future interest rates, and is a key source of high-quality liquid assets for the banking system. Given the centrality of the Treasury market, it is all the more notable that access to data on Treasury market transactions on par with those available for futures, equity, and corporate bond markets is a very recent development. The recent collection of these data has provided crucial insights into the resilience and structure of the Treasury market. Recognizing that the market will continue to evolve, we are committed to doing our part to make sure the scope of our data and their availability evolve commensurately.
1. I am grateful to David Bowman, Dobrislav Dobrev, Peter Johansson, and Michael Puglia for assistance in preparing these remarks. These remarks represent my own views, which do not necessarily represent those of the Federal Reserve Board or the Federal Open Market Committee. Return to text
2. See U.S. Department of the Treasury, Board of Governors of the Federal Reserve System, Federal Reserve Bank of New York, U.S. Securities and Exchange Commission, and U.S. Commodity Futures Trading Commission (2015), Joint Staff Report: The U.S. Treasury Market on October 15, 2014 (PDF) (Washington: Treasury, Board of Governors, FRBNY, SEC, and CFTC, July). Return to text
3. These developments include the mergers and acquisitions between Virtu and KCG and between Teza and Quantlab. See CNBC (2017), "Trading Firm Virtu Financial to Buy KCG for about $1.4 Billion," CNBC, April 20, https://www.cnbc.com/2017/04/20/two-high-speed-trading-firms-merge-in-1-4-billion-deal.html; and Gregory Meyer (2017), "Teza Sells High-Speed Trading as Lucrative Business Sours," Financial Times, March 21. Return to text
4. One example is the Go West Consortium. See Gregory Meyer, Nicole Bullock, and Joe Rennison (2018), "How High-Frequency Trading Hit a Speed Bump," Financial Times, January 1. Return to text
5. See CMG Group (2018), "CME Group Completes Acquisition of NEX, Creating a Leading Global Markets Company across Futures, Cash and OTC," press release, November 2. Return to text
6. LiquidityEdge and OpenDoor, LLC, are two examples of trading platforms offering new models. Return to text
7. See Doug Brain, Michiel De Pooter, Dobrislav Dobrev, Michael Fleming, Peter Johansson, Frank Keane, Michael Puglia, Tony Rodrigues, and Or Shachar (2018). "Breaking Down TRACE Volumes Further," FEDS Notes. Washington: Board of Governors of the Federal Reserve System, November 29, 2018, https://doi.org/10.17016/2380-7172.2299. Return to text
8. See Federal Reserve Bank of New York (2015), "Conference Summary: The Evolving Structure of the U.S. Treasury Market (October 20-21, 2015) (PDF)." Return to text
9. TRACE data do not currently identify PTF firms. We estimate the activity by assuming PTFs account for 92 percent of nondealer trading volume on the electronic and automated interdealer brokers, which is the share of nondealer activity accounted for by PTFs on electronic IDBs reported in the Joint Staff Report from 2014. The Securities and Exchange Commission recently approved a rule change proposed by FINRA to require some reporters in TRACE to identify non-FINRA member activity. Once in effect, this change will enhance regulators' ability to identify trades with PTFs on IDBs and to more accurately identify the share of overall trading activity attributable to PTFs. Return to text
10. See Board of Governors of the Federal Reserve System (2018), Supervision and Regulation Report (Washington: Board of Governors, November). Return to text
11. Note that these auctions differ from proposed high-frequency batch auctions in that they are held at much less frequent intervals, typically separated by hours and, in some cases, occurring only once a day or a week. Return to text
12. Flash events that have occurred in recent years include, but are not limited to, the first "flash crash" in U.S. equity markets on May 6, 2010; the Treasury flash rally of October 15, 2014, the flash event in U.S. equity markets on August 24, 2015; the pound flash crash on October 7, 2016; and the turbulence in U.S. equity and VIX markets on February 5, 2018. Return to text
13. See also Ernst Schaumburg and Ron Yang (2015), "Liquidity during Flash Events," Federal Reserve Bank of New York, Liberty Street Economics (blog), August 18. Return to text
14. See Dobrislav Dobrev and Ernst Schaumburg (2015), "The Liquidity Mirage," Federal Reserve Bank of New York, Liberty Street Economics (blog), October 9. Return to text
15. See Bank for International Settlements, Markets Committee (2018), Monitoring of Fast-Paced Electronic Markets (PDF) (Basel, Switzerland: BIS, September). Return to text
16. See Treasury Market Practices Group (2018), "White Paper on Clearing and Settlement in the Secondary Market for U.S. Treasury Securities (PDF)," consultative white paper (New York: TMPG, July); and Treasury Market Practices Group (2018), Clearing and Settlement in the Secondary Market for U.S. Treasury Securities: Trade Flow Mapping (PDF), consultative report (New York: TMPG, July). Return to text