February 28, 2007
The aging workforce
Vice Chairman Donald L. Kohn
Before the Special Committee on Aging, U.S. Senate
Chairman Kohl, Senator Smith, and members of the Committee, I am pleased to be here today to discuss some recent research at the Federal Reserve on the effect that population aging may have on the growth of the labor force.1 The research is careful and important, but I would like to emphasize that it is a staff product and so does not necessarily represent the views of the Federal Reserve Board.
As we all know, the United States is at the front edge of a massive and important shift in the demographic composition of the population. The onset of the traditional retirement years for the oldest members of the baby-boom generation,2 coupled with a trend toward greater life expectancy and relatively low fertility rates, will cause the share of older individuals in the population to rise markedly in the years ahead. How our society responds to the challenges associated with demographic change will have important consequences for the longer-run prospects for economic growth, average living standards, and the distribution of income and consumption across generations.
The main demographic story is in exhibit 1, which shows that around 2003, the population of those aged 62 and older began growing as a share of the population aged 16 and older. Age 62 is important as the time at which individuals become eligible for Social Security retirement benefits under current law. According to projections from the Bureau of the Census, shown in the shaded area of exhibit 1, the upward trend in aging will steepen noticeably in the next few years. The share of the adult population that is aged 62 and older, now at about 19 percent, is projected to rise to more than 22 percent by 20153.
A subset of the adult population is the labor force--that is, those who are either actively looking for work or have a job. Because the participation of men and women in the labor force declines sharply after age 55, as shown in exhibit 2, the rising share of older individuals has important implications for the nation’s labor supply. In particular, the aging of the population will put significant downward pressure on the total labor force participation rate in coming years, provided the basic pattern of participation over the lifecycle is maintained.
Changes in labor force behavior within age groups also have the potential to add to the downward trend in labor force participation. Exhibit 3 shows that by the time men born in 1935 reached age 30, about 97 percent of them were in the labor force. In contrast, only about 92 percent of 30-year-old men born in 1976 were in the labor force. Although not shown in the exhibit, a roughly similar pattern exists for men older than 30, and, all else equal, the gradual reduction in labor force participation of men has put downward pressure on the overall participation rate.
Exhibit 3 also shows that, until recently, the decline in the labor force participation rate of successive generations of men had been more than offset by a steady increase in the participation rates for each new generation of women. Women born in the 1920s and 1930s had low participation rates at age 30, but three-fourths of 30-year-olds born in 1960 were in the labor force. However, participation rates for more recent generations of 30-year-old women have not risen any further.
Economists at the Federal Reserve have developed a model that combines information on the decline in labor force participation at older ages, shown in exhibit 2, with information on the changes in labor force participation across generations, shown in exhibit 3. Exhibit 4 shows the actual participation rate, the model’s estimate of the underlying trend in the total participation rate between 1995 and 2006, and--under a specific set of assumptions--a projection of the trend out to 2015. The fluctuations in the actual participation rate around the trend largely reflect cyclical influences. For example, the strong demand for labor in the late 1990s caused participation to rise above its longer-run trend, whereas the 2001 recession and subsequent weak labor market caused participation to fall below the trend. Currently, actual participation is again above the estimate of the long-run trend, according to this model, largely because of the current strength of the labor market.
A point more relevant to today’s hearing is that the estimated trend has been declining since about 2002 and is projected by the model to fall substantially further, from about 65-1/2 percent today to about 62-1/2 percent by 2015. That decline in the overall participation rate, coupled with the slowing in the growth of the working-age population projected by the Census Bureau, would be consistent with a slowing in the annual growth of the labor force from the roughly 1-1/4 percent average pace seen in recent years to only 1/4 percent by 2015.
By its very nature, the model can only illustrate what will happen if workers, employers, and policymakers behave in the future in line with the assumptions embodied in the projections. Specifically, the forecast proceeds under the assumption that (1) participation rates among the elderly will rise gradually, (2) the average participation rate for men aged 25-61 will continue to edge down, and (3) participation rates for women in the same age group will not increase further. Of course, these assumptions may not be borne out. As outlined in exhibit 5, several factors may work toward raising the labor force participation rate.
In particular, increasing longevity and improvements in health may induce many more individuals to remain in the workforce well past age 65. For their part, employers, upon facing slower growth in the labor force, may look for ways to attract workers into the labor market. Paying higher wages is one obvious approach. But they could also create flexible work schedules, increase the availability of part-time work, encourage telecommuting, increase training for older workers, and provide additional health care coverage as a way to retain and attract older workers. Such changes might also boost the labor force participation of other age groups.
Government policies can also influence the attractiveness of remaining in the workforce. For example, to raise participation rates among older individuals, policymakers could seek ways to preserve or enhance the incentives to work beyond traditional retirement ages. Government policies could also be designed to make work more attractive to other demographic groups.
Finally, to a limited extent, immigration has the potential to alter the future pace of labor force growth. Most directly, if future immigration rates exceed those assumed by the Census Bureau, the population, and hence the labor force, would grow faster than the Census Bureau currently projects. In addition, because new immigrants tend to be younger and are more likely to participate in the labor force than are native-born individuals, higher immigration would also lead to a higher overall participation rate.
Some of the influences described above may already be boosting the participation rate relative to the model’s prediction. As shown in exhibit 6, the labor force participation rate of individuals aged 62 and older had been trending down since the late 1970s but has been rising markedly since 1995. To some extent, this increase simply reflects the aging of a generation of women who were more likely to be in the labor force throughout their lifetimes than were earlier generations of women. However, the magnitude of the rise is greater than can be explained by this factor alone.
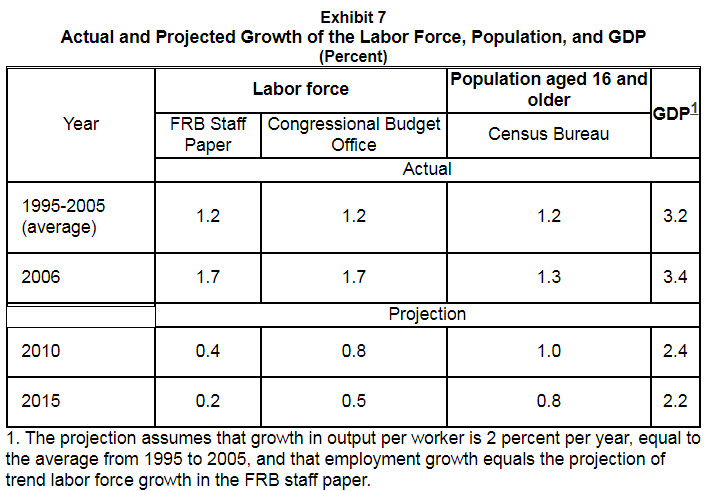
Because the factors just discussed have the potential to offset some of the effects of population aging, and given the considerable uncertainty that surrounds any long-term economic projection, economists hold a range of views about the pace of future labor force growth. A projection from the Congressional Budget Office is shown in exhibit 7. The CBO foresees the pace of trend labor force growth slowing to 1/2 percent per year by 2015, a smaller deceleration than projected by the model developed by Board staff but still a significant slowing.
As I indicated at the outset, the aging of the population has important implications for the living standards of current and future generations. Because total output is equal to output per worker times the number of workers, a slowdown in the rate of labor force growth will, all else equal, tend to slow the growth of output--as shown in the right-most column of exhibit 7. Moreover, if the growth in the labor force is lower than population growth, output per person will, all else equal, rise even more slowly than output per worker. Indeed, as indicated in the exhibit, both the Federal Reserve staff projection and the CBO projection for the growth of the labor force through 2015 are lower than the growth of the population expected in that period by the Census Bureau. Consequently, on these projections, the level of output per person will be lower than it would have been without population aging.
Increasing labor force participation would help reduce these effects, but is unlikely to completely offset them. Thus, without an offsetting increase in productivity growth, the aging of the population likely means that output per person will have to be lower than it would have been in the absence of population aging. Accordingly, a critical question is how that burden will be distributed across generations. If we do nothing, it will, by default, fall entirely on future generations. However, by forgoing some consumption to increase national saving, we can take on some of that burden today and thereby raise the living standards of future generations.4 A rise in saving can achieve that shift because the extra savings would be used to increase the nation’s stock of capital and increase our net holdings of foreign assets. Increasing the amount of productive assets owned by Americans increases the amount of consumption that future generations will be able to enjoy. Determining the best way to distribute the burden associated with the aging of the population should be high on society’s list of priorities.
Footnotes
1. Stephanie Aaronson, Bruce Fallick, Andrew Figura, Jonathan Pingle, and William Wascher (2006), “The Recent Decline in the Labor Force Participation Rate and Its Implications for Potential Labor Supply,” Brookings Papers on Economic Activity, 2006:1, pp. 69-154. Return to text
2. The baby boom is generally taken to be children born from 1946 through 1964. The Census Bureau estimates that roughly 78 million American baby boomers were alive as of July 1, 2005, and that approximately 2.9 million Americans turned 60 in 2006. U.S. Census Bureau (2006), “Facts for Features: Special Edition, Oldest Baby Boomers Turn 60,” press release CB06-FFSE.01-2, January 3, www.census.gov/Press-Release/www/releases/. Return to text
3. This projection combines the latest estimates of population from the Bureau of the Census for 2006 (http://www.census.gov/popest/estimates.php) with the Census Bureau’s projections of population growth by age through 2015 (http://www.census.gov/ipc/www/usinterimproj). Return to text
4. The relationship between population aging and living standards is explored in more detail in Louise Sheiner, Daniel Sichel, and Lawrence Slifman (2007), “A Primer of the Macroeconomics of Population Aging,” Finance and Economics Discussion Series 2007-01 (Washington: Board of Governors of the Federal Reserve System, January). Return to text