Annual Report 2013
Introduction
As required by section 2B of the Federal Reserve Act, the Federal Reserve Board submits written reports to Congress that contain discussions of "the conduct of monetary policy and economic developments and prospects for the future." The Monetary Policy Report, submitted semiannually to the Senate Committee on Banking, Housing, and Urban Affairs and to the House Committee on Banking and Financial Services, is delivered concurrently with testimony from the Federal Reserve Board Chair.
The following discussion is a review of U.S. monetary policy and economic developments in 2013, excerpted from the Monetary Policy Reports published in February 2014 and July 2013. Those complete reports, which include a copy of the Federal Open Market Committee's Statement on Longer-Run Goals and Monetary Policy Strategy, are available on the Board's website at www.federalreserve.gov/monetarypolicy/files/20140211_mprfullreport.pdf (February 2014) and www.federalreserve.gov/monetarypolicy/files/20130717_mprfullreport.pdf (July 2013).
Other materials in this annual report related to the conduct of monetary policy can be found in section 8, "Minutes of Federal Open Market Committee Meetings," and section 10, "Statistical Tables" (see tables 1-4).
Monetary Policy Report of February 2014
Summary
The labor market improved further during the second half of 2013 and into early 2014 as the economic recovery strengthened: Employment has increased at an average monthly pace of about 175,000 since June, and the unemployment rate fell from 7.5 percent in June to 6.6 percent in January. With these gains, payrolls have risen a cumulative 3-1/4 million and the unemployment rate has declined 1-1/2 percentage points since August 2012, the month before the Federal Open Market Committee (FOMC) began its current asset purchase program. Nevertheless, even with these improvements, the unemployment rate remains well above levels that FOMC participants judge to be sustainable in the longer run.
Consumer price inflation remained low. The price index for personal consumption expenditures rose at an annual rate of only 1 percent in the second half of last year, noticeably below the FOMC's longer-run objective of 2 percent. However, some of the recent softness reflects factors that seem likely to prove transitory, and survey- and market-based measures of longer-term inflation expectations have remained in the ranges seen over the past several years.
Economic growth picked up in the second half of last year. Real gross domestic product is estimated to have increased at an annual rate of 3-3/4 percent, up from a 1-3/4 percent gain in the first half. Fiscal policy--which was unusually restrictive in 2013 as a whole--likely began to impose somewhat less restraint on the pace of expansion in the latter part of the year. Moreover, financial markets remained supportive of economic growth--as household net worth rose further, credit became more readily available, and interest rates remained relatively low--and economic conditions in the rest of the world improved overall despite recent turbulence in some emerging financial markets. As a result, growth in consumer spending, business investment, and exports all increased in the second half of last year.
On the whole, the U.S. financial system continued to strengthen. Capital and liquidity profiles at large bank holding companies improved further. In addition, the Federal Reserve and other agencies took further steps to enhance the resilience of the financial system, including strengthening capital regulations for large financial institutions and issuing a final rule implementing the Volcker rule, which restricts such firms' proprietary trading activities. Use of financial leverage was relatively restrained, and valuations in most asset markets were broadly in line with historical norms. Overall, the vulnerability of the system to adverse shocks remained at a moderate level.
With the economic recovery continuing, most Committee members judged by the time of the December 2013 FOMC meeting that they had seen meaningful, sustainable improvement in economic and labor market conditions since the beginning of the current asset purchase program, even while recognizing that the unemployment rate remained elevated and that inflation was running noticeably below the Committee's 2 percent longer-run objective. Accordingly, the FOMC concluded that a highly accommodative policy stance remained appropriate, but that in light of the cumulative progress toward maximum employment and the improvement in the outlook for labor market conditions, the Committee could begin to trim the pace of its asset purchases. Specifically, the Committee decided that, beginning in January, it would add to its holdings of longer-term securities at a pace of $75 billion per month rather than $85 billion per month as it had done previously. At its January meeting, the Committee continued to see improvements in economic conditions and the outlook and reduced the pace of its asset purchases by an additional $10 billion per month, to $65 billion. The FOMC indicated that if incoming information continues to broadly support the Committee's expectation of ongoing improvement in labor market conditions and inflation moving back toward its longer-run objective, the Committee will likely reduce the pace of asset purchases in further measured steps at future meetings. Nonetheless, the Committee reiterated that asset purchases are not on a preset course, and that its decisions about their pace will remain contingent on the Committee's outlook for the labor market and inflation as well as its assessment of the likely efficacy and costs of such purchases. The FOMC also noted that its sizable and still-increasing holdings of longer-term securities should maintain downward pressure on longer-term interest rates, support mortgage markets, and help make broader financial conditions more accommodative.
At the same time, to emphasize its commitment to provide a high level of monetary accommodation for as long as needed to support continued progress toward maximum employment and price stability, the Committee enhanced its forward guidance regarding the federal funds rate. Over the year prior to December 2013, the FOMC had reaffirmed its view that a highly accommodative stance of monetary policy would remain appropriate for a considerable time after the asset purchase program ends and the economic recovery strengthens. In particular, the Committee indicated its intention to maintain the current low target range for the federal funds rate at least as long as the unemployment rate remained above 6-1/2 percent, inflation between one and two years ahead was projected to be no more than a half percentage point above the Committee's 2 percent longer-run goal, and longer-term inflation expectations continued to be well anchored. At the December 2013 FOMC meeting, with the unemployment rate moving down toward the 6-1/2 percent threshold, the Committee decided to provide additional information about how it expects its policies to evolve after the threshold is crossed. Specifically, the Committee indicated its anticipation that it will likely maintain the current federal funds rate target well past the time that the unemployment rate declines below 6-1/2 percent, especially if projected inflation continues to run below its 2 percent goal.
At the time of the most recent FOMC meeting in late January, Committee participants saw the economic outlook as little changed from the time of their December meeting, when the most recent Summary of Economic Projections (SEP) was compiled. (The December SEP is included as Part 3 of the February 2014 Monetary Policy Report; it is also included in section 8 of this annual report.) Participants viewed labor market indicators as showing further improvement on balance--notwithstanding recent mixed readings--and overall economic activity as consistent with growing underlying strength in the broader economy. Even taking into account the recent volatility in global financial markets, participants regarded the risks to the outlook for the economy and the labor market as having become more nearly balanced in recent months. FOMC participants expected that, with appropriate policy accommodation, economic activity would expand at a moderate pace, and that the unemployment rate would gradually decline toward levels the Committee judges consistent with its dual mandate. The Committee recognized that inflation persistently below its 2 percent objective could pose risks to economic performance, and it is monitoring inflation developments carefully for evidence that inflation will move back toward its objective over the medium term.
Part 1: Recent Economic and Financial Developments
The labor market continued to improve over the second half of last year. Job gains have averaged about 175,000 per month since June, and the unemployment rate fell from 7.5 percent in June 2013 to 6.6 percent in January of this year. Even so, the unemployment rate remains well above Federal Open Market Committee (FOMC) participants' estimates of the long-run sustainable rate. Inflation remained low, as the price index for personal consumption expenditures (PCE) increased at an annual rate of 1 percent from June to December--noticeably below the FOMC's longer-run goal of 2 percent. However, transitory influences appear to have been partly responsible for the low readings on inflation last year, and measures of inflation expectations remained steady and near longer-run averages. Growth in economic activity picked up in the second half of 2013. Real gross domestic product (GDP) is estimated to have risen at an annual rate of 3-3/4 percent, up from a 1-3/4 percent rate of increase in the first half. Fiscal policy--which was unusually restrictive in 2013 as a whole--likely started to exert somewhat less restraint on economic growth in the second half of the year. In addition, household net worth rose further as key asset prices continued to increase, credit became more available while interest rates remained low, and economic conditions in the rest of the world improved overall in spite of recent turbulence in emerging financial markets. Consumer spending, business investment, and exports all increased more rapidly in the latter part of last year. In contrast, the recovery in the housing sector appeared to pause in the second half of last year following increases in mortgage interest rates in the spring and summer.
Domestic Developments
The labor market continued to improve, . . .
The labor market continued to improve over the second half of 2013. Payroll employment has increased an average of about 175,000 per month since June, roughly similar to the average gain over the first half of last year (figure 1). In addition, the unemployment rate declined from 7.5 percent in June to 6.6 percent in January of this year (figure 2). A variety of alternative measures of labor force underutilization--which include, in addition to the unemployed, those classified as discouraged, other individuals who are out of work and classified as marginally attached to the labor force, and individuals who have a job but would like to work more hours--have also improved in the past several months. Since August 2012--the month before the Committee began its current asset purchase program--total payroll employment has increased a cumulative 3-1/4 million, and the unemployment rate has declined 1-1/2 percentage points.
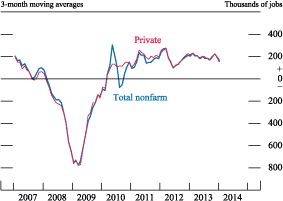
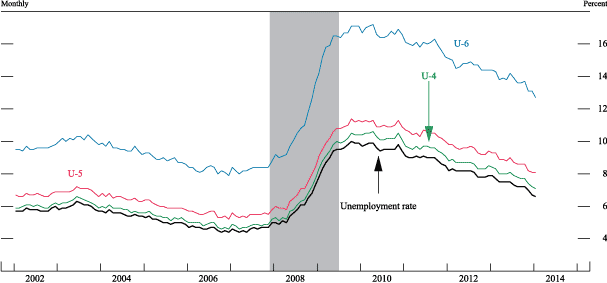
Note: U-4 measures total unemployed plus discouraged workers, as a percent of the labor force plus discouraged workers. Discouraged workers are a subset of marginally attached workers who are not currently looking for work because they believe no jobs are available for them. U-5 measures total unemployed plus all marginally attached to the labor force, as a percent of the labor force plus persons marginally attached to the labor force. Marginally attached workers are not in the labor force, want and are available for work, and have looked for a job in the past 12 months. U-6 measures total unemployed plus all marginally attached workers plus total employed part time for economic reasons, as a percent of the labor force plus all marginally attached workers. The shaded bar indicates a period of business recession as defined by the National Bureau of Economic Research.
Source: Department of Labor, Bureau of Labor Statistics.
. . . although labor force participation remained weak, . . .
While the unemployment rate and total payroll employment have improved further, the labor force participation rate has continued to move lower on net. As a result, the employment-to-population ratio, a measure that combines the unemployment rate and the labor force participation rate, has changed little during the past year. Although much of the decline in participation likely reflects changing demographics--most notably the increasing share in the population of older people, who have lower-than-average participation rates--and would have occurred even if the labor market had been stronger, some of the weakness in participation is also likely due to workers' perceptions of relatively poor job opportunities.
. . . considerable slack in labor markets remains, . . .
Despite its recent declines, the unemployment rate remains well above FOMC participants' estimates of the long-run sustainable rate of unemployment and well above rates that prevailed prior to the recent recession. Moreover, beyond labor force participation, some other aspects of the labor market remain of concern. For example, the share of the unemployed who have been out of work longer than six months and the percentage of the workforce that is working part time but would like to work full time have declined only modestly over the recovery. In addition, the quit rate--an indicator of workers' confidence in the availability of other jobs--remains low.
. . . and gains in compensation have been slow
The relatively weak labor market has also been evident in the behavior of wages, as the modest gains in labor compensation seen earlier in the recovery continued last year. The 12-month change in the employment cost index for private industry workers, which measures both wages and the cost to employers of providing benefits, has remained close to 2 percent throughout most of the recovery. Similarly, average hourly earnings for all employees--the timeliest measure of wage developments--increased close to 2 percent over the 12 months ending in January, about the same pace as over the preceding year. Compensation per hour in the nonfarm business sector--a measure derived from the labor compensation data in the national income and product accounts (NIPA)--can be quite volatile even at annual frequencies, but, over the past three years, this measure has increased at an annual average pace of 2-1/4 percent, well below the average pace prior to the
recent recession.
Productivity growth has also been relatively weak over the recovery. From the end of 2009 to the end of 2013, annual growth in output per hour in the nonfarm business sector averaged only 1-1/4 percent, considerably slower than the average rate before the recent recession. However, with the recent strengthening in the pace of economic activity, productivity growth rose to an annual rate of nearly 3-1/2 percent over the second half of last year.
Inflation was low . . .
Inflation remained low in the second half of 2013, with the PCE price index increasing at an annual rate of only 1 percent from June to December, similar to the increase in the first half and noticeably below the FOMC's long-run objective of 2 percent (figure 3). Core PCE prices--or prices of PCE goods and services excluding food and energy--also increased at an annual rate of about 1 percent over the second half of 2013. Other measures of core consumer price inflation, such as the core consumer price index, were also low last year relative to norms prevailing in the years prior to the recent recession, though not as low as core PCE inflation.
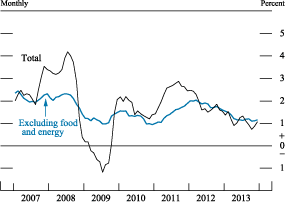
Note: The data extend through December 2013; changes are from one year earlier.
Source: Department of Commerce, Bureau of Economic Analysis.
Some of the recent softness in core PCE price inflation reflects factors that appear to have been transitory. In particular, after increasing at an average annual rate of 1-3/4 percent from the end of 2009 to the end of 2012, non-oil import prices fell 1-1/4 percent in 2013, pushed down by the effects of dollar appreciation and declining commodity prices during the first half of last year. These factors have abated since last summer, as the broad nominal value of the dollar has moved up only a little, on net, and the fall in overall nonfuel commodity prices has eased. In addition, during the final part of 2013, prices for a few industrial metals reversed part of their earlier declines, supported by a positive turnaround in
Chinese demand.
Moreover, despite the relatively meager gains in wages, recent increases in the cost of labor needed to produce a unit of output (unit labor costs)--which reflects movements in both labor compensation and productivity and is a useful gauge of the influence of labor-related production costs on inflation--do not suggest an unusual amount of downward pressure on inflation. Unit labor costs increased at an annual rate of 1-1/2 percent over the past two years, just a little below their average prior to the recent recession.
Consumer energy and food prices changed relatively little over the second half of 2013. The spot price of Brent crude oil, after peaking in late August at nearly $120 per barrel, has been relatively stable in recent months, trading at about $110 per barrel since mid-September, as a continued increase in North American crude oil production has helped buffer the effects of some supply disruptions elsewhere (figure 4). Meanwhile, strong harvests have put downward pressure on food commodity prices, and, as a result, consumer food prices--which reflect both commodity prices and processing costs--were little changed in the second half of last year.
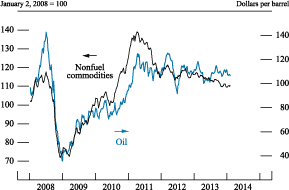
Note: The data are weekly averages of daily data through February 6, 2014. The price of oil is the spot price of Brent crude oil, and the price of nonfuel commodities is an index of 23 primary-commodity prices.
Source: Commodity Research Bureau.
. . . but inflation expectations changed little
The Federal Reserve monitors the public's expectations of inflation, in part because these expectations may influence wage- and price-setting behavior and thus actual inflation. Despite the weakness in recent inflation data, survey- and market-based measures of longer-term inflation expectations changed little, on net, over the second half of last year and have remained fairly stable in recent years. Median expected inflation over the next 5 to 10 years, as reported in the Thomson Reuters/University of Michigan Surveys of Consumers, was 2.9 percent in January, within the narrow range of the past decade (figure 5).1 In the Survey of Professional Forecasters, conducted by the Federal Reserve Bank of Philadelphia, the median expectation for the annual rate of increase in the PCE price index over the next 10 years was 2 percent in the fourth quarter of 2013, similar to its level in recent years. Meanwhile, measures of medium- and longer-term inflation compensation derived from differences between yields on nominal and inflation-protected Treasury securities have remained within their respective ranges observed over the past several years.
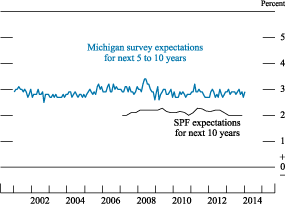
Note: The Michigan survey data are monthly. The SPF data for inflation expectations for personal consumption expenditures are quarterly and extend from 2007:Q1 through 2013:Q4.
Source: Thomson Reuters/University of Michigan Surveys of Consumers; Survey of Professional Forecasters (SPF).
Growth in economic activity picked up
Real GDP is estimated to have increased at an annual rate of 3-3/4 percent over the second half of last year, up from a reported 1-3/4 percent pace in the first half (figure 6). Gross domestic income, or GDI, an alternative measure of economic output, increased a little more than 3 percent over the four quarters ending in the third quarter of last year (the most recent data available), 1 percentage point faster than the increase in GDP over this period.2
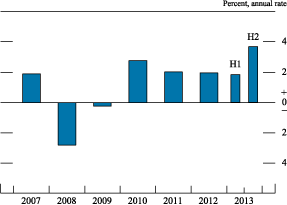
Some of the strength in GDP growth in the second half of 2013 reflected a pickup in the pace of inventory investment, a factor that cannot continue indefinitely. But other likely more persistent factors influencing demand shifted in a more favorable direction as well. In particular, restraint from fiscal policy likely started to diminish in the latter part of last year. In addition, further increases in the prices of corporate equities and housing boosted household net worth, while credit became more broadly available to households and businesses and interest rates remained low. Moreover, the boom in oil and gas production continued. Finally, economic conditions in the rest of the world improved overall, notwithstanding recent market turmoil in some emerging market economies (EMEs). As a result, consumer spending, business investment, and exports all increased more rapidly in the latter part of the year, more than offsetting a slowing in the pace of residential investment.
Fiscal policy was a notable headwind in 2013, . . .
Relative to prior recoveries, fiscal policy in recent years has been unusually restrictive, and the drag on GDP growth in 2013 was particularly large. The expiration of the temporary payroll tax cut and tax increases for high-income households at the beginning of 2013 restrained consumer spending. Moreover, federal purchases were pushed down by the sequestration, budget caps on discretionary spending, and the drawdown in foreign military operations. As a result, real federal purchases, as measured in the NIPA, fell at an annual rate of more than 7 percent over the second half of the year (figure 7). Due to the government shutdown in October, which temporarily held down purchases in the fourth quarter, this decline was somewhat steeper than in the first half.3
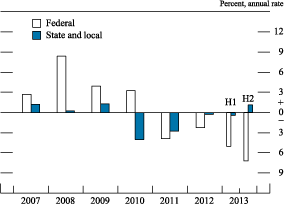
The federal budget deficit declined as a share of GDP for the fourth consecutive year in fiscal year 2013, reaching about 4 percent of GDP. Although down from nearly 10 percent in fiscal 2009, the fiscal 2013 deficit is still 1-1/2 percentage points higher than its 50-year average. Federal receipts rose in fiscal 2013 but still were only 16-3/4 percent of GDP; federal outlays, while falling, remained elevated at 20-3/4 percent of GDP in the past fiscal year. With the deficit still elevated, the debt-to-GDP ratio increased from 69 percent at the end of fiscal 2012 to 71 percent at the end of fiscal 2013.
. . . but fiscal drag appears to be easing
Although the expiration of emergency unemployment compensation at the beginning of this year will impose some fiscal restraint, fiscal policy is in the process of becoming less restrictive for GDP growth. Most importantly, the drag on growth in consumer spending from the tax increases at the beginning of 2013 has likely begun to wane. In addition, the Bipartisan Budget Act of 2013 will ease the limits on spending associated with the sequestration, and an increase in transfers from the Affordable Care Act should provide a boost to demand beginning this year. Also, fiscal conditions at the state and local levels of government have improved, and real purchases by such governments are estimated to have edged up in 2013 after several years of declines.
Consumer spending rose faster, supported by improvements in labor markets, . . .
After increasing at an annual rate of 2 percent in the first half of 2013, real PCE rose at a 2-3/4 percent rate over the second half (figure 8). Real disposable personal income--which had been pushed lower by the tax increases in the first quarter of 2013--moved up in the final three quarters of the year. Continued job gains helped improve the economic prospects of many households last year and boosted aggregate income growth. And the net rise in consumer sentiment in recent months suggests that greater optimism about the economy on the part of households should support consumer spending in early 2014.
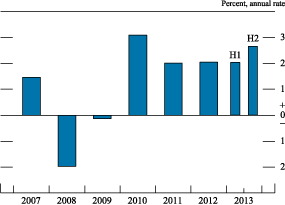
. . . as well as increases in household net worth and low interest rates
Consumer spending was also likely supported by a significant increase in household net worth in the second half of last year, as prices of corporate equities and housing continued to rise. (For further information, see the box "Recent Changes in Household Wealth" in the February 2014 Monetary Policy Report.) In addition, consumer credit for auto purchases (including loans to borrowers with subprime credit scores) and for education has remained broadly available. Moreover, interest rates for auto loans have stayed low. And spending on consumer durables--which is quite sensitive to interest rates--rose at an annual rate of nearly 7 percent in the second half of the year. Nevertheless, standards and terms for credit card debt have remained tight, and, partly as a result, credit card balances changed relatively little over the second half.
Business investment picked up . . .
Business fixed investment (BFI) rose at an annual rate of 4-1/4 percent in the second half of 2013 after changing little in the first half. Investment in equipment and intangible capital rose at an annual rate of nearly 4 percent, while investment in nonresidential structures increased close to 6 percent (figure 9). On balance, national and regional surveys of purchasing managers suggest that orders for new equipment continued to increase at the turn of the year. However, still-high vacancy rates and relatively tight financing conditions likely continued to limit building investment; despite the recent increases, investment in buildings remains well below the peaks reached prior to the most recent recession.
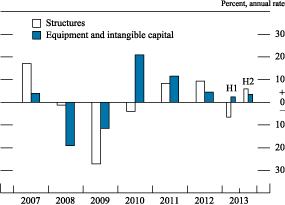
The relatively modest rate of increase in the demand for business output has likely restrained BFI in recent quarters. In 2012 and the first half of 2013, business output increased at an annual rate of only 2-1/2 percent. However, the acceleration in overall economic activity in the second half of 2013 may provide more impetus for business investment in the period ahead.
. . . as financing conditions for businesses were generally quite favorable
Moreover, the financial condition of nonfinancial firms remained strong in the second half of 2013, with profitability high and the default rate on nonfinancial corporate bonds close to zero. Interest rates on corporate bonds, while up since the spring, have stayed low relative to historical norms. And net issuance of nonfinancial corporate debt appears to have remained strong in the second half of the year. In addition, in recent quarters an increasing portion of the aggregate proceeds from the issuance of speculative-grade debt was reportedly intended for uses beyond the refinancing of existing debt.
Conditions in business loan markets also continued to improve. According to the Federal Reserve Board's January 2014 Senior Loan Officer Opinion Survey on Bank Lending Practices (SLOOS), a modest net fraction of respondents indicated they had eased standards on commercial and industrial (C&I) loans over the second half of 2013.4 In addition, according to the Federal Reserve Board's November 2013 Survey of Terms of Business Lending, loan rate spreads over banks' cost of funds have continued to decline. Financing conditions for small businesses also improved: Reductions in loan spreads have been most notable for the types of loans likely made to small businesses--that is, loans of $1 million or less or those originated by small domestic banks. Standards on commercial real estate (CRE) loans extended by banks also eased over the second half of last year, moving back toward longer-run norms, according to the SLOOS. Still, standards for construction and land development loans, a subset of CRE loans, likely remained relatively tight.
Exports strengthened
Export demand also provided significant support to domestic economic activity in the second half of 2013 (figure 10). Real exports of goods and services rose at an annual rate of 7-1/2 percent, consistent with improving foreign GDP growth in the latter part of the year and buoyed by soaring sales both of petroleum products--associated with the boom in U.S. oil production--and of agricultural goods. Across the major destinations, the robust increase in exports was supported by higher shipments to Canada, China, and other Asian emerging economies.
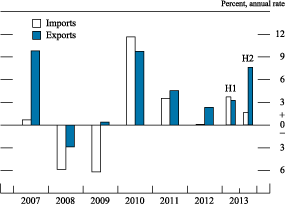
The growth of real imports of goods and services stepped down to an annual rate of 1-1/2 percent in the second half of last year. Among the major categories, imports of non-oil goods and services rose more moderately, while oil imports continued to decline.
Altogether, real net trade added an estimated 3/4 percentage point to GDP growth over the second half of 2013, whereas in the first half it made a small negative contribution. Owing in part to the improvement in net petroleum trade, the nominal trade deficit shrank, on balance, over the second half of 2013. That decrease contributed to the narrowing of the current account deficit to 2-1/4 percent of GDP in the third quarter, a level generally not seen since the
late 1990s.
The current account deficit continued to be financed by strong financial inflows in the third quarter of 2013, mostly in the form of purchases of Treasury and corporate securities by both foreign official and foreign private investors. Partial monthly data suggest that these trends likely continued in the fourth quarter. U.S. investors continued to finance direct investment projects abroad at a rapid pace in the third quarter. Although U.S. purchases of foreign securities edged down in the summer, consistent with stresses observed in emerging markets, they appear to have rebounded in the final part of the year.
The recovery in housing investment paused with the backup in interest rates . . .
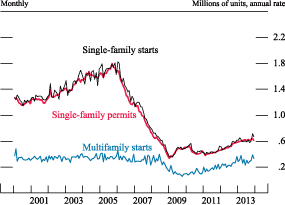
After increasing at close to a 15 percent annual rate in 2012 and the first part of 2013, residential investment was little changed in the second half of last year. Mortgage interest rates increased about 1 percentage point, to around 4-1/4 percent, over May and June of last year and have remained near this level since then. Soon after the increase, mortgage refinancing dropped sharply, while home sales declined somewhat and the issuance of new single-family housing permits leveled off (figure 11). However, relative to historical norms, mortgage rates remain low, and housing is still quite affordable. Moreover, steady growth in jobs is likely continuing to support growth in housing demand, and, because new home construction is still well below levels consistent with population growth, the potential for further growth in the housing sector is considerable.
Note: The data extend through December 2013.
Source: Department of Commerce, Bureau of Economic Analysis.
. . . and mortgage credit continued to be tight, . . .
Lending policies for home purchase remained quite tight overall, but there are some indications that mortgage credit is starting to become more widely available. A modest net fraction of SLOOS respondents reported having eased standards on prime residential loans during the second half of last year. And, in a sign that lending conditions for home refinance are becoming less restrictive, the credit scores of individuals refinancing mortgages at the end of last year were lower, on average, than scores for individuals refinancing earlier in the year. However, credit scores of individuals receiving mortgages for home purchases have yet to drop.
. . . but house prices continued to rise
Home prices continued to rise in the second half of the year, although somewhat less quickly than in the first half (figure 12). Over the 12 months ending in December, home prices increased 11 percent. Much of the recent gain in home prices has been concentrated in areas that saw the largest declines in prices during the recession and early recovery, as prices in these areas likely dropped below levels consistent with the rents these homes could bring, spurring purchases by large and small investors who have converted some homes into rental properties.
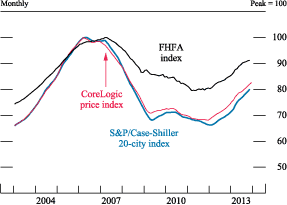
Note: The data for the FHFA index and the S&P/Case-Shiller index extend through November 2013, and the data for the CoreLogic index extend through December 2013. Each index has been normalized so that its peak is 100. Both the CoreLogic price index and the FHFA index include purchase transactions only. The S&P/Case-Shiller index reflects all arm's-length sales transactions in selected metropolitan areas.
Source: Federal Housing Finance Agency (FHFA); Case-Shiller data via S&P Capital IQ Solutions' Capital IQ Platform; staff calculations based on data provided by CoreLogic.
Financial Developments
The expected path for the federal funds rate through mid-2017 moved lower . . .
Market-based measures of the expected (or mean) future path of the federal funds rate through mid-2017 moved lower, on balance, over the second half of 2013 and early 2014, mostly reflecting FOMC communications that were broadly seen as indicating that a highly accommodative stance of monetary policy would be maintained for longer than had been expected. Measures of the expected policy path rose in the summer in conjunction with longer-term interest rates, as investors increasingly expected the Committee to start reducing the pace of asset purchases at the September FOMC meeting. However, those increases were more than retraced over the weeks surrounding the September meeting, in part because the decision to keep the pace of asset purchases unchanged and the accompanying communications by the Federal Reserve were viewed as more accommodative than investors had anticipated. Expectations for the path of the federal funds rate through mid-2016 have changed little, on net, since mid-October. Federal Reserve communications since last September, including the enhanced forward guidance included in the December and January FOMC statements, reportedly helped keep federal funds rate expectations near their earlier levels despite generally stronger-than-expected economic data and the modest reductions in the pace of Federal Reserve asset purchases announced at the December and January FOMC meetings.
The modal path of the federal funds rate--that is, the values for future federal funds rates that market participants see as most likely--derived from interest rate options also shifted down for horizons through 2017, suggesting that investors may now expect the target federal funds rate to lift off from its current range substantially later than they had expected at the end of June 2013. Similarly, the most recent Survey of Primary Dealers conducted by the Open Market Desk at the Federal Reserve Bank of New York just prior to the January FOMC meeting showed that dealers' expectations of the date of liftoff have moved out about two quarters since the middle of last year, to the fourth quarter of 2015.5
. . . while yields on longer-term securities increased but remained low by historical standards
Despite the lower expected path of the federal funds rate, yields on longer-term Treasury securities and agency mortgage-backed securities (MBS) rose moderately over the second half of 2013 (figure 13). These increases likely reflected economic data that were generally better than investors expected, as well as market adjustments to rising expectations that the Committee would start reducing the pace of its asset purchases, a step that was taken at the December FOMC meeting. Subsequently, yields declined amid flight-to-safety flows in response to recent emerging market turbulence (see the box "Financial Stress and Vulnerabilities in the Emerging Market Economies" in the February 2014 Monetary Policy Report). On net, yields on 5-, 10-, and 30-year nominal Treasury securities have increased between about 10 and 20 basis points from their levels at the end of June 2013. Yields on 30-year agency MBS edged up, on balance, over the same period.
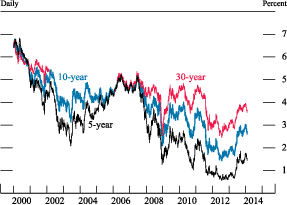
Note: The Treasury ceased publication of the 30-year constant maturity series on February 18, 2002, and resumed that series on February 9, 2006.
Source: Department of the Treasury.
Nonetheless, yields on longer-term securities continue to be low by historical standards. Those low levels reflect several factors, including subdued inflation expectations as well as market perceptions of a still-modest global economic outlook. In addition, term premiums--the extra return investors expect to obtain from holding longer-term securities as opposed to holding and rolling over a sequence of short-term securities for the same period--while above the historically low levels observed prior to the bond market selloff in the summer, remained within the low range they have occupied since the onset of the financial crisis, reflecting both the FOMC's large-scale asset purchases and strong demand for longer-term securities from global investors.
Indicators of Treasury market functioning were solid, on balance, over the second half of 2013 and early in 2014. For example, available data suggest that bid-asked spreads in the Treasury market stayed in line with recent averages. Moreover, Treasury auctions generally continued to be well received by investors. Liquidity conditions in the agency MBS market deteriorated somewhat for a time over the summer, amid heightened volatility, and a bit again toward year-end but have largely returned to normal levels since the turn of the year. Over the past seven months, the number of trades in the MBS market that failed to settle remained low, and implied financing rates in the "dollar roll" market--an indicator of the scarcity of agency MBS for settlement--have been stable.6
Short-term funding markets continued to function well, on balance, despite some strains during the debt ceiling standoff
In the fall of 2013, many short-term funding markets were adversely affected for a time by concerns about the possibility of a delay in raising the federal debt limit. The Treasury bill market experienced the largest effect as yields on bills maturing between mid-October and early November rose sharply, some bill auctions saw reduced demand, and liquidity in this market deteriorated, especially for certain securities that were seen as being at risk of delayed payment. Conditions in other short-term funding markets, such as the market for repurchase agreements (repos), were also strained for a time. However, these effects eased quickly after an agreement to raise the debt limit was reached in mid-October, and, overall, the debt ceiling standoff left no permanent imprint on short-term funding markets.
On balance, since the end of June 2013, conditions in both secured and unsecured short-term funding markets have changed little, with many money market rates remaining near the bottom of the ranges they have occupied since the federal funds rate first reached its zero lower bound. Unsecured offshore dollar funding markets generally did not exhibit any signs of stress. Rates on asset-backed commercial paper and unsecured financial commercial paper for the most part also stayed low. In the repo market, rates for general collateral Treasury repos also were low, consistent with reduced financing activities of dealers. These rates declined noticeably at year-end, leading to increased participation in the Federal Reserve's overnight reverse repurchase agreement operations (see Part 2 of this report). Overall, year-end pressures in short-term funding markets were modest and roughly in line with experiences during other years since the financial crisis.
Broad equity price indexes increased further and risk spreads on corporate debt declined . . .
Boosted by improved market sentiment regarding the economic outlook and the FOMC's sustained highly accommodative monetary policy, broad measures of equity prices continued posting substantial gains through the end of 2013. Around the turn of the year, however, investor sentiment deteriorated amid resurfacing concerns about emerging financial markets, and equity prices retraced some of their earlier increases. As of early February, broad measures of equity prices were more than 10 percent higher, on net, than their levels in the middle of 2013 (figure 14). Consistent with the developments in equity markets, the spreads of yields on corporate bonds to yields on Treasury securities of comparable maturities have narrowed, on net, since the middle of 2013. Spreads on syndicated loans have also narrowed some, and issuance of leveraged loans, boosted by strong demand from collateralized loan obligations, was generally strong in the second half of 2013.
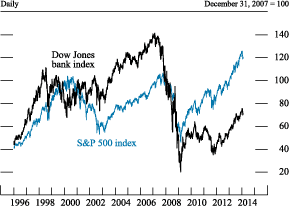
Source: Dow Jones bank index and Standard & Poor's 500 index via Bloomberg.
While some broad equity price indexes touched all-time highs in nominal terms since the middle of 2013 and valuation metrics in some sectors appear stretched, valuation measures for the overall market are now generally at levels not far above their historical average levels, suggesting that, in aggregate, investors are not excessively optimistic in their attitudes toward equities. Implied volatility for the S&P 500 index, as calculated from option prices, generally remained low over the period; it has risen since early January but remains below the recent high reached during the debt ceiling standoff in the fall.
. . . and market sentiment toward financial institutions continued to strengthen as their capital and liquidity profiles improved
Market sentiment toward the financial sector continued to strengthen in the second half of 2013, reportedly driven in large part by improvements in banks' capital and liquidity profiles, as well as further improvements in asset quality. On average, equity prices of large domestic banks and insurance companies performed roughly in line with broader equity indexes. The spreads on the credit default swap (CDS) contracts written on the debt of these firms generally narrowed. Among nonbank financial institutions, many hedge funds significantly underperformed benchmark indexes in the second half of 2013 and, according to responses to the Federal Reserve Board's December Senior Credit Officer Opinion Survey on Dealer Financing Terms, have reduced their use of leverage on net.7 The industry as a whole continued to see strong inflows, however, bringing its assets under management to an all-time high by the end of 2013.
Standard measures of profitability of bank holding companies (BHCs) were little changed in the third quarter of 2013, as large reductions in income from mortgage originations and revenue from fixed-income trading, as well as a sharp increase in litigation expenses, were offset primarily by decreases in provisions for loan losses and in employee compensation. Asset quality continued to improve for BHCs, with delinquency rates declining across a range of asset classes and the industry's net charge-off rate now close to pre-crisis levels (figure 15). Net interest margins remained about unchanged over the same period. (For further discussion of the financial condition of BHCs, see the box "Developments Related to Financial Stability" in the February 2014 Monetary Policy Report.) Meanwhile, aggregate credit provided by commercial banks inched up in the second half of 2013 following the rise in longer-term interest rates. Strong growth in loan categories that are more likely to have floating interest rates or shorter maturities--including C&I, CRE, and auto loans--was partly offset by runoffs in assets that have longer duration and so are more sensitive to increases in interest rates--including residential mortgages and some securities.
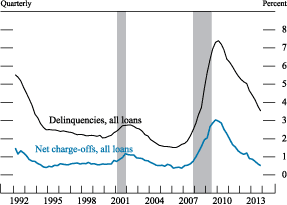
Note: The data extend through 2013:Q3. The delinquency rates are the percent of loans 30 days or more past due or not accruing interest. The net charge-off rates are the percent of loans charged off net of recoveries. The shaded bars indicate a period of business recession as defined by the National Bureau of Economic Research.
Source: Federal Financial Institutions Examination Council, FFIEC 031/041, "Consolidation Reports of Condition and Income for Commerical Banks" (Call Reports).
Financial conditions in the municipal bond market generally remained stable
Yields on 20-year general obligation municipal bonds rose since June 2013. However, the spreads of municipal bond yields over those of comparable-maturity Treasury securities generally fell over the same period, and CDS spreads on debt obligations of individual states were generally little changed and remained at moderate levels.
Nevertheless, significant financial strains have been evident for some issuers. For example, the City of Detroit filed for bankruptcy in July 2013, making it the largest municipal bankruptcy filing in U.S. history. In addition, the prices of bonds issued by Puerto Rico continued to reflect the substantial financial pressures facing the territory and the spreads for five-year CDS contracts written on the debt issued by the territory soared. In early February, some of the territory's bonds were downgraded to below the investment grade.
M2 rose briskly
M2 has increased at an annual rate of about 7-1/2 percent since June, faster than the pace registered in the first half of 2013. Flows into M2 picked up amid the selloff in fixed-income markets in the summer, which prompted large outflows from bond funds, as well as the uncertainty about the passage of debt limit legislation in the fall, which appeared to have led some institutional investors to shift from money fund shares to bank deposits. Following the resolution of the fiscal standoff, M2 growth slowed significantly as investors reallocated out of cash positions.
International Developments
Bond yields rose sharply in some emerging market economies, but were flat to down in most advanced foreign economies
Foreign long-term bond yields rose significantly from May of last year through most of the summer, as expectations of an imminent reduction in the pace of large-scale asset purchases by the Federal Reserve intensified. In many EMEs, yields stabilized after the September FOMC meeting. However, in a handful of vulnerable EMEs, sovereign yields continued to exhibit outsized increases--particularly in Brazil and Turkey--and, more recently, EME yields generally moved up as several EMEs experienced heightened financial stresses (see the box "Financial Stress and Vulnerabilities in the Emerging Market Economies" in the February 2014 Monetary Policy Report). Rates in the advanced foreign economies (AFEs) rose slightly on balance during the second half of 2013, with improved economic conditions generally supporting yields. In particular, bond yields increased in the United Kingdom as unemployment fell more quickly than anticipated. In the euro area, yields were little changed, as below-target inflation led the European Central Bank (ECB) to cut its main refinancing rate a further 25 basis points in November. In contrast, Japanese government bond yields were down modestly, on net, since mid-July, in part as market participants anticipated that the Bank of Japan (BOJ) would expand the size of its asset purchase program. Over the past two weeks, however, AFE sovereign yields in general declined somewhat, as market participants pulled back from risky assets.
The dollar has appreciated a little on net
The broad nominal value of the dollar is up a little, on net, since last summer (figure 16). The dollar depreciated against both the euro and the British pound in the second half of the year, as macroeconomic conditions improved in Europe and as financial stresses and the associated flight to safety continued to abate. However, the dollar has appreciated sharply against the Japanese yen since October, in part reflecting anticipations of an expansion in the BOJ's asset purchase program, although it retraced somewhat in recent weeks amid the recent turbulence in emerging financial markets. The U.S. dollar also appreciated against the currencies of some vulnerable EMEs amid higher long-term yields in the United States, and, more recently, as market participants expressed concerns about developments in several economies (figure 17). EME-dedicated bond and equity funds experienced outflows over the second half of last year and into 2014, suggesting a reduced willingness by investors to maintain exposures to EMEs. In an attempt to curb the depreciation of their currencies, central banks in some EMEs, such as Brazil and Turkey, intervened in currency markets.
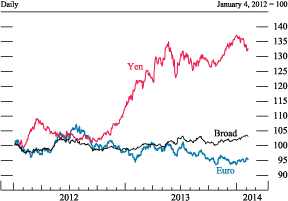
Note: The data are in foreign currency units per dollar.
Source: Federal Reserve Board, Statistical Release H.10, "Foreign Exchange Rates."
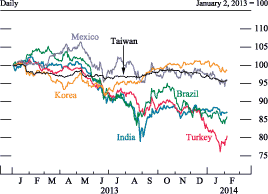
Note: Upward movement indicates appreciation of the local currency against the U.S. dollar.
Source: Bloomberg.
During the second half of 2013, equity indexes in the AFEs added considerably to earlier gains, likely reflecting the improved economic outlook. Over the year as a whole, equity markets in Japan outperformed other foreign indexes, increasing more than 50 percent. Since the end of last year, however, AFE equity indexes have reversed part of their earlier gains, with the decrease coinciding with heightened financial volatility in the EMEs. Equity markets in the EMEs, after underperforming those in the AFEs during the second half of last year, have also fallen more recently.
Activity in the advanced foreign economies continued to recover . . .
Indicators suggest that economic growth in the AFEs edged higher in the second half of 2013, supported by diminished fiscal drag and further easing of European financial stresses. The euro area continued to pull slowly out of recession in the third quarter, with some of the most vulnerable economies returning to positive growth, but unemployment remained at record levels. Real GDP growth in the United Kingdom picked up to a robust 3 percent pace in the second half of last year, driven in part by improving household and business sentiment, and Canadian growth rebounded in the third quarter after being restrained by floods that impeded economic activity in the second quarter. Japanese GDP growth stepped down in the third quarter from the rapid 4 percent pace registered in the first half, as exports dipped and household spending moderated, but data on manufacturing and exports suggest that growth rebounded toward year-end.
Amid stronger growth and rising import prices, Japanese inflation moved above 1 percent for the first time since 2008. In contrast, 12-month rates of inflation fell below 1 percent in some other AFEs, with much of this decline reflecting falling retail energy and food prices as well as continued economic slack. With inflation low and economic activity still sluggish, monetary policy in the AFEs remains very accommodative. In addition to the ECB's cut of its main refinancing rate in November, the Bank of England issued forward guidance in August that it intends to maintain a highly stimulative policy stance until economic slack has been substantially reduced, while the BOJ continued its aggressive program of asset purchases.
. . . while growth in the emerging market economies moved back up from its softness earlier last year
After slowing earlier last year, economic growth in the EMEs moved back up in the third quarter, reflecting a rebound of Mexican activity from its second-quarter contraction and a pickup in emerging Asia. Recent data suggest that activity in EMEs continued to strengthen in the fourth quarter.
In China, economic growth picked up in the second half of 2013, supported in part by relatively accommodative policies and rapid credit growth earlier in the year. Since the middle of last year, the pace of credit creation has slowed, interbank interest rates have trended up, and the interbank market has experienced bouts of volatility during which interest rates spiked. In mid-November, Chinese leaders unveiled an ambitious reform agenda that aims to enhance the role of markets in the economy, address worrisome imbalances, and improve the prospects for sustainable economic growth.
The step-up in Chinese growth, along with firmer activity in the advanced economies, generally helped support economic activity in other parts of Asia. In Mexico, growth appears to have rebounded in the second half of the year, supported by higher government spending and a pickup in U.S. manufacturing activity. In recent months, Mexico continued to make progress on the government's reform agenda, with its Congress approving fiscal, energy, and financial sector reforms. By contrast, in some EMEs, such as Brazil, India, and Indonesia, shifts in market expectations about the path of U.S. monetary policy appear to have resulted in tightened financial conditions, which weighed on growth over the second half of last year.
Inflation remained subdued in most EMEs, and their central banks generally kept policy rates on hold or, as in Chile, Mexico, and Thailand, cut them to further support growth. In contrast, inflation remained elevated in a few EMEs, such as Brazil, India, Indonesia, and Turkey, due to currency depreciation as well as country-specific factors, including supply bottlenecks and tight labor market conditions in some sectors. In response to higher inflation, central banks in these countries raised rates and, in some cases, intervened in foreign exchange markets to support their currencies.
Part 2: Monetary Policy
In light of the cumulative progress toward maximum employment and the improvement in the outlook for labor market conditions, the Federal Open Market Committee (FOMC) decided to modestly reduce the pace of its asset purchases at its December 2013 and January 2014 meetings. Nonetheless, with unemployment still well above its longer-run normal level and inflation below the Committee's 2 percent objective, the stance of monetary policy remains highly accommodative, with the Federal Reserve continuing to increase the size of its balance sheet, albeit at a reduced pace, and having enhanced its forward guidance with regard to the future path of the federal funds rate.
Through most of last year, the FOMC maintained the current pace of large-scale asset purchases while awaiting more evidence that progress toward its economic objectives would be sustained . . .
Since the onset of the financial crisis and ensuing deep recession, the unemployment rate has remained well above its normal levels and the inflation rate has tended to run at or below the FOMC's 2 percent objective despite the target range for the federal funds rate remaining at its effective lower bound. Accordingly, the strategy of the FOMC during the past several years has been to employ alternative methods of providing additional monetary accommodation and promoting the more rapid achievement of its mandated objectives of maximum employment and price stability. In particular, the FOMC has used large-scale asset purchases and forward guidance regarding the future path of the federal funds rate to put downward pressure on longer-term interest rates.
During most of the second half of 2013, with unemployment still elevated (though declining), and with inflation remaining noticeably below the Committee's 2 percent longer-run objective, the FOMC left in place the key parameters of its monetary policy stance while awaiting further evidence that progress toward its economic objectives would be sustained. Nonetheless, the Committee recognized the cumulative improvement in labor market conditions and therefore believed it important to begin the process of outlining the considerations that would ultimately govern the winding-down of the program of large-scale asset purchases. In his press conference following the June 2013 FOMC meeting, Chairman Bernanke indicated that, if the economy were to evolve broadly in line with the expectations that the Committee held at that time, the FOMC would moderate the pace of purchases later in 2013 and, if economic developments remained broadly consistent with the Committee's expectations, subsequently reduce them in further measured steps. However, the Chairman emphasized that the Committee's purchases were in no way predetermined, and that a decision about reducing the pace of purchases would depend on how economic conditions evolved.8
At each of its subsequent meetings prior to December 2013, the Committee judged that the outlook for the economy and the labor market had improved, on net, since the inception of the current asset purchase program, but that it was appropriate to await more evidence that the progress would be sustained before the Committee began adjusting the pace of its purchases. In addition, at the July meeting, the Committee recognized that inflation persistently below its 2 percent objective could pose risks to economic performance.9 At the September FOMC meeting, Committee members also expressed concern about near-term fiscal uncertainties and the rapid tightening of financial conditions observed over the summer, which, if sustained, could have slowed improvements in the economy and the labor market.10 The Committee therefore decided to await more evidence that progress toward its goals would be maintained before adjusting the pace of asset purchases and, in the meantime, continued adding to its holdings of agency mortgage-backed securities (MBS) and longer-term Treasury securities at a pace of $40 billion and $45 billion per month, respectively.
. . . before modestly reducing the pace of asset purchases in light of the cumulative progress toward maximum employment and the improvement in the outlook for labor market conditions
By the time of the December 2013 meeting, most Committee members viewed the cumulative improvement in labor market conditions as meaningful and likely to be sustained. Participants also anticipated that inflation would move back toward 2 percent over time as the economic recovery strengthened and longer-run inflation expectations remained steady. Therefore, most members agreed that the Committee could appropriately begin to slow the pace of its asset purchases. Nonetheless, some members expressed concern about the potential for an unintended tightening of financial conditions if a reduction in the pace of asset purchases was misinterpreted as signaling that the Committee was likely to withdraw policy accommodation more quickly than had been anticipated. Many members therefore judged that the Committee should proceed cautiously in taking its first action to reduce the pace of asset purchases and should indicate that further reductions would be undertaken in measured steps. Members also stressed the need to underscore that the pace of asset purchases was not on a preset course and would remain contingent on the Committee's outlook for the labor market and inflation as well as its assessment of the efficacy and costs of purchases.
Consistent with this approach, the Committee announced at the December meeting that it would reduce the pace of its purchases of agency MBS from $40 billion to $35 billion per month and reduce the pace of its purchases of longer-term Treasury securities from $45 billion to $40 billion per month. The Committee continued to see improvements in economic conditions and the labor market outlook at the January meeting and further reduced the pace of its asset purchases to $30 billion per month for agency MBS and $35 billion per month for longer-term Treasury securities.
While deciding to modestly reduce its pace of purchases, the Committee emphasized that its holdings of longer-term securities were sizable and would still be increasing, which would promote a stronger economic recovery by maintaining downward pressure on longer-term interest rates, supporting mortgage markets, and helping to make broader financial conditions more accommodative. The Committee reiterated that it will continue its asset purchases and employ its other policy tools as appropriate until the outlook for the labor market has improved substantially in a context of price stability. The FOMC also maintained its practices of reinvesting principal payments it receives on agency debt and agency-guaranteed MBS in new agency MBS and of rolling over maturing Treasury securities at auction.
The Committee first kept in place and then reinforced its forward guidance on the path of the federal funds rate
With regard to the federal funds rate, the Committee continued to indicate through the second half of 2013 its expectation that a highly accommodative stance of monetary policy will remain appropriate for a considerable time after the asset purchase program ends and the economic recovery strengthens. In particular, the Committee stated that the current exceptionally low target range for the federal funds rate of 0 to 1/4 percent will be appropriate at least as long as the unemployment rate remains above 6-1/2 percent, inflation between one and two years ahead is projected to be no more than a half percentage point above the Committee's 2 percent longer-run goal, and longer-term inflation expectations continue to be well anchored. The Committee emphasized that these criteria are thresholds, not triggers, meaning that crossing a threshold will not lead automatically to an increase in the federal funds rate but will indicate only that it is appropriate for the Committee to consider whether the broader economic outlook justifies such an increase.
In December, with the unemployment rate having moved closer to the 6-1/2 percent threshold, the FOMC decided to provide qualitative guidance to clarify its likely actions during the time after the unemployment threshold is crossed and, in particular, to emphasize its commitment to providing a high level of monetary accommodation for as long as needed to foster its objectives. Specifically, the Committee indicated that in determining how long to maintain a highly accommodative stance of monetary policy, it will consider not only the unemployment rate but also other indicators, including additional measures of labor market conditions, indicators of inflation pressures and inflation expectations, and readings on financial developments. Further, the Committee stated that, based on these factors, it continues to anticipate that it will likely be appropriate to maintain the current federal funds rate target well past the time that the unemployment rate declines to below 6-1/2 percent, especially if projected inflation continues to run below the Committee's 2 percent longer-run goal. The Committee continued to indicate that when it decides to begin to remove policy accommodation, it will take a balanced approach consistent with its longer-run goals of maximum employment and inflation of 2 percent.
The Committee's large-scale asset purchases led to a significant increase in the size of the Federal Reserve's balance sheet
As a result of the Committee's large-scale asset purchase program, Federal Reserve assets have increased significantly since the middle of last year (figure 18). The par value of the holdings of U.S. Treasury securities in the System Open Market Account (SOMA) increased $315 billion to $2.2 trillion, and the par value of its holdings of agency debt and MBS increased $308 billion, on net, to $1.5 trillion.11 As of the end of January 2014, the SOMA's holdings of Treasury and agency securities constituted 55 percent and 39 percent, respectively, of the $4 trillion in total Federal Reserve assets. As a result of these purchases, the size of the overall Federal Reserve balance sheet increased briskly over the second half of the year; on the liability side of the balance sheet, the rise resulted in a further increase in reserve balances.
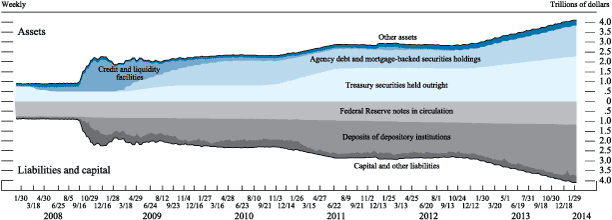
Note: The data extend through February 7, 2014. Credit and liquidity facilities consists of primary, secondary, and seasonal credit; term auction credit; central bank liquidity swaps; support for Maiden Lane, Bear Stearns, and AIG; and other credit facilities, including the Primary Dealer Credit Facility, the Asset-Backed Commercial Paper Money Market Mutual Fund Liquidity Facility, the Commercial Paper Funding Facility, and the Term Asset-Backed Securities Loan Facility. Other assets includes unamortized premiums and discounts on securities held outright. Other liabilities includes reverse repurchase agreements, the U.S. Treasury General Account, and the U.S. Treasury Supplementary Financing Account. The dates on the horizontal axis are those of regularly scheduled Federal Open Market Committee meetings.
Source: Federal Reserve Board, Statistical Release H.4.1, "Factors Affecting Reserve Balances," www.federalreserve.gov/releases/h41/.
Reflecting the continued improvement in offshore U.S. dollar funding markets, the outstanding amount of dollars provided through the temporary U.S. dollar liquidity swap arrangements with foreign central banks decreased $1 billion, bringing the level close to zero. To reduce uncertainties among market participants as to whether and when these arrangements would be renewed, at the October FOMC meeting the Committee agreed to convert the existing temporary central bank liquidity swap arrangements to standing arrangements with no preset expiration dates, with the intention to review participation in these arrangements annually. These modifications to the liquidity swap arrangements were introduced to help support financial stability and confidence in global funding markets.
Interest income on the SOMA portfolio continued to support a substantial volume of remittances to the U.S. Treasury Department. Preliminary estimates suggest that in 2013 the Federal Reserve provided more than $77 billion of such distributions to the Treasury.12
The Federal Reserve continued to test tools that could potentially be used to manage reserves
As part of its ongoing program to ensure the readiness of tools to manage reserves, the Federal Reserve conducted a series of small-scale transactions with eligible counterparties. Since the end of June 2013, the Federal Reserve has conducted four operations for 28-day term deposits under the Term Deposit Facility. The offerings had a fixed-rate format, with individual operations totaling between about $12 billion and $13.5 billion in deposits. In addition, in August 2013, the Federal Reserve conducted six overnight reverse repurchase operations with auction sizes between $1 billion and $5 billion, using Treasury securities and agency MBS as collateral.
Moreover, in support of the Committee's longer-run plan for improvements in the implementation of monetary policy, at the July 2013 FOMC meeting, the Committee discussed the potential for establishing a fixed-rate, full-allotment overnight reverse repurchase agreement (ON RRP) facility as an additional tool for managing money market interest rates. At the September 2013 meeting, the Committee authorized the Open Market Desk to conduct a series of fixed-rate ON RRP operations involving U.S. government securities and securities that are direct obligations of, or fully guaranteed as to principal and interest by, any agency of the United States, for the purpose of assessing operational readiness. A number of meeting participants emphasized that their interest in these operations reflected an ongoing effort to improve the technical execution of policy and did not signal any change in the Committee's views about policy going forward.
From the operations' inception through early February, the fixed rate on the operations has been adjusted gradually within the authorized limits of 0 to 5 basis points set by the FOMC, and the daily counterparty allotment limit has been gradually raised from $500 million to $5 billion. All operations to date have proceeded smoothly. Participation in and usage of ON RRP operations has varied from day to day, in part reflecting changes in the spread between market rates on repurchase agreement transactions and the rate offered in the Federal Reserve's ON RRP operations, as well as quarter-end dynamics. In particular, take-up at these operations surged at year-end and only partly retraced over recent weeks, as rates in markets for Treasury repurchase agreements remained generally low against the backdrop of reduced supply of U.S. Treasury securities in collateral markets. The operations were reauthorized at the January FOMC meeting through January 30, 2015, to allow the Committee to obtain additional information about the potential usefulness of ON RRP operations to affect market interest rates when doing so becomes appropriate.
In addition, the Desk has been developing the capability to conduct agency MBS transactions over FedTrade, its proprietary trading platform. To test this capability, the Desk conducted an exercise consisting of a series of small-value purchase and sale operations of agency MBS via FedTrade, running from November 21, 2013, through January 14, 2014. The operations conducted as part of this exercise did not exceed $500 million in total and were not counted toward the monthly agency MBS purchases that the Desk was conducting at the direction of the FOMC.
References
1. The question in the Michigan survey asks about inflation generally but does not refer to any specific price index. Return to text
2. Conceptually, GDI and GDP should be equal, but because they are measured with different source data, they can send different signals about growth in U.S. economic output. Return to text
3. Through a reduction in hours worked by federal employees, the shutdown is estimated to have directly reduced real GDP growth about 1/4 percentage point at an annual rate in the fourth quarter. This influence is likely to be reversed in the first quarter
of 2014. Return to text
4. The SLOOS is available on the Board's website at www.federalreserve.gov/boarddocs/snloansurvey. Return to text
5. The results of the Survey of Primary Dealers are available on the Federal Reserve Bank of New York's website at www.newyorkfed.org/markets/primarydealer_survey_questions.html ![]() . Return to text
. Return to text
6. A dollar roll transaction consists of a purchase or sale of agency MBS with a simultaneous agreement to sell or purchase substantially similar securities on a specified future date. The Committee directs the Desk to engage in these transactions as necessary to facilitate settlement of the Federal Reserve's agency MBS purchases. Return to text
7. The Senior Credit Officer Opinion Survey on Dealer Financing Terms is available on the Board's website at www.federalreserve.gov/econresdata/releases/scoos.htm. Return to text
8. See Board of Governors of the Federal Reserve System (2013), "Transcript of Chairman Bernanke's Press Conference," June 19, www.federalreserve.gov/mediacenter/files/FOMCpresconf20130619.pdf. Return to text
9. See Board of Governors of the Federal Reserve System (2013), "Federal Reserve Issues FOMC Statement," press release, July 31, www.federalreserve.gov/newsevents/press/monetary/20130731a.htm. Return to text
10. See Board of Governors of the Federal Reserve System (2013), "Transcript of Chairman Bernanke's Press Conference," September 18, www.federalreserve.gov/mediacenter/files/FOMCpresconf20130918.pdf. Return to text
11. The difference between changes in the par value of SOMA holdings and the amount of purchases of securities since the middle of 2013 reflects, in part, lags in settlements. Return to text
12. See Board of Governors of the Federal Reserve System (2014), "Reserve Bank Income and Expense Data and Transfers to the Treasury for 2013," press release, January 10, www.federalreserve.gov/newsevents/press/other/20140110a.htm. Return to text
