

Profits and Balance Sheet Developments at U.S. Commercial Banks in 2006
Mark Carlson and Gretchen C. Weinbach, of the Board's Division of Monetary Affairs, prepared this article. Thomas C. Allard assisted in developing the database underlying much of the analysis. Isaac L. Laughlin provided research assistance.
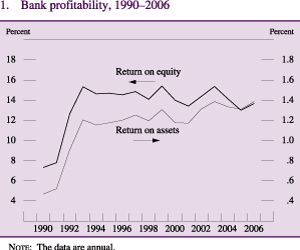
The U.S. commercial banking industry continued to be quite profitable in 2006, and industry assets grew considerably. The strength in profitability and growth of bank balance sheets last year reflected favorable U.S. financial market conditions and the generally solid economic expansion. Industry return on equity advanced from its 2005 level, and the return on assets edged up to match its highest annual level in recent decades ( figure 1 ).
Profitability was supported by brisk growth in non-interest income and generally strong asset quality; the flattening of the yield curve and competitive pressures, however, further weighed on net interest margins.
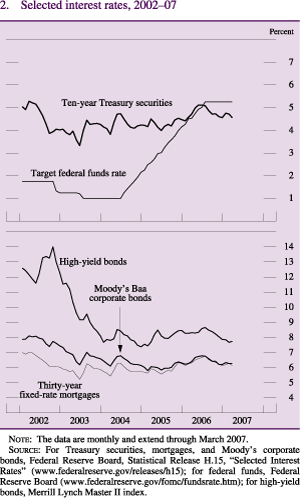
In U.S. financial markets during 2006, short-term interest rates generally moved higher with the target federal funds rate, which increased 1 percentage point over the first half of the year as monetary policy was tightened and then held steady thereafter ( figure 2 ). Intermediate- and longer-term interest rates also rose significantly over the first half of the year, but much of those increases were later reversed. The Treasury yield curve flattened further and at times was inverted. Interest rates on fixed-rate home mortgages rose somewhat on average and, like Treasury yields, peaked around midyear. Corporate risk spreads generally remained quite narrow, and spreads on high-yield corporate bonds fell to levels seldom seen since 1997.
The U.S. economy expanded at a brisk pace over the first quarter of 2006 and then grew moderately, on average, over the rest of the year. In the corporate sector, spending picked up relative to 2005 as businesses increased their investment in fixed assets and inventories. Although hefty corporate profits and substantial cash balances helped fund business spending, firms' demand for external financing still rose notably. Demand was also supported by heavy merger and acquisition activity and record levels of share repurchases. Availability of bank-intermediated business credit also increased during the year as banks reportedly eased terms on their commercial and industrial (C&I) loans, particularly spreads of loan rates over their costs of funds. Strong fundamentals in the commercial real estate sector, including rising property values and declining vacancy rates, bolstered the demand for commercial mortgages.
In the household sector, higher mortgage rates and a cooling of the pace of house-price appreciation combined to damp residential housing activity. By the end of 2006, home sales had ebbed markedly, and home construction activity had slowed significantly. In addition, mortgage refinancing activity declined, on average, last year. Moderate growth in consumer spending was supported by continued strength in the labor market and gains in household wealth from significant increases in equity prices and advances in home prices during the first half of the year.
These financial and economic conditions shaped balance sheet developments at commercial banks. On the asset side, borrowing by businesses to finance capital expenditures and merger and acquisition activity contributed to the rapid growth in C&I lending for the second consecutive year. The financing of residential home construction likely helped fuel the construction and land development component of commercial real estate loans in recent years, but the pace of such lending moved lower in 2006 as home construction activity slowed. Apart from the consolidation of a sizable amount of thrift assets onto banks' books in the fourth quarter that resulted from a reorganization within a large bank holding company, residential real estate lending also decelerated. Growth in consumer loans--which had been particularly lackluster in 2005, when households apparently substituted mortgage debt for consumer debt--picked back up to a moderate pace. 1 The attractiveness of mortgage financing relative to consumer loans probably diminished last year as mortgage rates rose and appreciation in house prices slowed. On the liability side, increases in short-term interest rates likely contributed to some shifts in the profile of banks' deposits. Small time deposits, whose yields track market rates relatively closely, grew particularly quickly, whereas other components of core deposits expanded more slowly or even contracted. 2 With their rates lagging market rates on average, core deposits as a whole grew at a slower pace than total assets, and banks tapped managed liabilities, particularly large time and foreign-booked deposits, to fund their asset growth.
Economic and financial conditions also had a strong effect on bank profitability. Brisk growth in non-interest income supported profits; for large banks, trading revenue surged, and income from securitization and investment banking activity also grew notably, the latter likely boosted in part by the financing of corporate mergers and acquisitions. Although non-interest expense grew--mainly because of an increase in salaries and benefits costs--its growth lagged that of non-interest income. The configuration of market interest rates and competitive pressures caused the industry's net interest margin to edge lower, and margins at large banks were affected the most. Loss provisioning continued to be near the low end of its historical range as a share of assets, although this measure turned up a bit in the fourth quarter. The low level of provisioning reflected asset quality that generally remained solid. Banks' direct exposure to subprime mortgages generally appeared limited. Still, delinquency rates associated with residential real estate moved up in the second half of the year from exceptionally low levels. Charge-off rates remained quite low for all major loan categories.
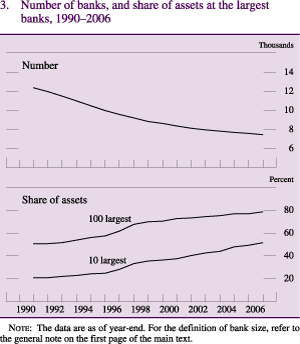
The number of new banks chartered in 2006 picked up for the fourth consecutive year but remained below the number of bank mergers and consolidations. As a result, the number of banks declined further, to 7,403 at year-end 2006 from 7,522 at year-end 2005 ( figure 3 ). Merger and consolidation activity involving the top 10 banks pushed the share of industry assets accounted for by these banks up 2.3 percentage points, to 51.7 percent, at year-end. The share of assets held at the 100 largest banks rose 1.6 percentage points, to 78.5 percent. According to the Federal Deposit Insurance Corporation (FDIC), 2006 was the second consecutive year with no bank failures.
There was more merger activity at the holding-company level in 2006 than in 2005, and the rate at which bank holding companies were formed held about steady. There were 5,102 bank holding companies at year-end 2006, 52 less than at year-end 2005 (for multitiered bank holding companies, only the top-tier organization is counted in these figures). At the end of 2006, the 50 largest bank holding companies with major commercial banking operations accounted for 76 percent of all bank holding company assets, a figure unchanged from 2005. 3 The number of financial holding companies rose last year--it moved up from 625 at year-end 2005 to 643 at year-end 2006. Most of the largest bank holding companies are also financial holding companies. As a result, about 86 percent of the assets of bank holding companies were held by financial holding companies. 4
Balance Sheet Developments
Total bank assets expanded 12.4 percent in 2006, the largest annual gain in the past two decades and about 5 percentage points faster than total domestic nonfinancial sector debt ( table 1 ). Bank loans grew at a rate of 12 percent; the increase importantly reflected strong C&I lending, which was spurred by greater financing needs related to inventory accumulation and capital investment by nonfinancial firms as well as from increased merger-related financing activity. Robust real estate lending was a significant contributor to bank loan growth, especially in the first half of the year, but--excluding the effects of the sizable thrift-to-bank consolidation noted above--growth in real estate loans slowed notably later in the year as home construction and sales decelerated. Banks' securities holdings expanded at a rate of 11.5 percent. Total bank assets expanded at a faster pace than either loans or securities in 2006 as federal funds sold and securities purchased under resale agreements and balances due from depository institutions, which together account for 7 percent of assets, increased 20 percent.
| Item | 1997 | 1998 | 1999 | 2000 | 2001 | 2002 | 2003 | 2004 | 2005 | 2006 | Memo Dec. 2006 (billions of dollars) |
|---|---|---|---|---|---|---|---|---|---|---|---|
| Assets | 9.22 | 8.18 | 5.44 | 8.76 | 5.11 | 7.19 | 7.18 | 10.78 | 7.72 | 12.36 | 9,996 |
| Interest-earning assets | 8.66 | 8.16 | 5.87 | 8.66 | 3.95 | 7.54 | 7.28 | 11.29 | 7.96 | 12.44 | 8,687 |
| Loans and leases (net) | 5.32 | 8.70 | 8.10 | 9.24 | 1.82 | 5.90 | 6.51 | 11.20 | 10.38 | 11.98 | 5,853 |
| Commercial and industrial | 12.02 | 12.94 | 7.88 | 8.54 | -6.73 | -7.41 | -4.56 | 4.35 | 12.53 | 11.86 | 1,132 |
| Real estate | 9.30 | 7.99 | 12.22 | 10.74 | 7.94 | 14.44 | 9.75 | 15.41 | 13.80 | 14.94 | 3,395 |
| Booked in domestic offices | 9.53 | 7.97 | 12.36 | 11.02 | 8.02 | 14.85 | 9.66 | 15.09 | 13.93 | 15.06 | 3,339 |
| One- to four-family residential | 9.67 | 6.36 | 9.70 | 9.28 | 5.70 | 19.86 | 10.01 | 15.75 | 11.95 | 15.15 | 1,891 |
| Other real estate | 9.32 | 10.29 | 16.06 | 13.31 | 10.95 | 8.81 | 9.19 | 14.20 | 16.61 | 14.94 | 1,448 |
| Booked in foreign offices | .34 | 8.79 | 6.28 | -1.62 | 3.97 | -7.41 | 15.74 | 35.59 | 7.19 | 8.68 | 56 |
| Consumer | -2.19 | .34 | -1.48 | 8.04 | 4.16 | 6.55 | 9.31 | 10.11 | 2.24 | 6.30 | 849 |
| Other loans and leases | -7.91 | 13.46 | 7.17 | 7.01 | -2.02 | -.03 | 8.31 | 3.57 | -.18 | 2.97 | 547 |
| Loan-loss reserves and unearned income | -.45 | 3.08 | 2.37 | 7.98 | 13.15 | 5.73 | -2.68 | -4.19 | -5.74 | 1.81 | 70 |
| Securities | 8.85 | 8.40 | 5.11 | 6.36 | 7.22 | 16.20 | 9.44 | 10.58 | 2.40 | 11.53 | 2,099 |
| Investment account | 8.66 | 12.07 | 6.68 | 2.85 | 8.88 | 13.53 | 8.70 | 6.15 | 1.19 | 6.91 | 1,633 |
| U.S. Treasury | -8.85 | -25.17 | -1.89 | -32.72 | -40.27 | 41.92 | 14.14 | -15.87 | -17.59 | -19.30 | 40 |
| U.S. government agency and corporation obligations | 14.18 | 17.01 | 1.83 | 3.75 | 12.84 | 18.09 | 9.68 | 9.46 | -1.83 | 4.71 | 1,016 |
| Other | 11.21 | 26.99 | 20.90 | 13.39 | 12.18 | 2.72 | 5.98 | 3.02 | 10.12 | 13.68 | 577 |
| Trading account | 10.00 | -13.32 | -6.93 | 37.16 | -3.72 | 36.12 | 14.01 | 36.81 | 7.96 | 31.46 | 466 |
| Other | 38.53 | 3.78 | -8.37 | 10.30 | 13.02 | -2.92 | 6.82 | 14.28 | 5.81 | 19.14 | 736 |
| Non-interest-earning assets | 13.03 | 8.37 | 2.64 | 9.45 | 12.79 | 5.10 | 6.61 | 7.60 | 6.18 | 11.85 | 1,308 |
| Liabilities | 9.11 | 8.06 | 5.58 | 8.59 | 4.45 | 7.13 | 7.24 | 9.55 | 7.74 | 12.10 | 8,971 |
| Core deposits | 4.52 | 7.04 | .23 | 7.53 | 10.55 | 7.58 | 7.29 | 8.25 | 6.41 | 5.80 | 4,474 |
| Transaction deposits | -4.55 | -1.41 | -8.97 | -1.31 | 10.20 | -5.12 | 2.82 | 3.20 | -1.21 | -4.24 | 704 |
| Savings deposits (including MMDAs) | 12.96 | 18.32 | 6.68 | 12.51 | 20.68 | 18.46 | 13.71 | 11.72 | 6.94 | 5.52 | 2,898 |
| Small time deposits | 4.18 | .53 | -.76 | 7.20 | -7.23 | -4.92 | -6.79 | 1.58 | 12.91 | 16.72 | 872 |
| Managed liabilities 1 | 13.79 | 9.44 | 15.54 | 8.79 | -2.73 | 5.34 | 6.96 | 12.06 | 12.23 | 19.51 | 3,904 |
| Large time deposits | 20.14 | 9.10 | 14.19 | 19.37 | -3.65 | 5.05 | 1.42 | 21.86 | 22.85 | 16.16 | 1,006 |
| Deposits booked in foreign offices | 11.13 | 8.71 | 14.60 | 7.84 | -10.96 | 4.49 | 12.63 | 16.84 | 6.32 | 29.67 | 1,193 |
| Subordinated notes and debentures | 21.05 | 17.00 | 5.07 | 13.98 | 9.56 | -.59 | 5.08 | 10.49 | 11.41 | 22.60 | 149 |
| Gross federal funds purchased and RPs | 30.51 | 4.35 | 1.56 | 6.49 | 5.72 | 12.75 | -8.70 | 8.40 | 15.62 | 9.47 | 695 |
| Other managed liabilities | -4.04 | 15.65 | 35.27 | 1.80 | -.28 | .97 | 22.00 | 1.37 | 6.15 | 18.90 | 861 |
| Revaluation losses held in trading accounts | 36.94 | 3.44 | -13.20 | 7.47 | -17.06 | 33.44 | 14.02 | -12.61 | -17.86 | 6.89 | 144 |
| Other | 14.82 | 12.73 | -1.26 | 20.61 | 14.90 | 5.23 | 5.28 | 17.08 | -1.74 | 22.24 | 449 |
| Capital account | 10.44 | 9.53 | 3.89 | 10.65 | 12.30 | 7.84 | 6.61 | 23.14 | 7.59 | 14.74 | 1,025 |
| Memo | |||||||||||
| Commercial real estate loans 2 | 10.13 | 11.37 | 15.42 | 12.16 | 13.10 | 6.82 | 8.99 | 13.93 | 16.87 | 14.89 | 1,444 |
| Mortgage-backed securities | 14.16 | 22.12 | -3.34 | 3.29 | 29.05 | 15.54 | 10.12 | 13.45 | 2.06 | 8.92 | 960 |
| Federal Home Loan Bank advances | n.a. | n.a. | n.a. | n.a. | n.a. | 17.21 | 3.71 | 3.73 | 10.00 | 29.80 | 349 |
Note:
Data are from year-end to year-end and are as of April 13, 2007.
1. Measured as the sum of large time deposits in domestic offices, deposits booked in foreign offices, subordinated notes and debentures, federal funds purchased and securities sold under repurchase agreements, Federal Home Loan Bank advances' and other borrowed money.
Return to table
2. Measured as the sum of large time deposits in domestic offices, deposits booked in foreign offices, subordinated notes and debentures, federal funds purchased and securities sold under repurchase agreements, Federal Home Loan Bank advances and other borrowed money.
Return to table
n.a. Not available.
MMDA Money market deposit account.
RP Repurchase agreement.
On the liability side of the balance sheet, core deposit growth remained moderate. Rising short-term interest rates in the first half of the year made liquid deposits less attractive because their interest rates adjust sluggishly to changes in market rates. This slow growth, however, was partly offset by the brisk expansion of small time deposits, interest rates on which moved more in line with market rates. On net, growth in overall core deposits was modest, and banks, especially the largest ones, turned to managed liabilities to fund the rapid expansion of assets.
Banks' capital expanded somewhat faster than assets. Equity capital was boosted by increased goodwill and by strong retained earnings. Regulatory capital, which generally excludes goodwill, grew a touch slower than equity capital. Nevertheless, regulatory capital expanded a bit faster than risk-weighted assets, and regulatory capital ratios ticked higher.
Loans to Businesses
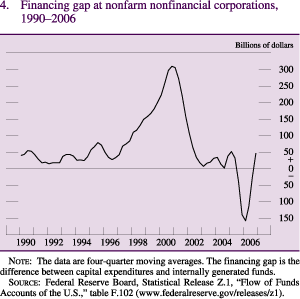
Increases in both fixed and inventory investment boosted spending by U.S. nonfinancial corporations in 2006. The stepped-up pace of capital expenditures pushed the financing gap into positive territory despite firms' strong profits and robust cash positions ( figure 4 ). 5 To help fund investment, businesses relied more on external resources, including C&I loans and corporate bond issuance. Merger and acquisition (M&A) activity among nonfinancial firms has been strong over the past few years and continued apace in 2006. Financing needs associated with this activity also added to C&I loan demand. Equity share repurchases remained very strong last year and likely supported the growth of business borrowing. C&I loan growth last year reflected importantly a substantial expansion in syndicated loans (refer to box "Syndicated Loans" ). Commercial real estate lending expanded robustly, but the pace was a bit slower than it was in 2005.
Syndicated Loans
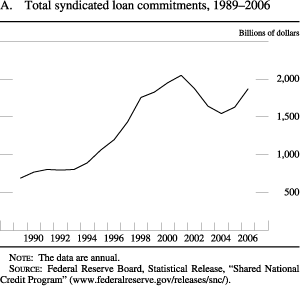
Syndicated business loans grew briskly in 2006 and remained an important component of bank-intermediated credit. According to the latest data from the Shared National Credit (SNC) Program, syndicated loan commitments totaled $1.9 trillion in mid-2006, slightly below their 2001 peak of $2 trillion ( figure A ). 1 The volume of such commitments expanded 15 percent over the previous year, the largest annual increase this decade. The strong growth was fueled, in part, by the financing of corporate mergers, acquisitions, and leveraged buyouts.
Although a wide and growing array of institutional investors are participating in the syndicated loan market, domestic commercial banks continue to account for a considerable share of such commitments. The share of all commitments accounted for by domestic banks stood at 44 percent in mid-2006, a portion that has remained fairly steady over the past several years. By contrast, the portion of all syndicated loan commitments held by nonbanks has trended higher over the same period--mainly at the expense of foreign banking organizations--and it reached 14 percent in mid-2006. 2 The growing competition from nonbank institutional investors and the increased liquidity of the secondary market have reportedly led to a compression of credit spreads in the syndicated loan market. This combination has also reportedly resulted in some easing of underwriting standards and terms, particularly looser loan covenants.
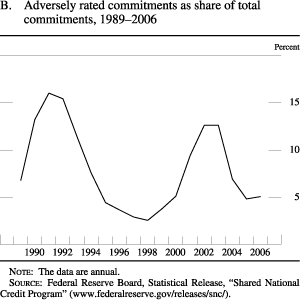
Nonetheless, the credit quality of syndicated loans generally stayed solid in 2006. The share of total commitments that were adversely rated was again around 5 percent last year, a figure in the lower portion of its historical range ( figure B ). 3 However, the credit quality of syndicated loan commitments varies significantly by holder. Classified commitments accounted for roughly 2 percent of total commitments at both domestic banks and foreign banking organizations in mid-2006, but at nonbanks they made up nearly 12 percent. 4 The relatively low portion of classified syndicated loan credits at banks likely reflects the fact that banks are predominantly exposed to investment-grade, rather than leveraged, syndicated credits.
1. The SNC Program generally covers credits of at least $20 million that are shared by three or more
regulated financial institutions. Credits include syndicated loans and
loan commitments, letters of credit, and commercial leases, as well as
other forms of credit. Credit commitments include both drawn and
undrawn portions of credit facilities. For more information, refer to
the Board of Governors of the Federal Reserve System (2006),
Statistical Release, "
Shared National Credit Program
" (September
25).
Return to text
2. Nonbanks include a wide range of institutional investors, such as brokerage firms, mutual
funds, insurance companies, hedge funds, and securitization
vehicles.
Return to text
3. Adversely rated credits are those considered special
mention, substandard, doubtful, or loss.
Return to text
4. Classified credits are those rated substandard, doubtful, and loss.
Return to text
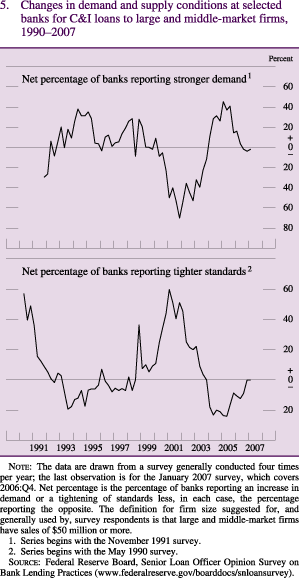
The strength in C&I lending was evident at commercial banks of all sizes last year, as this category of loans expanded 12 percent at both larger and smaller banks. According to respondents to the Senior Loan Officer Opinion Survey on Bank Lending Practices (BLPS), loan demand was rising as the year started and held steady thereafter ( figure 5) . Banks reporting stronger demand during the year generally pointed to increased needs by businesses to finance M&A activity, accumulate inventory, or invest in plant and equipment.
In light of the rapid pace of corporate merger activity in 2006 and the frequency with which BLPS respondents cited customer M&A financing needs as an important reason for increased demand, the October 2006 survey contained some special questions on the influence of M&A activity on C&I lending. About 15 percent of institutions, including some of the largest C&I lenders, reported that between 11 percent and 30 percent of the C&I loans on their books were related to mergers and acquisitions. Most of the remaining banks noted that these loans accounted for less than 10 percent of their C&I loan portfolio. Half the respondents, again including some of the largest C&I lenders, indicated that the share of loans on their books that were M&A-related had increased over the past twelve months, a pattern consistent with other reports suggesting that this type of activity has supported the growth in C&I lending. A sizable portion of the recent wave of mergers and acquisitions took the form of leveraged buyouts. As with M&A-related loans in general, a few banks reported significant involvement in these transactions, with about 15 percent of respondents indicating that more than 30 percent of the M&A-related loans on their books were used to finance leveraged buyouts. Close to 80 percent of banks, however, reported that they were not very involved in providing loans to finance this type of deal.
Changes in lending standards and terms may also have supported C&I loan growth in 2006. Early in the year, a modest net share of BLPS respondents indicated that they had eased their lending standards for C&I loans. Somewhat larger net fractions also reported easing lending terms on C&I loans, especially by reducing the spread of loan rates over their cost of funds. Respondent banks most frequently cited competition from other funding sources as a reason for easing their C&I lending policies. A small number of institutions reported tightening lending terms--in particular by raising the premiums charged on riskier loans--and frequently pointed to a less-favorable or more-uncertain economic outlook, as well as a reduced tolerance for risk, as reasons for doing so.
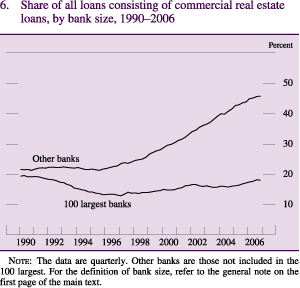
Commercial real estate (CRE) loans also expanded briskly last year, but the pace of the advance was down slightly from 2005. All banks registered strong growth in this loan category, but the expansion was a bit faster at the banks outside the top 100. As a result of this rapid growth, CRE loans now account for slightly more than 45 percent of the loans of these smaller institutions, well above the levels of the 1990s ( figure 6 ). This level of concentration has not gone unnoticed by bank supervisors, and in December of 2006, the Federal Reserve, FDIC, and Office of the Comptroller of the Currency issued interagency guidance to promote sound risk-management practices at banks regarding their CRE loans.
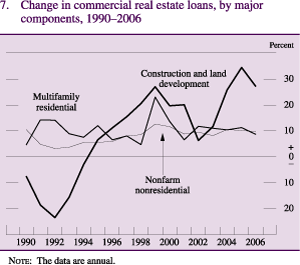
For the third year in a row, CRE lending was boosted by rapid growth of construction and land development loans. Such loans expanded at a rate of 27 percent and accounted for more than one-third of all CRE loans at the end of 2006 ( figure 7 ). A considerable portion of the rapid growth in recent years likely reflects loans to residential developers, consistent with the strength in housing construction that was evident until early last year. However, the housing market cooled significantly over the course of 2006, and the growth rate of construction and land development loans stepped down markedly. Real estate loans backed by nonfarm nonresidential structures, the largest category of CRE loans, grew 9.6 percent last year, a pace about equal to the average growth rate over the past decade. CRE loans secured by multifamily dwellings expanded somewhat more slowly than in 2005.
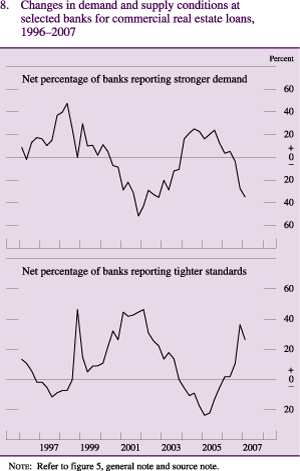
The slightly slower growth of CRE loans relative to the previous year appears to reflect shifts in demand for such loans as well as a tightening of lending standards ( figure 8 ). Banks responding to the BLPS indicated that demand for CRE loans strengthened a touch early in the year but then weakened notably later in the year, a pattern that roughly matches the changes in the growth rates of construction and land development loans. Similarly, survey respondents reported little change in their standards for approving CRE loans in the first two surveys of 2006, but considerable net fractions reported tightening standards later in the year.
The competition that led to an easing of lending terms in the C&I loan market also appears to have influenced CRE lending. In the January 2007 BLPS, a large share of respondents indicated that they had eased lending terms on CRE loans over the past twelve months, in particular by reducing the spread of loan rates over their cost of funds. More-aggressive competition from other banks or nonbank lenders was frequently cited as a somewhat important or very important reason for easing lending terms. The increased competition may in part reflect further growth in the market for commercial-mortgage-backed securities, which has increased the number of investors participating in the commercial mortgage market. Some banks reported tightening terms on CRE loans during 2006; these institutions often cited concern about the general economic outlook or about the CRE market in general as reasons for tightening terms.
Loans to Households
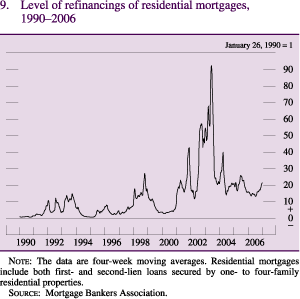
Rising mortgage rates and a slowing housing market had a marked effect on bank lending to households last year. The higher level of mortgage rates in 2006 pushed down residential mortgage originations and refinancing activity, although there was a bit of a rebound in refinancing at the end of the year as mortgage rates came off their midyear peaks ( figure 9 ). The value of residential mortgage loans on banks' books expanded 15 percent last year. This increase, however, was due partly to the incorporation of assets previously held by nonbanks into the commercial banking sector as a result of a consolidation within a large holding company of some thrift subsidiaries with a commercial bank subsidiary. Apart from the effect of this consolidation, residential real estate loans on banks' books expanded 7 percent in 2006, a further step-down from the rapid growth earlier in the decade and a pace more reflective of the slowing housing market.
A slowdown in home equity loan growth in 2006 was particularly notable. After an adjustment for the effect of the consolidation of thrift assets, home equity loans expanded just 5 percent, a marked decrease from the rapid pace of the early part of the decade. Because interest rates on home equity loans are often tied to other short-term interest rates, the increase in these rates during 2006 likely contributed to the deceleration.
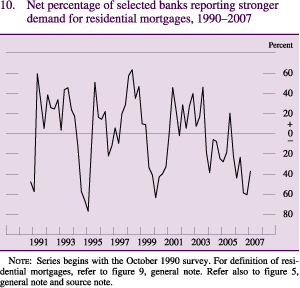
The slowdown in residential real estate lending was mirrored by reports of decreased demand for residential real estate loans in the BLPS ( figure 10 ). 6 In each of the surveys conducted during 2006, considerable net shares of respondents reported reduced demand for such loans over the preceding three months. Terms on residential real estate loans were reportedly eased a bit, on net, during the middle of the year as mortgage rates peaked, but they were tightened again toward the end of the year, when mortgage rates reversed a portion of their earlier rise.
During the past few years, financial institutions introduced a variety of nontraditional mortgage products, and more mortgages were made to subprime borrowers. The July 2006 BLPS contained several questions about the importance of these mortgage products for commercial banks. 7 According to the responses, commercial banks generally appear not to have been involved significantly in making nontraditional and subprime mortgages. About 45 percent of banks indicated that less than 5 percent of their mortgage holdings were nontraditional loans. About half the respondents did not answer the questions on subprime lending; the nonresponse suggests that they are not engaged in this type of lending. In addition, about 70 percent of those that did respond indicated that subprime loans accounted for less than 5 percent of loans on their books. Some banks, however, did report that these products were a significant part of their residential real estate portfolios. About one-fifth of the respondents indicated that nontraditional mortgages accounted for more than 20 percent of the residential mortgages on their books. One-tenth of banks responding to the subprime loan questions indicated that these loans accounted for more than 20 percent of the residential mortgages loans on their books. A few banks reported that they had tightened their price-related terms for both nontraditional and subprime mortgages during the previous year, for instance, by increasing fees or widening the spreads over the bank's cost of funds. 8
Consumer lending at banks expanded 6.3 percent in 2006, up from 2.2 percent in 2005. Credit card loans, which account for slightly less than half of consumer loans, rose at banks of all sizes. By contrast, growth in other consumer lending was confined to the ten largest banks. Consumer lending may have been restrained in recent years as homeowners withdrew equity from their houses to finance purchases. The rebound in consumer lending in 2006 may reflect in part a decline in this substitution as rising mortgage rates and slower home-price appreciation made the use of home equity less attractive.
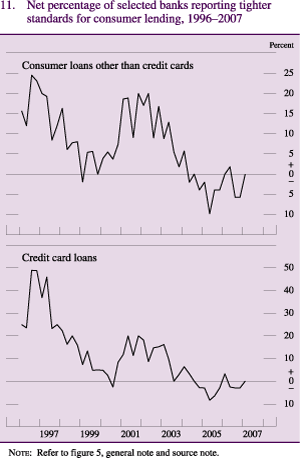
The expansion in consumer lending occurred despite repeated reports of weaker demand for such loans by BLPS respondents. On average last year, a net fraction of around one-third of respondents indicated that consumer loan demand had weakened. Standards for approving consumer loans were reportedly not much changed on net during 2006 ( figure 11 ). Most lending terms also did not change much; however, a sizable fraction of banks indicated that they had increased the minimum percentage of outstanding credit card balances that they required to be repaid each month.
Other Loans and Leases
Other loans and leases grew a modest 3 percent during 2006. Loans to purchase or carry securities, which are relatively volatile, expanded 25 percent. As in 2005, the fiscal position of many state and local governments was supported by rising incomes and property valuations; nevertheless, lending to these entities grew robustly in 2006, possibly to finance a pickup in construction-related expenditures. Agricultural loans expanded at a pace roughly in line with that of the preceding two years; loans in most farm loan categories continued to rise. 9 Growth in the remaining components of other loans, such as lease financing receivables and loans and leases to depository institutions, which account for around half of the total, was about flat or declined last year. 10
Securities
Banks expanded their securities holdings a robust 11.5 percent last year. Growth was particularly rapid for securities held in banks' trading accounts, which can fluctuate considerably year to year; the rise reflected increased holdings of a wide variety of security types.
Holdings of securities in banks' investment accounts grew at a more moderate rate of 6.9 percent. Banks' accumulation of mortgage-backed securities in their investment accounts picked up in 2006 from its slow pace in 2005. By contrast, holdings of Treasury securities and of securities issued by state and local governments declined.
Liabilities
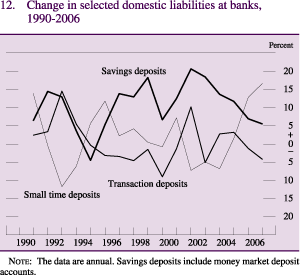
Bank liabilities increased 12.1 percent in 2006, an advance about in line with bank assets. Core deposits grew only 5.8 percent, the slowest rate since 1999. Transaction deposits contracted for the second consecutive year, and the rate of expansion of savings deposits slowed ( figure 12 ). By contrast, small time deposits grew 17 percent, their largest advance since 1989. Interest rates on liquid deposits, which include both transaction and savings deposits, tend to move sluggishly, so rising market rates increase the opportunity cost of holding these deposits and restrain their growth; interest rates on small time deposits generally track market rates closely, and as short-term rates rose, the attractiveness of these deposits relative to liquid deposits increased. Core deposits are generally a more important funding source for smaller banks than larger institutions, and the growth rate of core deposits at banks outside the 100 largest was 8.2 percent last year, noticeably faster than at larger banks.
The expansion of managed liabilities moved up to 19.5 percent, the fastest pace in more than a decade, and growth was especially strong at the 10 largest banks. These funding sources now account for 44 percent of the liabilities of all banks, the largest share in the past two decades. The rapid growth in managed liabilities was supported by the expansion of deposits booked in foreign offices, the largest component of managed liabilities. Large time deposits, the next largest component of managed liabilities, also grew at a solid rate. 11
Capital
Banks' capital expanded a rapid 14.7 percent in 2006, nearly double the rate of growth in 2005. There was a sizable expansion in goodwill as the result of merger and consolidation activity involving some large banks. Retained earnings continued to be strong and also added notably to capital. As in previous years, banks' capital was also boosted by funding from parent holding companies and shares issued to the public.
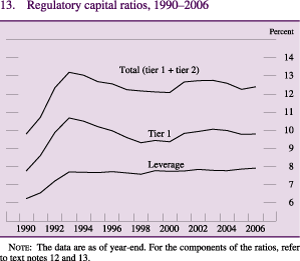
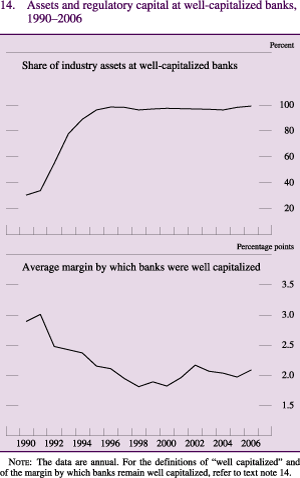
Regulatory capital expanded smartly last year. Tier 1 capital grew 11.8 percent, and tier 2 capital increased 17.1 percent. 12 Risk-weighted assets expanded 11.6 percent, a touch slower than total assets. The difference is due, in part, to the slightly more rapid growth in assets having relatively lower risk weights, such as mortgage-backed securities and first-lien residential mortgages. As a result, banks' tier 1 and total capital ratios ended the year higher than in 2005 ( figure 13 ). The leverage ratio, which is based on tangible average assets, also edged higher. 13 The share of assets held at well-capitalized banks was above 99 percent in 2006, and the average margin by which banks remained well capitalized moved up some after having slipped a bit over the preceding few years ( figure 14 ). 14
Derivatives
The notional principal value of derivative contracts held by banks rose 30 percent last year, surpassing $130 trillion ( table 2 ). Even though the notional value of derivative contracts grew at banks of all sizes, the share of industry contracts accounted for by the 10 largest banks has continued to edge higher and is now above 98 percent. The share of contracts at the largest banks likely reflects their role as dealers in derivatives markets. As dealers, these banks often enter into offsetting positions, which significantly boost the notional value of their derivative contracts. The fair market value of derivative contracts held by banks, which reflects their replacement cost, is far smaller than the notional principal amount. The fair market value of contracts with a positive value in 2006 was about $1.2 trillion. This value edged down for the second consecutive year. The fair market value of contracts with a negative value, which was also roughly $1.2 trillion in 2006, slipped lower as well. 15
| Item | 2001 | 2002 | 2003 | 2004 | 2005 | 2006 | Memo Dec. 2006 (billions of dollars) |
|---|---|---|---|---|---|---|---|
| Total derivatives | |||||||
| Notional amount | 11.47 | 24.14 | 26.54 | 23.69 | 15.38 | 29.75 | 132,145 |
| Fair value | |||||||
| Positive | 26.42 | 85.41 | .36 | 13.71 | -6.46 | -4.52 | 1,205 |
| Negative | 20.82 | 89.18 | 1.00 | 13.75 | -5.78 | -4.29 | 1,193 |
| Interest rate derivatives | |||||||
| Notional amount | 15.93 | 26.83 | 27.62 | 22.07 | 11.92 | 27.10 | 107,399 |
| Fair value | |||||||
| Positive | 63.87 | 108.20 | -5.95 | 13.14 | -5.52 | -14.55 | 839 |
| Negative | 56.55 | 113.02 | -5.07 | 12.94 | -5.15 | -15.06 | 816 |
| Exchange rate derivatives | |||||||
| Notional amount | -7.00 | 7.34 | 18.81 | 21.03 | 7.69 | 29.27 | 12,564 |
| Fair value | |||||||
| Positive | -16.21 | 8.67 | 41.81 | 14.86 | -35.84 | 22.68 | 180 |
| Negative | -15.65 | 15.73 | 38.81 | 12.74 | -37.36 | 21.21 | 175 |
| Credit derivatives | |||||||
| Notional amount | -1.20 | 52.47 | 55.98 | 134.52 | 148.09 | 54.92 | 9,019 |
| Guarantor | 21.84 | 38.57 | 61.82 | 139.07 | 137.87 | 67.69 | 4,496 |
| Beneficiary | -16.89 | 66.36 | 51.13 | 130.46 | 157.53 | 44.02 | 4,523 |
| Fair value | |||||||
| Guarantor | n.a. | n.a. | 68.31 | 69.92 | 81.43 | 92.95 | 69 |
| Positive | n.a. | n.a. | 378.09 | 74.56 | -5.62 | 201.36 | 50 |
| Negative | n.a. | n.a. | -68.87 | 38.37 | 827.98 | -1.59 | 19 |
| Beneficiary | n.a. | n.a. | 19.85 | 51.28 | 83.50 | 90.25 | 78 |
| Positive | n.a. | n.a. | -63.13 | 2.64 | 505.51 | 3.96 | 23 |
| Negative | n.a. | n.a. | 295.74 | 66.36 | 2.79 | 187.44 | 55 |
| Other derivatives 1 | |||||||
| Notional amount | -12.06 | 6.70 | 3.77 | 32.66 | 29.43 | 75.17 | 3,163 |
| Fair value | |||||||
| Positive | -34.72 | 20.28 | 3.16 | 8.55 | 58.51 | 18.99 | 113 |
| Negative | -42.63 | 24.62 | -5.25 | 19.73 | 74.29 | 24.15 | 128 |
Data are from year-end to year-end and are as of April 13, 2007.
1. Other derivatives consist of equity and commodity derivatives and other contracts.
Return to table
n.a. Not available.
One important way for banks to hedge interest rate risk, including that related to interest-sensitive assets such as mortgages and mortgage-backed securities, is through the use of interest rate swaps. 16 These swaps are the most common type of derivative that banks use, and they account for around 60 percent of the notional value of banks' derivative contracts. The notional value of these derivatives increased 26 percent in 2006, a rate of expansion about in line with the average pace over the past decade. The solid growth in the notional value of these instruments likely reflects the overall growth of the derivatives market and the role that some of the largest banks play as dealers in that market. In addition to swaps, banks employ other types of interest rate derivative contracts, such as futures, forwards, and options contracts, although not nearly to the same extent. The notional value of these derivative contracts also expanded at a brisk rate last year. Despite the increase in different types of interest rate derivative contracts, even faster growth in the use of other derivative contracts pushed the proportion of total derivative contracts accounted for by interest rate derivatives down 2 percentage points, to 81 percent.
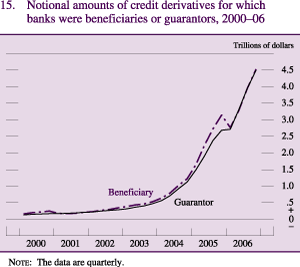
One of the fastest growing components of banks' derivative portfolios in recent years has been credit derivatives. The notional value of such derivatives at banks jumped 55 percent, but this increase was only about one-third of that registered in 2005. However, the fair market value of such contracts increased 90 percent in 2006, a somewhat faster pace than in 2005. The 10 largest banks held more than 99 percent of the notional value of all the industry's credit derivative contracts at the end of 2006. As dealers, these banks buy and sell contracts, an activity that makes them, respectively, beneficiaries of credit protection or providers of protection (also referred to as guarantors). Typically, banks are net beneficiaries of protection and generally were again in 2006. However, the difference at year-end between the $4.52 trillion in contracts for which they were beneficiaries of protection and the $4.50 trillion in contracts for which they were the guarantors of protection was considerably smaller than it was at the end of 2005 ( figure 15 ).
Banks also use derivatives related to foreign exchange, equities, and commodities. Collectively, however, these instruments account for only 12 percent of the notional value of the derivative contracts held by banks. The notional value of banks' foreign-exchange-related contracts grew 29 percent in 2006; much of the increase was due to a rise in the notional value of options contracts. Banks' notional holdings of equity and commodity derivatives surged 75 percent in 2006, a jump influenced importantly by one institution that has continued to expand rapidly its trading of commodity derivatives.
Trends in Profitability
The profitability of the commercial banking industry remained quite strong in 2006. Although mergers boosted the goodwill component of reported equity again in 2006, return on equity (ROE) moved up to 13.67 percent last year, a level well within the high range that has prevailed since the mid-1990s. 17 Banks' return on assets (ROA) increased to 1.39 percent, matching the peak annual level reached in 2003. Last year's rise in both ROE and ROA can be traced to large banks and to those specializing in credit card loans; these two broad measures of profitability declined modestly for other banks. 18 The fraction of banks that incurred losses rose for the second year in a row, to 7.4 percent, but such banks accounted for just under 0.5 percent of industry assets, the lowest share on record.
The flattening of the yield curve and ongoing competitive pricing pressure, particularly in the C&I loan and deposit markets, reportedly caused the industry net interest margin to edge lower last year. The decline was concentrated at the ten largest banks, for whom pricing competition may be especially intense; banks of other sizes experienced stable net interest margins, and those specializing in credit card loans saw a sizable increase in margins. Non-interest income grew briskly last year and as a share of total revenue was the second highest in more than two decades. A surge in trading revenue and in income related to investment banking activity at the ten largest banks and a sharp rise in income related to securitization at large banks drove the increase in non-interest income. Banks' investment banking activity may have been lifted by the wave of merger and acquisition activity. The continued trend decline in the ratio of non-interest expense to total revenue also contributed to profitability. Profits were boosted in the fourth quarter by a rise in extraordinary items because of an asset trade between two large banks. This event is estimated to have boosted industry ROA 2 basis points for 2006 as a whole.
Asset quality generally remained solid in 2006, a factor that helped buoy bank profits. The health of business and household balance sheets was supported by continued economic growth, hefty corporate profits, and increases in household wealth stemming from gains in equity prices. Indeed, the delinquency rate on all loans and leases averaged 1.57 percent again last year. However, some pockets of distress in the real estate sector became evident in the second half of 2006, when the overall delinquency rate rose 18 basis points, reaching 1.69 percent by year-end. Banks continued to provision for losses at about the same low average rate as a share of assets as in 2005, providing support for profits. On a quarterly basis, banks increased their provisioning moderately toward the end of the year.
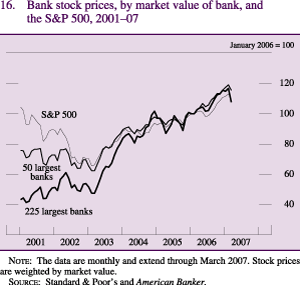
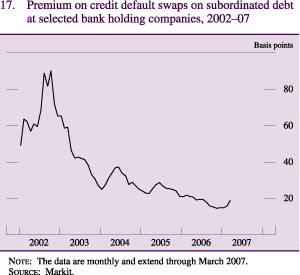
Supported by strong profitability, the growth of dividend payments surged in 2006. The share of profits paid out as dividends increased several percentage points last year, and, as a result, retained earnings expanded only a bit. Nevertheless, retained earnings remained high in 2006 and provided support for equity capital. Against this backdrop, the stocks of bank holding companies outperformed the robust gains posted by the S&P 500 in 2006 ( figure 16 ). Credit default swap premiums on banks' subordinated debt moved down a bit further last year from already low levels ( figure 17 ).
Interest Income and Expense
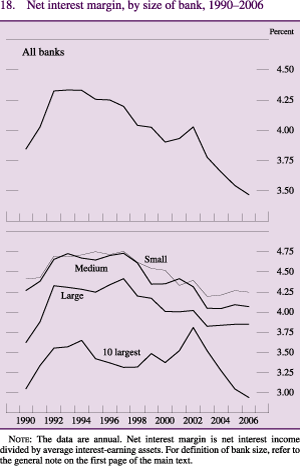
For a second year in a row, the average rates of interest earned on banks' assets and paid on banks' liabilities rose in 2006; both were lifted in part by the monetary policy tightenings in the first half of the year. However, the average rate earned increased less than the average rate paid, and the industry net interest margin narrowed 7 basis points, to 3.47 percent. Last year's decline extended the downward trend in this measure that has been evident since the mid-1990s ( figure 18 ). The industry net interest margin declined early in 2006 but widened in the fourth quarter; at year-end it stood a few basis points above its year-earlier level.
The decline in the industry net interest margin last year was driven almost entirely by a decrease of 11 basis points at the 10 largest banks; net interest margins for banks outside the 10 largest, by contrast, remained about flat. At the 10 largest banks, however, the share of interest-earning assets rose to its highest level since 1993, and the return on such assets increased 96 basis points. But the ratio of interest-bearing liabilities to interest-earning assets reached another record high, likely a reflection of these banks' increased reliance on managed liabilities (noted earlier), and interest expense as a share of interest-earning assets rose 107 basis points. Still, net interest margins at the ten largest banks rose significantly in the fourth quarter; these banks registered a particularly large increase in interest income on loans that quarter. 19
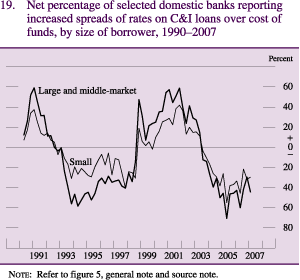
The increases in rates earned by banks last year were highest for credit card and other consumer loans. Indeed, the net interest margins of banks that specialized in credit card loans rose for the third year in a row, and the profitability of these banks moved up considerably more than for the industry as a whole. Rates earned on C&I loans increased significantly last year, but their rise was the lowest among major loan components. The increase in C&I loan rates was particularly small for the ten largest banks. As noted earlier, significant net fractions of respondents to BLPS surveys had trimmed spreads of C&I loan rates over their cost of funds last year, which likely helped to restrain the rise in these loan rates ( figure 19 ). The survey banks, which tend to be large, have reported lower C&I loan rate spreads, on balance, since the middle of 2003. Nearly all the banks that trimmed their rate spreads on C&I loans last year indicated that more-aggressive competition from other banks or nonbank lenders was the most important reason for having done so.
The average rates that banks paid on deposits rose in 2006 by the largest amount in more than 15 years, putting downward pressure on net interest margins. Growth of generally lower-cost core deposits was down last year from 2005. By contrast, the growth of managed liabilities surged in 2006, lifting the share of these higher-cost liabilities in total interest-bearing liabilities to a five-year high.
The downward pressure on banks' net interest margins last year was partially offset by higher returns on assets funded with non-interest-bearing liabilities and capital. 20 Because these instruments, by definition, have no explicit interest expense, the level of the return on bank assets, which rose significantly last year--rather than the spread between the average rates earned on assets and those paid on liabilities, which declined last year--helped to buoy banks' net interest margins. However, after holding about steady in 2005, the share of interest-earning assets funded by non-interest-bearing instruments declined somewhat last year because of a considerably smaller increase in non-interest-bearing savings deposits.
Non-interest Income and Expense
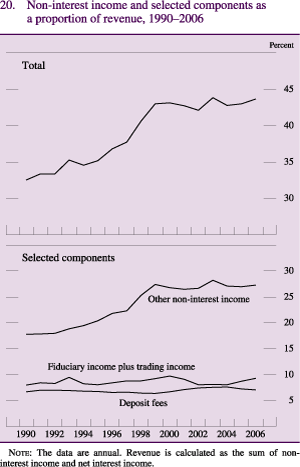
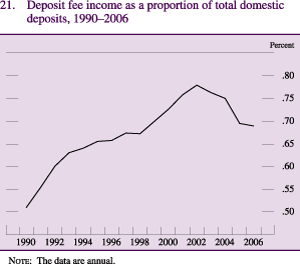
Non-interest income grew briskly in 2006--its 11 percent rise was the highest in 7 years. The share of total revenue accounted for by non-interest income climbed to almost 44 percent last year, the high end of its range this decade ( figure 20 ). The rise in this share was nearly fully accounted for by a surge in trading revenue, which is highly concentrated at the ten largest banks. Increases in equity- and foreign-exchange-related trading income drove the pickup in industry trading revenue. The rise in equity-related trading income coincided with broad gains in share prices last year. In addition, after notable growth in 2005, industry trading revenue associated with interest rate and commodity exposures rose further in 2006, perhaps because of banks' expanding derivatives activities. Although growth in both fiduciary and deposit fee income picked up relative to 2005, each declined slightly as a share of total revenue. Despite the higher growth in deposit fee income, it was again exceeded by the expansion in deposits, and the ratio of deposit fees to deposits moved down for the fourth straight year ( figure 21 ).
Taken together, the other components of non-interest income rose about in line with industry revenue last year. Income related to securitization and investment banking activity grew briskly. The considerable amount of merger and acquisition activity and relatively hefty volume of corporate bond issuance last year likely fueled, at least in part, the pickup in banks' income related to investment banking activity.
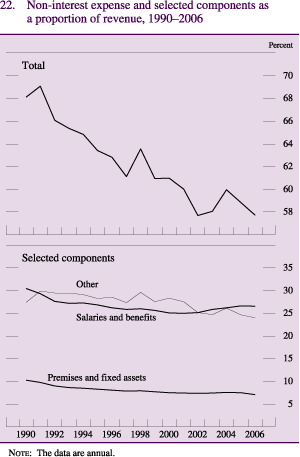
Although the rate of growth in non-interest expense in 2006 was somewhat higher than its historical average, non-interest expense as a share of total revenue moved lower, boosting banks' profitability ( figure 22 ). Brisk growth in salaries and benefits costs accounted for most of last year's increase in non-interest expense, but the share of industry revenue accounted for by salaries and benefits held about steady after rising in each of the previous four years. The number of bank employees rose a bit faster than its average rate of the past several years, and pay per employee moved up. Expenses associated with banks' premises grew at a relatively slow rate, and they declined as a share of total revenue. Other components of non-interest income also grew at a slower pace than total revenue.
Loan Performance and Loss Provisioning
Overall credit quality generally remained solid last year, although delinquency rates for some loan categories may have bottomed out around the middle of last year. Delinquency rates on both residential and commercial real estate loans turned up noticeably in the second half of the year--especially in the fourth quarter--albeit from very low levels. By contrast, delinquency rates on C&I loans declined last year, and those on consumer loans moved up only a little. Charge-off rates on all loans and leases declined further, reaching their low point in the fourth quarter of the year. Meanwhile, banks provisioned for losses at a relatively low rate, although provisioning rose a bit late in the year. In the January 2007 BLPS, banks reported that they expected a deterioration in the quality of their loans to both businesses and households during the year, a judgment based on the assumption that economic activity progresses in line with consensus forecasts. The net fraction of banks that anticipated deterioration this year was notably higher than in the year-earlier survey.
C&I Loans
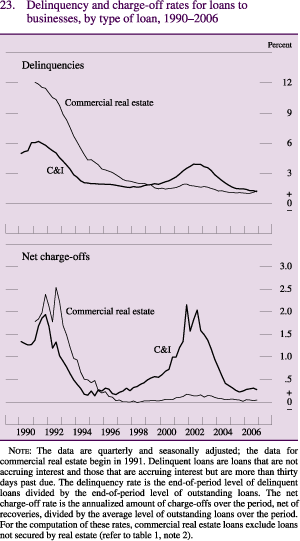
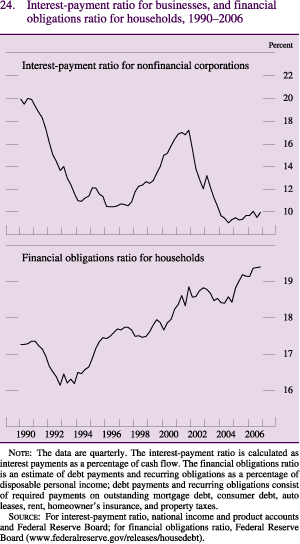
The credit quality of banks' C&I loan portfolios improved further in 2006. The delinquency rate on C&I loans drifted lower for the fourth straight year and dropped below 1.2 percent in the fourth quarter, the lowest level in more than 15 years ( figure 23 ). The decline was concentrated at the 100 largest banks, but the rest of the industry registered an improvement in C&I loan quality as well. The continued high credit quality of C&I loans likely reflected generally healthy corporate balance sheets--the interest-payment ratio for nonfinancial corporations remained quite modest last year ( figure 24 )--and a very low incidence of corporate default. Moreover, the rapid growth in C&I loans over the past two years may have temporarily reduced delinquency rates because loans are presumably less likely to become delinquent soon after they are extended. Although the net charge-off rate on C&I loans edged up a couple of basis points last year on a quarterly average basis, it remained exceptionally low.
Commercial Real Estate Loans
The credit quality of commercial real estate loans generally remained strong in 2006, although it appeared to deteriorate some in the second half of the year. As noted earlier, fundamentals in the sector continued to improve last year--commercial property values and rents rose, vacancy rates in both the office and industrial sectors continued to drift down, and the vacancy rate for retail buildings remained low. Accordingly, both delinquency and net charge-off rates on commercial real estate loans generally remained around historically low levels. Delinquency rates drifted lower during the first half of last year, but they rose noticeably over the second half at banks of all sizes. The upturn was concentrated in loans for construction and land development, a category of funding that includes loans to residential real estate developers. By contrast, net charge-offs on commercial real estate loans held about steady at a low level over the four quarters of last year. In credit markets, spreads on commercial-mortgage-backed securities widened a bit, on average, in 2006 but remained relatively narrow.
Loans to Households
Even though bank-intermediated household debt grew more slowly in 2006 than in 2005, household credit quality deteriorated somewhat on balance last year--higher interest rates increased households' debt service payments further and lifted their financial obligations ratio to an all-time high. After holding steady for several quarters, the delinquency rate on residential real estate loans climbed in the second half of 2006, reaching 1.9 percent in the fourth quarter ( figure 25 ). Although the fourth-quarter rate was a multiyear high, it was well below the rates seen in the early 1990s. The rise in delinquencies on residential real estate loans in the second half of last year was widespread: Delinquency rates rose for mortgages on one- to four-family residences and on revolving home equity loans, and they rose at banks of all sizes. Last year's increase may have been, at least in part, the result of higher variable-rate mortgage rates, on balance, and a slowing in home-price appreciation in the second half of the year, a combination of factors that likely put pressure on households with variable-rate mortgages. Indeed, broad measures of delinquency rates on variable-rate subprime mortgages moved up considerably last year. (For further discussion, refer to box "Credit Quality of Subprime Residential Mortgages." ) Net charge-off rates on residential real estate loans edged higher in 2006 but remained at very low levels. Charge-off rates on one- to four-family residential mortgages ticked down over the first half of the year, but they increased over the second half when gains in homeowners' equity cooled.
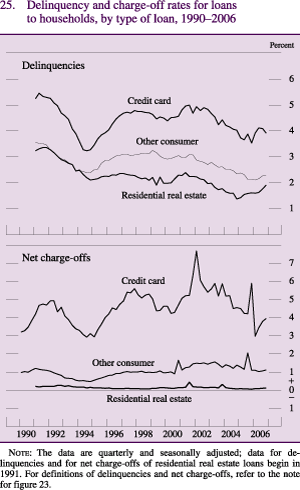
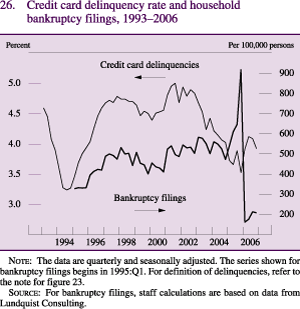
The rate of household bankruptcy filings plunged in the wake of the bankruptcy reform law that took effect in October 2005, and a markedly lower rate of bankruptcy prevailed in 2006 ( figure 26 ). 21 Nonetheless, the delinquency rate on credit card loans rose, on average, last year. The increase occurred in the first half of the year--credit card delinquencies receded in the second half but ended the year at 3.9 percent, somewhat above their year-earlier level. By contrast, the net charge-off rate on credit card loans on banks' books fell significantly last year relative to 2005, even after excluding the large fluctuation in charge-offs caused by the new bankruptcy law. 22 Last year's decline continued the downward trend in credit card charge-offs that has been evident, on balance, for the past few years.
Banks were queried about the effects of the bankruptcy reform legislation on their lending policies for credit card loans to individuals and households in the January 2007 BLPS survey. Nearly all domestic institutions indicated no change in their lending policies for these credit card loans in response to the bankruptcy reform; only two reported that they had tightened credit standards for approving credit card loan applications. In addition, about one-fourth stated that, after accounting for changes in their lending standards and terms, they anticipated that charge-offs on their credit card loans would be lower in the long term because of the reform.
In the April 2006 BLPS, banks were queried about their minimum required payment on credit card balances for individuals and households. One-third of respondents, on net, had increased their required minimum payment over the previous year. 23 Despite concerns raised by some industry commentators regarding the effects of higher minimum payments on defaults and loan losses, these increases do not appear to have had a significant effect on such measures.
The delinquency rate on other consumer loans edged lower, on average, in 2006, and charge-off rates on such loans stepped down significantly. On a quarterly basis, however, delinquency and charge-off rates on other consumer loans rose in the second half of last year; their levels at year-end were above those registered early in the year.
Credit Quality of Subprime Residential Mortgages
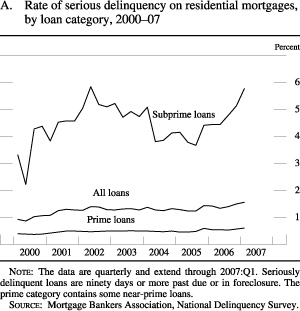
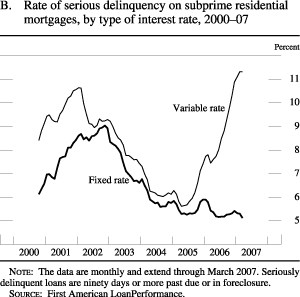
Serious delinquency rates on residential mortgages--that is, the fraction of loans that are ninety days or more past due or are in foreclosure--have moved higher, on balance, since mid-2005. This rise is largely accounted for by a sharp increase in the delinquency rate on subprime residential mortgages ( figure A ). 1 By contrast, delinquency rates on prime residential mortgages, which make up the majority of outstanding residential loans, have remained fairly low and stable over this period. The deterioration in the subprime sector has been concentrated among borrowers whose mortgages have variable interest rates; serious delinquency rates on subprime fixed-rate mortgages have barely budged, on net ( figure B ). Amid slowing house-price appreciation and rising interest rates, one would expect residential mortgage defaults to rise because borrowers have slimmer equity cushions with which to buffer increases in their mortgage payments or other sources of financial stress. However, adjustable-rate subprime loans originated in 2006 have also been plagued by so-called "early payment defaults," in which the borrower defaults well before their mortgage payment resets.
In June 2007, the federal financial regulatory agencies issued a "Statement on Subprime Mortgage Lending" to address issues relating to certain adjustable-rate mortgage products that can cause payment shock. 2 The statement described the prudent safety and soundness and consumer protection practices that institutions should follow to ensure borrowers obtain loans that they can afford to repay. The safety and soundness practices included loan underwriting based on both principal and interest obligations at the fully indexed rate with a fully amortizing repayment schedule, plus a reasonable estimate for real estate taxes and insurance. The statement also cautioned about risk-layering features. The consumer protection practices included clear and balanced product disclosures to customers and limits on prepayment penalties that allow for a reasonable period of time for customers to refinance before the expiration of the initial fixed interest rate period without penalty.
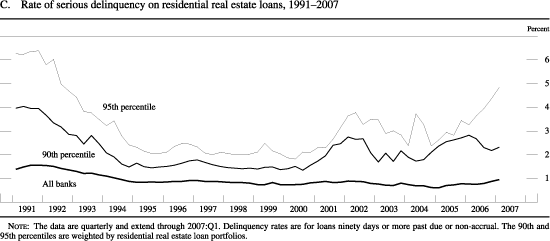
Available evidence suggests that commercial bank exposure to troubled subprime mortgages is generally small. Delinquency rates on all residential mortgage loans on banks' books have risen a bit since mid-2005, but these rates have remained relatively low. Disaggregating these delinquency rates reveals that the increase in such rates has occurred at banks that held a fairly small portion of all residential mortgage loans ( figure C ). Banks that responded to the special questions in the July 2006 Senior Loan Officer Opinion Survey on Bank Lending Practices reported that their holdings of subprime mortgages were generally small--just 3 of the 56 banks surveyed indicated that their holdings of subprime mortgages accounted for more than 20 percent of all residential mortgages on their books at that time. And although the dollar amount of foreclosed residential properties on banks' books rose to $2.5 billion at the end of 2006, compared with a level of around $1.5 billion at the end of both 2005 and 2004, such assets accounted for less than 0.2 percent of all outstanding residential real estate loans. 3 Finally, banks may be exposed to subprime mortgages through their holdings of mortgage-backed securities, but these holdings are largely backed by the U.S. government or by government-sponsored enterprises.
The credit quality of residential mortgages is significantly lower in some areas of the U.S. than in the nation as a whole. According to the Mortgage Bankers Association, the share of residential loans of all types in foreclosure in the first quarter of 2007 was highest in Ohio, Indiana, and Michigan--states that have been particularly hard-hit by recent troubles in the auto industry. Foreclosures were also relatively high in Louisiana and in Mississippi early this year, states where losses related to Hurricanes Katrina and Rita have been significant. Banks that experienced losses in 2006 were not particularly concentrated in these states, but the average return on assets of banks located in these states was lower than that for the industry as a whole last year.
1. The subprime category of residential mortgages typically includes loans made to borrowers who
had one or more of the following characteristics at the time the loans
were originated: weakened credit histories that include payment
delinquencies, charge-offs, judgments, or bankruptcies; reduced
repayment capacity as measured by credit scores or debt-to-income
ratios; or incomplete credit histories. The prime category of
residential mortgages includes loans made to borrowers who typically
had relatively strong, well-documented credit histories; relatively
high credit scores; and relatively low debt-to-income ratios at the
time the loans were originated.
Return to text
2. For more information, refer to the Board of Governors of the Federal Reserve
System, Federal Deposit Insurance Corporation, National Credit Union
Administration, Office of the Comptroller of the Currency, and Office
of Thrift Supervision (2007), "
Federal Financial Regulatory Agencies
Issue Final Statement on Subprime Mortgage Lending,
" press release,
June 29.
Return to text
3. These figures are based on the sum of two
components of other real estate owned reported on the Call Reports:
"1-4 family residential properties in domestic offices" and
"foreclosed properties from \`GNMA (Government National Mortgage
Association) loans.'" Excluding the GNMA item, which was
added to the Call Reports in March 2006, the total for year-end 2006
was $1.7 billion, up from an average of $1.5 billion at year-end
for both 2005 and 2004.
Return to text
Securitized Loans
After declining in 2005, the delinquency rates on many types of securitized loans registered mixed changes last year but remained relatively low. Although the average delinquency rate on securitized residential mortgages was unchanged relative to 2005, it dipped markedly in the first quarter of 2006 and then increased steadily over the remainder of the year: At year-end 2006, this rate stood 50 basis points higher than its year-end 2005 level, but that was still below the year-end levels of the previous several years. For the third year in a row, the delinquency rate on securitized home equity loans moved up. By contrast, the delinquency rate on securitized credit card receivables continued its multiyear decline in 2006, although the decrease was much smaller than in previous years.
Loss Provisioning
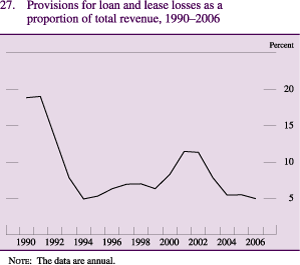
With credit quality generally remaining strong in 2006, banks continued to provision for loan losses at about the same average rate as in 2005. 24 Measured as a share of average net consolidated assets or as a proportion of total revenue, banks' provisioning for loan and lease losses declined a couple of basis points last year ( figure 27 ). By either measure, the rate of provisioning continued to be in the low end of the range seen over the past two decades. On a quarterly basis, banks' provisioning was moderately higher in the fourth quarter of last year relative to the first three quarters, a reflection of a rise in provisioning by the ten largest banks and by small banks. Although banks that specialize in credit card loans provisioned less as a share of average assets last year than in 2005, their provisioning rose significantly in the fourth quarter.
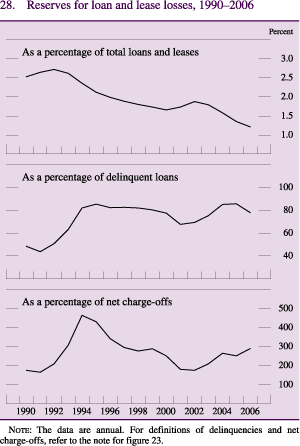
Provisioning outpaced charge-offs in 2006, so that loan-loss reserves increased in dollar terms, but the ratio of loss reserves to total loans and leases declined further ( figure 28 ). However, the ratio of reserves to delinquent loans remained near the high end of its range of the past two decades. Reserves as a share of net charge-offs increased in 2006--as it has in three out of the past four years--and stood near its highest level of the past decade.
International Operations of U.S. Commercial Banks
The share of assets of U.S. banks booked in foreign offices increased 115 basis points, to 12.9 percent, in 2006. Rapid growth in banks' lending and derivatives activities with Asian economies lifted U.S. institutions' total exposure to such countries as a share of tier 1 capital to nearly 35 percent ( table 3 ). 25 By this measure, banks' exposure to China tripled over the past three years, but it remained below their exposure to India and well below that to Korea. Banks' exposure to Latin American and Caribbean economies surged in terms of dollars, but it edged down as a share of tier 1 capital.
| Bank size and year | Asia | Latin America and the Caribbean | Eastern Europe |
Total exposure to developing economies |
|||||
|---|---|---|---|---|---|---|---|---|---|
| All | China | India | Korea | All | Mexico | Brazil | |||
| 1997 | 25.4 | 1.0 | 1.5 | 7.4 | 29.7 | 5.5 | 9.7 | 3.5 | 77.9 |
| 1998 | 28.2 | 1.0 | 2.4 | 7.1 | 42.9 | 9.9 | 11.3 | 3.5 | 100.1 |
| 1999 | 26.1 | .8 | 2.4 | 6.6 | 39.0 | 9.5 | 10.5 | 2.9 | 90.7 |
| 2000 | 24.0 | .8 | 2.6 | 6.4 | 37.9 | 9.1 | 11.2 | 4.4 | 87.9 |
| 2001 | 22.4 | .9 | 2.6 | 5.8 | 54.1 | 26.0 | 3.0 | 4.3 | 100.3 |
| 2002 | 21.9 | .9 | 2.7 | 5.8 | 38.9 | 20.8 | 8.4 | 5.5 | 84.8 |
| 2003 | 22.8 | 1.3 | 3.9 | 5.5 | 32.9 | 18.0 | 6.8 | 5.4 | 79.8 |
| 2004 | 32.2 | 1.4 | 4.2 | 15.0 | 31.8 | 16.7 | 6.5 | 6.1 | 89.2 |
| 2005 | 30.7 | 2.4 | 4.9 | 12.9 | 31.8 | 17.4 | 6.9 | 5.9 | 86.4 |
| 2006 | 34.7 | 4.1 | 6.1 | 13.6 | 30.8 | 16.9 | 5.7 | 6.5 | 92.6 |
| Memo | |||||||||
| Total exposure (billions of dollars) | |||||||||
| 1997 | 87.1 | 3.5 | 5.1 | 25.3 | 101.7 | 18.8 | 33.4 | 11.9 | 267.1 |
| 1998 | 69.1 | 2.3 | 5.4 | 17.3 | 104.7 | 24.2 | 27.6 | 8.5 | 244.7 |
| 1999 | 67.9 | 2.0 | 6.2 | 17.2 | 101.6 | 24.8 | 27.3 | 7.4 | 236.4 |
| 2000 | 68.0 | 2.2 | 7.5 | 18.1 | 107.3 | 25.7 | 31.6 | 12.3 | 249.1 |
| 2001 | 67.2 | 2.7 | 7.7 | 17.5 | 162.4 | 78.0 | 39.0 | 12.9 | 301.4 |
| 2002 | 69.5 | 2.7 | 8.7 | 18.4 | 123.5 | 66.2 | 26.6 | 17.6 | 269.4 |
| 2003 | 79.9 | 4.4 | 13.6 | 19.2 | 115.2 | 63.0 | 23.7 | 19.1 | 280.1 |
| 2004 | 125.8 | 5.3 | 16.3 | 58.7 | 124.4 | 65.2 | 25.5 | 23.8 | 348.9 |
| 2005 | 134.8 | 10.4 | 21.6 | 56.7 | 139.7 | 76.1 | 30.4 | 25.7 | 378.8 |
| 2006 | 190.5 | 22.7 | 33.6 | 74.8 | 168.9 | 92.5 | 31.5 | 35.5 | 508.2 |
Note:
Exposures consist of lending and derivatives exposures for cross-border and local office operations. Respondents may file information on one bank or on the bank holding company as a whole. For the definition of tier 1 capital, see text
note 12
.
The year-end 2006 data cover 66 banks with a total of $549.0 billion in tier 1 capital.
Source:
Federal Financial Institutions Examination Council (2007), Statistical Release E.16, Country Exposure Lending Survey (March 30),
http://www.ffiec.gov/E16.htm
.
Developments in Early 2007
U.S. economic activity slowed in the first three months of 2007. Growth in business expenditures stepped down somewhat relative to 2006--spending on fixed investment accelerated, but inventory investment slowed. Although merger and acquisition activity reportedly stayed elevated, corporate profits remained strong, and firms reduced their demand for external financing. Consumer spending picked up, and job growth continued at a solid pace through the first quarter of 2007. However, the financial condition of some households deteriorated as terms reset on variable-rate subprime mortgages and house prices leveled out. Readings on core inflation ticked up in the first two months of the year before coming back down in March. Measures of inflation expectations posted small mixed changes--inflation expectations based on Treasury inflation-protected securities rose a bit, but longer-term survey-based measures edged lower. Against this backdrop, the Federal Open Market Committee maintained its target for the federal funds rate at its first two meetings in 2007. Intermediate-term interest rates declined somewhat over the first three months of the year, and longer-term interest rates held about steady, on balance.
In late February 2007, volatility in global financial markets jumped, and prices of risky assets dropped as investors appeared to reduce their exposure to risk. In particular, concerns about conditions in the U.S. subprime residential mortgage market and possible spillover to the broader economy grew as delinquency rates on such mortgages climbed and potentially high exposures to troubled subprime mortgages surfaced at some financial entities. By the end of the first quarter, measures of implied volatility in Treasury markets and the volatility of the S&P 500 index had retreated somewhat but remained higher than earlier in the year.
Data from the Federal Reserve show that growth of domestic banks' assets stepped down a bit in the first quarter of 2007 relative to 2006. 26 As businesses sought less external financing, C&I loan growth slowed at banks of all sizes. Aside from a sizable bank-to-thrift conversion in the first quarter, loans secured by real estate continued to expand at around the same pace as in 2006. By contrast, loans to consumers picked up a bit, consistent with the rise in consumer spending. With steady growth in core deposits in the first quarter of 2007 and the lower growth in assets, the expansion of managed liabilities dropped back.
Although the tone of first-quarter earnings reports of major bank holding companies was mixed, industry profitability generally appeared to have held up in early 2007. Several banks reported that their profitability was supported by continued strong non-interest income, such as from trading activities. Net interest income rose at some institutions; others indicated that their margins remained under pressure. Decreased demand for new mortgages and write-offs of servicing income on existing mortgages weighed on the profitability of several institutions. Credit quality reportedly generally stayed solid, but some banks noted increased losses in their mortgage portfolios.
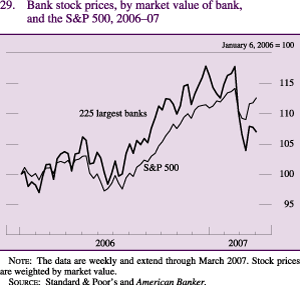
Despite banks' generally strong balance sheets and continued profitability in the first quarter of 2007, an index of the stock prices of the 225 largest banks underperformed the S&P 500 index over the period ( figure 29 ). Investors apparently became concerned about possible implications of the troubles in the subprime mortgage sector for banks' earnings. The bank stock index dropped about 10 percent in late February and early March--about twice as much as the broader market--but some of this decline later reversed in March. Credit default swap premiums on banks' subordinated debt moved higher for a time in late February; these premiums subsequently retreated some but remained above their year-end 2006 levels at the end of March. Bank mergers in the first quarter of 2007 occurred at about the same pace as in the first quarter of 2006.
Note: The data in this article cover insured domestic
commercial banks and nondeposit trust companies (hereafter, banks).
Except where otherwise indicated, the data are from the Consolidated
Reports of Condition and Income (Call Report). The Call Report consists
of two forms submitted by domestic banks to the Federal Financial
Institutions Examination Council: FFIEC 031 (for those with domestic
and foreign offices) and FFIEC 041 (for those with domestic offices
only). The data thus consolidate information from foreign and domestic
offices, and they have been adjusted to take account of mergers and the
effects of push-down accounting. For additional information on the
adjustments to the data, refer to the appendix in William B. English
and William R. Nelson (1998), "
Profits and Balance Sheet Developments
at U.S. Commercial Banks in 1997 (170 kb PDF)
,"
Federal Reserve
Bulletin, vol. 84 (June), p. 408. Size categories,
based on assets at the start of each quarter, are as follows: the 10
largest banks, large banks (those ranked 11 through 100), medium-sized
banks (those ranked 101 through 1,000), and small banks. At the start
of the fourth quarter of 2006, the approximate asset sizes of the banks
in those groups were as follows: the 10 largest banks, more than
$136.7 billion; large banks, $7.3 billion to $135.7 billion; medium-sized banks, $481 million to $7.2 billion;
and small banks, less than $480 million.
Data shown in this
article may not match data published in earlier years because of
revisions and corrections. Call Report data reflect information
available as of April 13, 2007. In the tables, components may not
sum to totals because of rounding. Appendix table A.1, A-E, reports
portfolio composition, income, and expense items, all as a percentage
of overall average net consolidated assets, for all banks and for each
of the four size categories. Appendix table A.2 reports income
statement data for all banks.
Return to text
1. In this article, consumer loans consist of loans to
households that are not secured by real estate, and they include credit
card loans.
Return to text
2. In this article, core deposits consist of transaction
deposits, savings deposits (including money market deposit accounts),
and small-denomination time deposits (those issued in denominations of
less than $100,000). Managed liabilities consist of large time deposits
booked in domestic offices, deposits booked in foreign offices,
subordinated notes and debentures, federal funds purchased and
securities sold under repurchase agreements, Federal Home Loan Bank
advances, and other borrowed money.
Return to text
3. The 50 largest bank holding companies are defined here as the
50 largest (as measured by total consolidated assets) after the
exclusion of a few institutions whose commercial banking operations
account for only a small portion of their assets and earnings. The
quarterly article in the Federal Reserve Bulletin,
"Report on the Condition of the U.S. Banking Industry," at
www.federalreserve.gov/pubs/bulletin/default.htm
, provides
information on the 50 large bank holding companies (the 50 largest as
defined here) and on the banking industry from the perspective of bank
holding companies (including financial holding companies) that file
reports FR Y-9C and FR Y-9LP; currently, only about 1,000 top-tier bank
holding companies are required to file those reports (refer to
"Report on the Condition" table 1, last row, and note 1).
Return to text
4. Financial holding company statistics include both domestic
bank holding companies that have elected to become financial holding
companies and foreign banking organizations operating in the United
States as financial holding companies and subject to the Bank Holding
Company Act. For more information, refer to the Board of Governors of
the Federal Reserve System (2003), Report to the Congress on
Financial Holding Companies under the Gramm-Leach-Bliley Act (Washington: Board of Governors, November), at
www.federalreserve.gov/pubs/reports_other.htm.
Return to text
5. The net financing gap is defined here as the difference
between capital expenditures and internally generated funds. The rise
in the financing gap at the end of 2004 is due in part to a large
dividend payout by Microsoft. The drop during 2005 generally reflects
the repatriation of profits held at foreign subsidiaries of U.S.
nonfinancial corporations, which was encouraged by temporary tax
provisions.
Return to text
6. In asking banks how demand for mortgages to purchase homes
has changed over the past three months, the BLPS instructs banks to
consider only new originations as opposed to the refinancing of
existing mortgages. However, this distinction may be difficult for
banks to make in practice.
Return to text
7. The July 2006 BLPS defined "nontraditional mortgage
products" to include, but not be limited to, adjustable-rate
mortgages with multiple payment options, interest-only mortgages, and
so-called "alt-A" products, such as mortgages with limited income
verification and mortgages secured by non-owner-occupied properties.
Respondents to that survey were instructed to exclude standard
adjustable-rate mortgages and common hybrid adjustable-rate
mortgages--those on which the interest rate is initially fixed for a
multiyear period and subsequently adjusts more frequently. Subprime
mortgages were defined as loans made to borrowers who had one or more
of the following characteristics at the time of origination: weakened
credit histories that include payment delinquencies, charge-offs,
judgments, and/or bankruptcies; reduced repayment capacity as measured
by credit scores or debt-to-income ratios; or incomplete histories.
Respondents were asked to consider only first-lien loans.
Return to text
8. In September 2006, federal banking regulators provided
guidance to financial institutions on managing the risks associated
with nontraditional mortgage products. The guidance also proposed
consumer protection practices; refer to the Office of the Comptroller
of the Currency, Board of Governors of the Federal Reserve System,
Federal Deposit Insurance Corporation, Office of Thrift Supervision,
and National Credit Union Association (2006), "Federal Financial
Regulatory Agencies Issue Final Guidance on Nontraditional Mortgage
Product Risks," press release, September 29,
www.federalreserve.gov/boarddocs/press/bcreg/2006
.
Return to text
9. Using its Survey of Terms of Bank Lending to Farmers, the
Federal Reserve estimates non-real-estate bank loans made to farmers by
purpose of the loan, such as to obtain farm equipment and machinery or
to cover operating expenses. This information is published quarterly in
the Board of Governors of the Federal Reserve System, Statistical
Release E.15, "
Agricultural Finance Databook
," section A.
Return to text
10. The decline in lending to depository institutions was due in
large part to the consolidation of subsidiaries within a large holding
company. In the absence of this consolidation, growth in this "other
loans" category would have been roughly flat.
Return to text
11. The thrift consolidation boosted the growth rates of all
types of liabilities, but the only category for which the impact was
substantial was "federal funds purchased and securities sold under
repurchase agreements."
Return to text
12. Tier 1 and tier 2 capital are regulatory measures.
Tier 1 capital consists primarily of common equity (excluding
intangible assets such as goodwill and excluding net unrealized gains
on investment account securities classified as available for sale) and
certain perpetual preferred stock. Tier 2 capital consists primarily of
subordinated debt, preferred stock not included in tier 1
capital, and loan-loss reserves up to a cap of 1.25 percent of
risk-weighted assets. Risk-weighted assets are calculated by
multiplying the amount of assets and the credit equivalent amount of
off-balance-sheet items (an estimate of the potential credit exposure
posed by the items) by the risk weight for each category. The risk
weights rise from 0 to 1 as the credit risk of the assets increases.
The tier 1 ratio is the ratio of tier 1 capital to
risk-weighted assets; the total ratio is the ratio of the sum of
tier 1 and tier 2 capital to risk-weighted assets.
Return to text
13. The leverage ratio is the ratio of tier 1 capital to
tangible assets. Tangible assets are equal to total average
consolidated assets less assets excluded from common equity in the
calculation of tier 1 capital.
Return to text
14. Well-capitalized banks are those with a total risk-based
capital ratio of 10 percent or greater, a tier 1 risk-based
ratio of 6 percent or greater, a leverage ratio of 5 percent or greater, and a composite CAMELS rating of 1 or 2. Each
letter in CAMELS stands for a key element of bank financial
condition--Capital adequacy, Asset quality, Management, Earnings,
Liquidity, and Sensitivity to market risks. The estimated average
margin by which banks were well capitalized was computed as follows:
Among the leverage, tier 1, and total capital ratios of each
well-capitalized bank, the institution's "tightest" capital ratio
is defined as the one closest to the regulatory standard for being well
capitalized. The bank's margin is then defined as the percentage point
difference between its tightest capital ratio and the corresponding
regulatory standard. The average margin among all well-capitalized
banks--the measure referred to in
figure 14
--is the weighted
average of all the individual margins; the weights are each bank's
share of the total assets of well-capitalized banks.
Return to text
15. The positive and negative fair market values of banks'
derivatives contracts are of roughly the same aggregate magnitude
because the vast majority of the activity is accounted for by a few
large dealers. The similarity in size does not mean that banks'
aggregate exposure to the market and credit risk associated with the
contracts are offsetting because, for example, the counterparties to
banks' positive- and negative-valued contracts may differ.
Return to text
16. Interest rate swaps are agreements in which two parties
contract to exchange two payment streams, one based on a floating
interest rate and one based on a fixed interest rate; the payment
streams are calculated on the basis of a specific notional principal
amount.
Return to text
17. For information on the effects of large mergers on bank
capital and profitability in 2005, refer to Elizabeth C. Klee and
Gretchen C. Weinbach (2006), "
Profits and Balance Sheet Developments
at U.S. Commercial Banks in 2005,
"
Federal Reserve
Bulletin, vol. 92.
Return to text
18. The adjustments made to the data take account of mergers
between banks but do not capture the effects of mergers between banks
and thrifts. However, the sizable thrift-to-bank consolidation in the
fourth quarter of 2006 (noted above) did not have a material impact on
aggregate industry profitability measures in 2006. For information on
the merger adjustments to the data, refer to the appendix in English
and Nelson, "
Profits and Balance Sheet Developments at U.S.
Commercial Banks in 1997
," p. 408.
Return to text
19. The fourth-quarter increase in the net interest margin at
the ten largest banks did not appear to have been driven by the sizable
thrift-to-bank consolidation that quarter.
Return to text
20. For more discussion, refer to box "The Role of
Non-Interest-Bearing Instruments in the Net Interest Margin" in Mark
Carlson and Roberto Perli (2004), "
Profits and Balance Sheet
Developments at U.S. Commercial Banks in 2003 (686 kb PDF)
,"
Federal Reserve
Bulletin, vol. 90 (Spring), p. 173.
Return to text
21. For a discussion of the change in bankruptcy law that was
implemented in 2005 and its effect on credit card loans, refer to box
"The New Bankruptcy Law and Its Effect on Credit Card Loans"
in Klee and Weinbach, "
Profits and Balance Sheet Developments at U.S.
Commercial Banks in 2005
," p. A89.
Return to text
22. The new bankruptcy law caused a surge in the rate of credit
card charge-offs in the fourth quarter of 2005 that was followed by a
relatively low rate in the first quarter of 2006 (
figure 25
).
Excluding these values, the rate of credit card charge-offs averaged
4.3 percent in 2005 and 3.7 percent in 2006 (without
excluding those values, charge-off rates averaged 4.7 percent and
3.5 percent respectively).
Return to text
23. The increases in required minimum payments in 2006 may be
related to guidance that was issued by federal banking regulators in
January 2003 governing account management and loss allowance practices
for credit card lending. The guidance outlined the supervisory
agencies' expectations for prudent risk management, income recognition,
and loss allowance practices and provided guidance for minimum payments
and negative amortization. When the guidance was issued, it was
recognized that some banks might require additional time to implement
changes in policies, practices, and systems. Refer to the Board of
Governors of the Federal Reserve System, the Federal Deposit Insurance
Corporation, the Office of the Comptroller of the Currency, and the
Office of Thrift Supervision (2003), "
FFIEC Agencies Issue
Guidance on Credit Card Account Management and Loss Allowance
Practices
," press release, January 8.
Return to text
24. Banks boosted their provisioning in the third and fourth
quarters of 2005 because of the surge in personal bankruptcies
associated with the bankruptcy reform law that took effect in October
2005 and the effects of Hurricanes Katrina and Rita.
Return to text
25. Exposures consist of lending and derivatives exposures for
cross-border and local office operations.
Return to text
26. Board of Governors of the Federal Reserve System,
Statistical Release H.8, "
Assets and Liabilities of Commercial Banks
in the United States
". The H.8
includes only domestic assets.
Return to text
Appendix Tables
| Item | 1997 | 1998 | 1999 | 2000 | 2001 | 2002 | 2003 | 2004 | 2005 | 2006 | |
|---|---|---|---|---|---|---|---|---|---|---|---|
| Balance sheet items as a percentage of average net consolidated assets | |||||||||||
| Interest-earning assets | 87.15 | 86.76 | 87.03 | 87.13 | 86.49 | 86.42 | 86.08 | 86.90 | 86.82 | 86.85 | |
| Loans and leases (net) | 58.72 | 58.33 | 59.34 | 60.48 | 58.95 | 57.83 | 56.88 | 56.98 | 57.88 | 58.26 | |
| Commercial and industrial | 15.77 | 16.36 | 17.07 | 17.16 | 16.08 | 14.07 | 12.18 | 11.06 | 11.17 | 11.43 | |
| U.S. addressees | 13.17 | 13.61 | 14.43 | 14.67 | 13.69 | 12.04 | 10.48 | 9.52 | 9.64 | 9.73 | |
| Foreign addressees | 2.60 | 2.75 | 2.64 | 2.49 | 2.39 | 2.04 | 1.70 | 1.54 | 1.53 | 1.70 | |
| Consumer | 11.50 | 10.41 | 9.71 | 9.38 | 9.23 | 9.35 | 9.06 | 9.18 | 9.12 | 8.53 | |
| Credit card | 4.62 | 4.02 | 3.51 | 3.52 | 3.63 | 3.78 | 3.55 | 3.86 | 4.05 | 3.73 | |
| Installment and other | 6.88 | 6.39 | 6.20 | 5.87 | 5.60 | 5.57 | 5.51 | 5.31 | 5.06 | 4.80 | |
| Real estate | 25.00 | 24.85 | 25.44 | 27.04 | 27.10 | 28.39 | 29.91 | 30.78 | 32.40 | 33.19 | |
| In domestic offices | 24.39 | 24.28 | 24.87 | 26.49 | 26.60 | 27.91 | 29.45 | 30.24 | 31.84 | 32.61 | |
| Construction and land development | 1.73 | 1.86 | 2.18 | 2.51 | 2.85 | 2.98 | 2.99 | 3.26 | 3.90 | 4.73 | |
| Farmland | .55 | .55 | .56 | .56 | .55 | .56 | .54 | .54 | .54 | .53 | |
| One- to four-family residential | 14.41 | 14.25 | 14.10 | 14.96 | 14.67 | 15.40 | 16.96 | 17.42 | 18.26 | 18.23 | |
| Home equity | 1.94 | 1.89 | 1.76 | 1.96 | 2.18 | 2.80 | 3.40 | 4.34 | 4.95 | 4.71 | |
| Other | 12.47 | 12.37 | 12.34 | 13.00 | 12.49 | 12.60 | 13.57 | 13.08 | 13.31 | 13.52 | |
| Multifamily residential | .83 | .82 | .88 | .99 | .97 | 1.02 | 1.05 | 1.06 | 1.08 | 1.06 | |
| Nonfarm nonresidential | 6.88 | 6.80 | 7.15 | 7.48 | 7.56 | 7.95 | 7.91 | 7.97 | 8.06 | 8.07 | |
| In foreign offices | .61 | .57 | .57 | .54 | .50 | .48 | .46 | .53 | .56 | .58 | |
| To depository institutions and acceptances of other banks | 1.93 | 1.91 | 1.96 | 1.87 | 1.83 | 1.87 | 1.98 | 2.11 | 1.73 | 1.65 | |
| Foreign governments | .18 | .15 | .16 | .12 | .10 | .09 | .08 | .08 | .06 | .04 | |
| Agricultural production | .90 | .89 | .83 | .78 | .75 | .70 | .63 | .59 | .56 | .55 | |
| Other loans | 2.80 | 2.78 | 2.75 | 2.58 | 2.34 | 2.06 | 2.00 | 2.35 | 2.09 | 2.19 | |
| Lease-financing receivables | 1.87 | 2.12 | 2.51 | 2.63 | 2.58 | 2.44 | 2.11 | 1.79 | 1.58 | 1.43 | |
| Less: Unearned income on loans | -.09 | -.07 | -.06 | -.05 | -.04 | -.05 | -.04 | -.04 | -.03 | -.03 | |
| Less: Loss reserves 1 | -1.13 | -1.07 | -1.04 | -1.02 | -1.04 | -1.11 | -1.04 | -.91 | -.79 | -.71 | |
| Securities | 20.40 | 20.37 | 20.40 | 20.02 | 19.53 | 21.27 | 21.90 | 22.57 | 22.04 | 21.32 | |
| Investment account | 17.23 | 17.48 | 18.33 | 17.59 | 16.82 | 18.30 | 18.97 | 18.99 | 17.87 | 16.89 | |
| Debt | 16.74 | 16.93 | 17.73 | 16.93 | 16.48 | 17.99 | 18.72 | 18.79 | 17.71 | 16.73 | |
| U.S. Treasury | 3.38 | 2.71 | 2.14 | 1.66 | .85 | .78 | .90 | .89 | .62 | .47 | |
| U.S. government agency and corporation obligations | 9.73 | 10.28 | 10.85 | 10.31 | 10.08 | 11.46 | 12.26 | 12.37 | 11.51 | 10.65 | |
| Government-backed mortgage pools | 4.93 | 5.16 | 5.24 | 4.75 | 5.13 | 6.09 | 6.75 | 7.13 | 6.78 | 6.43 | |
| Collateralized mortgage obligations | 1.93 | 2.12 | 2.15 | 1.92 | 1.95 | 2.35 | 2.34 | 2.01 | 1.80 | 1.58 | |
| Other | 2.86 | 2.99 | 3.46 | 3.63 | 2.99 | 3.02 | 3.17 | 3.22 | 2.93 | 2.65 | |
| State and local government | 1.59 | 1.57 | 1.62 | 1.52 | 1.49 | 1.49 | 1.48 | 1.41 | 1.36 | 1.34 | |
| Private mortgage-backed securities | .50 | .67 | .88 | .95 | 1.09 | 1.25 | 1.30 | 1.41 | 1.76 | 1.87 | |
| Other | 1.54 | 1.70 | 2.24 | 2.48 | 2.98 | 3.01 | 2.78 | 2.72 | 2.47 | 2.39 | |
| Equity | .50 | .55 | .61 | .66 | .34 | .31 | .25 | .20 | .16 | .16 | |
| Trading account | 3.16 | 2.90 | 2.06 | 2.43 | 2.72 | 2.97 | 2.93 | 3.59 | 4.17 | 4.43 | |
| Gross federal funds sold and reverse RPs | 5.18 | 5.37 | 4.61 | 4.12 | 5.11 | 4.81 | 4.85 | 4.58 | 4.75 | 5.29 | |
| Interest-bearing balances at depositories | 2.86 | 2.69 | 2.68 | 2.52 | 2.90 | 2.52 | 2.45 | 2.76 | 2.15 | 1.97 | |
| Non-interest-earning assets | 12.85 | 13.24 | 12.97 | 12.87 | 13.51 | 13.58 | 13.92 | 13.10 | 13.18 | 13.15 | |
| Revaluation gains held in trading accounts | 2.59 | 2.95 | 2.57 | 2.28 | 2.37 | 2.42 | 2.70 | 2.19 | 1.82 | 1.64 | |
| Other | 10.26 | 10.29 | 10.41 | 10.58 | 11.15 | 11.16 | 11.22 | 10.91 | 11.36 | 11.51 | |
| Liabilities | 91.57 | 91.51 | 91.52 | 91.58 | 91.25 | 90.85 | 90.96 | 90.57 | 89.91 | 89.84 | |
| Core deposits | 50.89 | 49.43 | 48.60 | 46.52 | 47.07 | 48.98 | 49.18 | 48.56 | 47.52 | 45.57 | |
| Transaction deposits | 15.76 | 14.10 | 12.58 | 11.07 | 10.36 | 10.06 | 9.73 | 9.10 | 8.46 | 7.45 | |
| Demand deposits | 12.15 | 10.99 | 9.78 | 8.61 | 8.00 | 7.67 | 7.26 | 6.58 | 6.16 | 5.41 | |
| Other checkable deposits | 3.61 | 3.11 | 2.81 | 2.46 | 2.36 | 2.39 | 2.47 | 2.52 | 2.30 | 2.04 | |
| Savings deposits (including MMDAs) | 19.76 | 20.87 | 22.47 | 22.43 | 24.53 | 28.13 | 30.12 | 31.19 | 30.83 | 29.50 | |
| Small time deposits | 15.37 | 14.46 | 13.55 | 13.01 | 12.18 | 10.80 | 9.33 | 8.27 | 8.23 | 8.61 | |
| Managed liabilities 2 | 34.13 | 34.97 | 36.59 | 38.83 | 37.42 | 35.05 | 34.61 | 35.69 | 36.25 | 38.28 | |
| Large time deposits | 7.25 | 7.67 | 7.89 | 8.77 | 8.89 | 8.30 | 8.09 | 8.00 | 9.11 | 10.08 | |
| Deposits booked in foreign offices | 10.48 | 10.59 | 10.96 | 11.43 | 10.66 | 9.42 | 9.38 | 10.25 | 10.39 | 11.18 | |
| Subordinated notes and debentures | 1.15 | 1.30 | 1.36 | 1.37 | 1.43 | 1.40 | 1.33 | 1.30 | 1.34 | 1.40 | |
| Gross federal funds purchased and RPs | 8.13 | 7.98 | 7.97 | 7.83 | 7.95 | 7.77 | 7.75 | 7.24 | 7.05 | 7.52 | |
| Other managed liabilities | 7.13 | 7.43 | 8.40 | 9.44 | 8.49 | 8.16 | 8.06 | 8.91 | 8.37 | 8.11 | |
| Revaluation losses held in trading accounts | 2.64 | 2.97 | 2.52 | 2.29 | 2.21 | 2.09 | 2.30 | 1.95 | 1.67 | 1.51 | |
| Other | 3.91 | 4.14 | 3.81 | 3.94 | 4.54 | 4.73 | 4.87 | 4.36 | 4.47 | 4.47 | |
| Capital account | 8.43 | 8.49 | 8.48 | 8.42 | 8.75 | 9.15 | 9.04 | 9.43 | 10.09 | 10.16 | |
| Memo | |||||||||||
| Commercial real estate loans 3 | 9.98 | 10.11 | 10.87 | 11.58 | 12.09 | 12.57 | 12.47 | 12.78 | 13.52 | 14.35 | |
| Other real estate owned 4 | .11 | .08 | .06 | .05 | .05 | .06 | .06 | .06 | .04 | .05 | |
| Mortgage-backed securities | 7.37 | 7.96 | 8.27 | 7.63 | 8.17 | 9.69 | 10.39 | 10.56 | 10.33 | 9.88 | |
| Federal Home Loan Bank advances | n.a. | n.a. | n.a. | n.a. | 2.89 | 3.17 | 3.19 | 3.07 | 3.04 | 3.07 | |
| Average net consolidated assets (billions of dollars) | 4,737 | 5,148 | 5,439 | 5,907 | 6,334 | 6,635 | 7,249 | 7,879 | 8,592 | 9,425 | |
| Effective interest rate (percent) 5 | |||||||||||
| Rates earned | |||||||||||
| Interest-earning assets | 8.17 | 8.01 | 7.71 | 8.20 | 7.37 | 6.10 | 5.29 | 5.09 | 5.71 | 6.64 | |
| Taxable equivalent | 8.23 | 8.07 | 7.76 | 8.26 | 7.42 | 6.15 | 5.34 | 5.13 | 5.75 | 6.68 | |
| Loans and leases, gross | 9.03 | 8.85 | 8.47 | 9.00 | 8.15 | 6.89 | 6.15 | 5.91 | 6.52 | 7.54 | |
| Net of loss provisions | 8.50 | 8.30 | 7.97 | 8.33 | 7.15 | 5.84 | 5.47 | 5.47 | 6.10 | 7.18 | |
| Securities | 6.54 | 6.45 | 6.27 | 6.47 | 6.04 | 4.95 | 3.96 | 3.86 | 4.18 | 4.71 | |
| Taxable equivalent | 6.73 | 6.63 | 6.46 | 6.65 | 6.22 | 5.10 | 4.10 | 3.99 | 4.30 | 4.83 | |
| Investment account | 6.50 | 6.38 | 6.25 | 6.45 | 6.05 | 5.04 | 4.00 | 3.96 | 4.29 | 4.85 | |
| U.S. Treasury securities and U.S. government agency obligations (excluding MBS) | n.a. | n.a. | n.a. | n.a. | 5.76 | 4.42 | 3.29 | 3.11 | 3.46 | 4.19 | |
| Mortgage-backed securities | n.a. | n.a. | n.a. | n.a. | 6.45 | 5.44 | 4.24 | 4.38 | 4.60 | 5.08 | |
| Other | n.a. | n.a. | n.a. | n.a. | 5.60 | 4.74 | 4.08 | 3.76 | 4.23 | 4.80 | |
| Trading account | 6.75 | 6.85 | 6.47 | 6.63 | 6.01 | 4.38 | 3.71 | 3.35 | 3.72 | 4.16 | |
| Gross federal funds sold and reverse RPs | 5.45 | 5.29 | 4.78 | 5.56 | 3.86 | 1.93 | 1.40 | 1.40 | 2.66 | 4.31 | |
| Interest-bearing balances at depositories | 6.23 | 6.32 | 5.95 | 6.48 | 4.01 | 2.79 | 2.09 | 1.98 | 3.70 | 5.09 | |
| Rates paid | |||||||||||
| Interest-bearing liabilities | 4.92 | 4.88 | 4.47 | 5.17 | 4.15 | 2.54 | 1.87 | 1.77 | 2.69 | 3.90 | |
| Interest-bearing deposits | 4.39 | 4.31 | 3.87 | 4.45 | 3.61 | 2.11 | 1.47 | 1.36 | 2.06 | 3.04 | |
| In foreign offices | 5.44 | 5.66 | 4.91 | 5.61 | 3.95 | 2.38 | 1.62 | 1.72 | 2.77 | 3.92 | |
| In domestic offices | 4.16 | 4.01 | 3.63 | 4.17 | 3.54 | 2.06 | 1.44 | 1.29 | 1.91 | 2.85 | |
| Other checkable deposits | 2.25 | 2.29 | 2.08 | 2.34 | 1.96 | 1.06 | .75 | .77 | 1.41 | 1.88 | |
| Savings deposits (including MMDAs) | 2.93 | 2.79 | 2.49 | 2.86 | 2.19 | 1.13 | .74 | .72 | 1.24 | 2.01 | |
| Large time deposits 6 | 5.45 | 5.22 | 4.92 | 5.78 | 5.04 | 3.38 | 2.59 | 2.35 | 3.19 | 4.38 | |
| Other time deposits 6 | 5.54 | 5.48 | 5.09 | 5.69 | 5.43 | 3.70 | 2.88 | 2.56 | 3.14 | 4.10 | |
| Gross federal funds purchased and RPs | 5.17 | 5.19 | 4.73 | 5.77 | 3.84 | 1.88 | 1.30 | 1.49 | 3.07 | 4.57 | |
| Other interest-bearing liabilities | 6.94 | 6.89 | 6.48 | 6.97 | 5.92 | 4.32 | 3.59 | 3.26 | 4.50 | 6.19 | |
| Income and expense as a percentage of average net consolidated assets | |||||||||||
| Gross interest income | 7.15 | 6.98 | 6.73 | 7.18 | 6.38 | 5.27 | 4.54 | 4.44 | 4.98 | 5.84 | |
| Taxable equivalent | 7.21 | 7.03 | 6.78 | 7.22 | 6.43 | 5.31 | 4.58 | 4.48 | 5.02 | 5.88 | |
| Loans | 5.41 | 5.27 | 5.12 | 5.53 | 4.92 | 4.06 | 3.56 | 3.42 | 3.82 | 4.47 | |
| Securities | 1.11 | 1.10 | 1.14 | 1.15 | 1.00 | .89 | .74 | .74 | .77 | .84 | |
| Gross federal funds sold and reverse RPs | .29 | .29 | .23 | .23 | .20 | .09 | .07 | .07 | .13 | .23 | |
| Other | .35 | .32 | .24 | .27 | .27 | .22 | .18 | .21 | .26 | .31 | |
| Gross interest expense | 3.48 | 3.46 | 3.22 | 3.76 | 2.98 | 1.79 | 1.30 | 1.25 | 1.89 | 2.79 | |
| Deposits | 2.48 | 2.43 | 2.20 | 2.56 | 2.09 | 1.23 | .86 | .81 | 1.23 | 1.84 | |
| Gross federal funds purchased and RPs | .43 | .43 | .39 | .45 | .31 | .15 | .10 | .11 | .22 | .36 | |
| Other | .57 | .60 | .63 | .75 | .58 | .41 | .33 | .33 | .44 | .59 | |
| Net interest income | 3.68 | 3.52 | 3.52 | 3.41 | 3.40 | 3.48 | 3.24 | 3.19 | 3.09 | 3.05 | |
| Taxable equivalent | 3.73 | 3.57 | 3.56 | 3.46 | 3.45 | 3.52 | 3.28 | 3.23 | 3.12 | 3.08 | |
| Loss provisions 7 | .41 | .42 | .39 | .50 | .68 | .68 | .45 | .30 | .30 | .27 | |
| Non-interest income | 2.23 | 2.41 | 2.66 | 2.59 | 2.54 | 2.54 | 2.54 | 2.39 | 2.33 | 2.37 | |
| Service charges on deposits | .39 | .38 | .40 | .40 | .42 | .45 | .44 | .42 | .39 | .38 | |
| Fiduciary activities | .35 | .37 | .38 | .38 | .35 | .32 | .31 | .32 | .31 | .30 | |
| Trading revenue | .17 | .15 | .19 | .21 | .20 | .16 | .16 | .13 | .17 | .20 | |
| Interest rate exposures | .08 | .05 | .07 | .08 | .09 | .08 | .07 | .03 | .05 | .05 | |
| Foreign exchange rate exposures | .08 | .09 | .09 | .08 | .07 | .07 | .07 | .07 | .07 | .08 | |
| Other commodity and equity exposures | * | .01 | .03 | .04 | .03 | .01 | .02 | .03 | .04 | .07 | |
| Other | 1.32 | 1.50 | 1.69 | 1.61 | 1.57 | 1.61 | 1.63 | 1.51 | 1.46 | 1.48 | |
| Non-interest expense | 3.61 | 3.77 | 3.76 | 3.66 | 3.57 | 3.47 | 3.36 | 3.34 | 3.19 | 3.13 | |
| Salaries, wages, and employee benefits | 1.53 | 1.55 | 1.58 | 1.51 | 1.49 | 1.51 | 1.50 | 1.46 | 1.44 | 1.44 | |
| Occupancy | .47 | .47 | .48 | .45 | .44 | .44 | .43 | .42 | .41 | .39 | |
| Other | 1.62 | 1.76 | 1.70 | 1.70 | 1.64 | 1.52 | 1.43 | 1.46 | 1.34 | 1.30 | |
| Net non-interest expense | 1.38 | 1.36 | 1.11 | 1.07 | 1.03 | .93 | .82 | .96 | .86 | .76 | |
| Gains on investment account securities | .04 | .06 | * | -.04 | .07 | .10 | .08 | .04 | * | -.01 | |
| Income before taxes and extraordinary items | 1.92 | 1.81 | 2.02 | 1.81 | 1.77 | 1.96 | 2.05 | 1.97 | 1.93 | 2.01 | |
| Taxes | .68 | .62 | .72 | .63 | .59 | .65 | .67 | .64 | .62 | .65 | |
| Extraordinary items, net of income taxes | * | .01 | * | * | -.01 | * | .01 | * | * | .03 | |
| Net income | 1.25 | 1.20 | 1.31 | 1.18 | 1.17 | 1.31 | 1.39 | 1.33 | 1.31 | 1.39 | |
| Cash dividends declared | .90 | .80 | .96 | .89 | .87 | 1.01 | 1.07 | .76 | .75 | .87 | |
| Retained income | .35 | .40 | .35 | .29 | .31 | .30 | .31 | .58 | .56 | .52 | |
| Memo: | |||||||||||
| Return on equity | 14.84 | 14.07 | 15.39 | 13.97 | 13.40 | 14.36 | 15.35 | 14.14 | 12.99 | 13.67 | |
Note:
Data are as of April 13, 2007
1. Includes allocated transfer risk reserve.
Return to table
2. Measured as the sum of large time deposits in domestic offices, deposits booked in foreign offices, subordinated notes and debentures, federal funds purchased and securities sold under repurchase agreements, Federal Home Loan Bank advances, and other borrowed money. Return to table
3. Measured as the sum of construction and land development loans secured by real estate; real estate loans secured by nonfarm nonresidential properties or by multifamily residential properties; and loans to finance commercial real estate, construction, and land development activities not secured by real estate. Return to table
4. Other real estate owned is a component of other non-interest-earning assets. Return to table
5. When possible, based on the average of quarterly balance sheet data reported on schedule RC-K of the quarterly Call Report. Return to table
6. Before 1997, large time deposit open accounts were included in other time deposits. Return to table
7. Includes provisions for allocated transfer risk. Return to table
n.a. Not available.
MMDA Money market deposit account.
RP Repurchase agreement.
MBS Mortgage-backed securities.
| Item | 1997 | 1998 | 1999 | 2000 | 2001 | 2002 | 2003 | 2004 | 2005 | 2006 | |
|---|---|---|---|---|---|---|---|---|---|---|---|
| Balance sheet items as a percentage of average net consolidated assets | |||||||||||
| Interest-earning assets | 81.84 | 81.25 | 81.49 | 82.23 | 81.74 | 81.68 | 81.39 | 83.54 | 83.96 | 84.67 | |
| Loans and leases (net) | 50.91 | 50.76 | 53.37 | 55.22 | 53.86 | 53.61 | 52.20 | 51.29 | 51.35 | 52.04 | |
| Commercial and industrial | 16.90 | 18.07 | 19.20 | 19.87 | 18.82 | 16.16 | 12.98 | 10.54 | 10.61 | 11.18 | |
| U.S. addressees | 10.24 | 11.76 | 13.14 | 13.95 | 13.42 | 11.69 | 9.40 | 7.49 | 7.74 | 8.07 | |
| Foreign addressees | 6.66 | 6.31 | 6.06 | 5.92 | 5.41 | 4.47 | 3.59 | 3.06 | 2.87 | 3.11 | |
| Consumer | 6.40 | 6.04 | 5.94 | 5.43 | 6.17 | 7.82 | 7.96 | 8.49 | 8.80 | 8.23 | |
| Credit card | 1.34 | 1.30 | 1.36 | 1.34 | 1.64 | 2.90 | 2.81 | 3.19 | 3.60 | 3.11 | |
| Installment and other | 5.06 | 4.74 | 4.58 | 4.09 | 4.53 | 4.92 | 5.15 | 5.30 | 5.21 | 5.12 | |
| Real estate | 17.42 | 16.51 | 16.96 | 19.82 | 19.23 | 20.78 | 22.68 | 23.21 | 24.55 | 25.48 | |
| In domestic offices | 15.69 | 15.08 | 15.55 | 18.48 | 18.05 | 19.70 | 21.74 | 22.21 | 23.52 | 24.47 | |
| Construction and land development | .68 | .77 | .90 | .98 | 1.27 | 1.42 | 1.36 | 1.40 | 1.70 | 2.01 | |
| Farmland | .09 | .09 | .10 | .11 | .11 | .12 | .10 | .10 | .10 | .10 | |
| One- to four-family residential | 11.02 | 10.33 | 10.77 | 13.37 | 12.41 | 13.51 | 16.03 | 16.71 | 17.73 | 18.28 | |
| Home equity | 1.70 | 1.72 | 1.54 | 1.61 | 1.78 | 2.35 | 2.96 | 4.04 | 5.22 | 5.40 | |
| Other | 9.31 | 8.61 | 9.22 | 11.76 | 10.63 | 11.17 | 13.07 | 12.67 | 12.52 | 12.88 | |
| Multifamily residential | .39 | .38 | .43 | .60 | .51 | .55 | .47 | .45 | .44 | .44 | |
| Nonfarm nonresidential | 3.52 | 3.51 | 3.35 | 3.42 | 3.76 | 4.09 | 3.78 | 3.55 | 3.55 | 3.64 | |
| In foreign offices | 1.73 | 1.43 | 1.41 | 1.34 | 1.18 | 1.08 | .94 | 1.00 | 1.03 | 1.01 | |
| To depository institutions and acceptances of other banks | 4.20 | 4.05 | 4.34 | 3.78 | 3.23 | 3.20 | 3.54 | 4.10 | 3.15 | 2.97 | |
| Foreign governments | .45 | .35 | .38 | .28 | .20 | .20 | .17 | .16 | .12 | .07 | |
| Agricultural production | .31 | .28 | .26 | .23 | .28 | .23 | .19 | .22 | .20 | .20 | |
| Other loans | 4.15 | 3.74 | 3.96 | 3.75 | 3.51 | 2.94 | 2.87 | 3.32 | 2.81 | 2.88 | |
| Lease-financing receivables | 2.24 | 2.81 | 3.40 | 3.07 | 3.43 | 3.44 | 2.87 | 2.08 | 1.78 | 1.60 | |
| Less: Unearned income on loans | -.07 | -.06 | -.05 | -.04 | -.04 | -.08 | -.06 | -.04 | -.04 | -.02 | |
| Less: Loss reserves 1 | -1.08 | -1.01 | -1.03 | -.97 | -.97 | -1.12 | -1.02 | -.80 | -.65 | -.56 | |
| Securities | 20.00 | 19.72 | 18.34 | 18.98 | 17.81 | 20.54 | 21.22 | 22.95 | 23.37 | 23.04 | |
| Investment account | 10.97 | 12.12 | 13.08 | 13.71 | 12.14 | 14.35 | 15.31 | 15.99 | 15.58 | 15.11 | |
| Debt | 10.55 | 11.64 | 12.57 | 13.03 | 11.88 | 14.13 | 15.11 | 15.83 | 15.44 | 14.96 | |
| U.S. Treasury | 1.56 | 1.70 | 1.98 | 1.96 | .68 | .59 | .82 | .86 | .56 | .43 | |
| U.S. government agency and corporation obligations | 5.34 | 6.31 | 6.35 | 6.59 | 6.84 | 8.69 | 9.20 | 9.92 | 9.69 | 9.47 | |
| Government-backed mortgage pools | 4.26 | 5.13 | 5.03 | 4.88 | 4.99 | 6.38 | 7.59 | 8.64 | 8.65 | 8.63 | |
| Collateralized mortgage obligations | .93 | .93 | .79 | .93 | 1.11 | 1.52 | .91 | .70 | .54 | .52 | |
| Other | .15 | .26 | .52 | .78 | .74 | .79 | .70 | .58 | .50 | .32 | |
| State and local government | .51 | .47 | .45 | .51 | .55 | .59 | .59 | .57 | .58 | .64 | |
| Private mortgage-backed securities | .32 | .60 | .57 | .51 | .58 | .92 | 1.10 | .96 | 1.18 | 1.06 | |
| Other | 2.81 | 2.57 | 3.22 | 3.47 | 3.22 | 3.34 | 3.40 | 3.52 | 3.43 | 3.37 | |
| Equity | .42 | .47 | .51 | .68 | .26 | .22 | .20 | .16 | .14 | .15 | |
| Trading account | 9.03 | 7.60 | 5.25 | 5.26 | 5.67 | 6.18 | 5.91 | 6.96 | 7.79 | 7.93 | |
| Gross federal funds sold and reverse RPs | 7.56 | 7.81 | 6.64 | 5.02 | 6.38 | 5.26 | 5.79 | 6.37 | 6.96 | 7.60 | |
| Interest-bearing balances at depositories | 3.37 | 2.96 | 3.14 | 3.01 | 3.69 | 2.28 | 2.18 | 2.93 | 2.28 | 1.99 | |
| Non-interest-earning assets | 18.16 | 18.75 | 18.51 | 17.77 | 18.26 | 18.32 | 18.61 | 16.46 | 16.04 | 15.33 | |
| Revaluation gains held in trading accoun | 7.36 | 7.62 | 6.66 | 5.66 | 5.48 | 5.40 | 5.79 | 4.45 | 3.50 | 3.07 | |
| Other | 10.80 | 11.13 | 11.85 | 12.11 | 12.78 | 12.93 | 12.83 | 12.01 | 12.54 | 12.27 | |
| Liabilities | 92.61 | 92.58 | 92.28 | 92.36 | 92.14 | 91.52 | 91.94 | 91.64 | 90.81 | 91.07 | |
| Core deposits | 31.66 | 32.94 | 33.76 | 33.28 | 36.38 | 40.61 | 41.07 | 42.02 | 40.18 | 37.99 | |
| Transaction deposits | 10.19 | 9.45 | 8.55 | 8.01 | 8.40 | 8.34 | 7.74 | 6.65 | 6.05 | 5.40 | |
| Demand deposits | 8.98 | 8.46 | 7.83 | 7.28 | 7.50 | 7.40 | 6.72 | 5.43 | 4.90 | 4.31 | |
| Other checkable deposits | 1.21 | .99 | .72 | .74 | .90 | .95 | 1.02 | 1.22 | 1.15 | 1.09 | |
| Savings deposits (including MMDAs) | 15.32 | 17.07 | 18.94 | 19.24 | 22.21 | 26.82 | 28.99 | 31.54 | 30.11 | 28.08 | |
| Small time deposits | 6.15 | 6.42 | 6.26 | 6.03 | 5.77 | 5.44 | 4.34 | 3.83 | 4.02 | 4.51 | |
| Managed liabilities 2 | 46.02 | 44.42 | 45.49 | 46.84 | 43.41 | 38.89 | 38.60 | 39.33 | 40.83 | 43.77 | |
| Large time deposits | 4.17 | 5.04 | 5.19 | 5.55 | 5.46 | 5.13 | 5.53 | 5.21 | 6.28 | 6.84 | |
| Deposits booked in foreign offices | 23.39 | 21.23 | 22.22 | 22.76 | 20.28 | 17.31 | 16.62 | 17.20 | 17.51 | 18.48 | |
| Subordinated notes and debentures | 1.80 | 1.89 | 1.98 | 2.10 | 2.16 | 2.11 | 1.92 | 1.78 | 1.89 | 1.99 | |
| Gross federal funds purchased and RPs | 10.26 | 9.78 | 8.84 | 8.89 | 9.04 | 8.83 | 8.62 | 7.79 | 8.39 | 9.51 | |
| Other managed liabilities | 6.40 | 6.49 | 7.27 | 7.55 | 6.47 | 5.53 | 5.90 | 7.35 | 6.76 | 6.94 | |
| Revaluation losses held in trading accounts | 7.53 | 7.67 | 6.51 | 5.69 | 5.10 | 4.63 | 4.88 | 3.95 | 3.21 | 2.83 | |
| Other | 7.39 | 7.55 | 6.52 | 6.55 | 7.26 | 7.39 | 7.40 | 6.34 | 6.60 | 6.47 | |
| Capital account | 7.39 | 7.42 | 7.72 | 7.64 | 7.86 | 8.48 | 8.06 | 8.36 | 9.19 | 8.93 | |
| Memo | |||||||||||
| Commercial real estate loans 3 | 5.45 | 5.61 | 5.69 | 5.87 | 6.68 | 6.92 | 6.31 | 5.99 | 6.33 | 6.73 | |
| Other real estate owned 4 | .13 | .09 | .06 | .04 | .04 | .03 | .03 | .03 | .02 | .03 | |
| Mortgage-backed securities | 5.52 | 6.65 | 6.40 | 6.32 | 6.68 | 8.82 | 9.60 | 10.30 | 10.36 | 10.21 | |
| Federal Home Loan Bank advances | n.a. | n.a. | n.a. | n.a. | .82 | .82 | .84 | .79 | .63 | .75 | |
| Average net consolidated assets (billions of dollars) | 1,514 | 1,820 | 1,935 | 2,234 | 2,527 | 2,785 | 3,148 | 3,654 | 4,232 | 4,765 | |
| Effective interest rate (percent) 5 | |||||||||||
| Rates earned | |||||||||||
| Interest-earning assets | 7.57 | 7.55 | 7.37 | 7.76 | 6.83 | 5.82 | 4.99 | 4.71 | 5.29 | 6.25 | |
| Taxable equivalent | 7.60 | 7.57 | 7.39 | 7.78 | 6.86 | 5.85 | 5.01 | 4.73 | 5.31 | 6.27 | |
| Loans and leases, gross | 8.25 | 8.21 | 7.99 | 8.46 | 7.50 | 6.52 | 5.76 | 5.52 | 6.15 | 7.26 | |
| Net of loss provisions | 8.10 | 7.77 | 7.65 | 7.92 | 6.55 | 5.30 | 5.19 | 5.29 | 5.84 | 6.94 | |
| Securities | 6.78 | 6.83 | 6.58 | 6.48 | 6.23 | 5.04 | 4.15 | 4.04 | 4.27 | 4.67 | |
| Taxable equivalent | 6.85 | 6.89 | 6.65 | 6.55 | 6.31 | 5.11 | 4.21 | 4.10 | 4.32 | 4.72 | |
| Investment account | 6.76 | 6.78 | 6.59 | 6.40 | 6.23 | 5.30 | 4.26 | 4.37 | 4.63 | 5.08 | |
| U.S. Treasury securities and U.S. government agency obligations (excluding MBS) | n.a. | n.a. | n.a. | n.a. | 5.01 | 3.74 | 2.62 | 2.92 | 3.29 | 4.15 | |
| Mortgage-backed securities | n.a. | n.a. | n.a. | n.a. | 6.42 | 5.55 | 4.51 | 4.83 | 4.92 | 5.27 | |
| Other | n.a. | n.a. | n.a. | n.a. | 6.34 | 5.30 | 4.28 | 3.76 | 4.26 | 4.77 | |
| Trading account | 6.81 | 6.92 | 6.56 | 6.70 | 6.24 | 4.46 | 3.87 | 3.32 | 3.57 | 3.89 | |
| Gross federal funds sold and reverse RPs | 5.45 | 5.20 | 4.52 | 4.93 | 3.86 | 2.20 | 1.60 | 1.43 | 2.46 | 4.06 | |
| Interest-bearing balances at depositories | 6.91 | 7.16 | 7.22 | 7.43 | 3.73 | 3.40 | 2.49 | 1.80 | 4.06 | 5.59 | |
| Rates paid | |||||||||||
| Interest-bearing liabilities | 5.41 | 5.29 | 4.79 | 5.37 | 4.09 | 2.54 | 1.85 | 1.80 | 2.82 | 4.10 | |
| Interest-bearing deposits | 4.54 | 4.40 | 3.82 | 4.40 | 3.27 | 1.94 | 1.34 | 1.29 | 2.01 | 2.96 | |
| In foreign offices | 5.52 | 5.83 | 4.99 | 5.67 | 4.02 | 2.59 | 1.74 | 1.81 | 2.77 | 3.88 | |
| In domestic offices | 3.69 | 3.39 | 3.04 | 3.51 | 2.84 | 1.67 | 1.18 | 1.08 | 1.70 | 2.55 | |
| Other checkable deposits | 1.97 | 1.67 | 1.44 | 1.61 | 1.67 | .93 | .80 | .97 | 2.27 | 2.46 | |
| Savings deposits (including MMDAs) | 2.68 | 2.45 | 2.11 | 2.43 | 1.92 | 1.02 | .73 | .71 | 1.15 | 1.87 | |
| Large time deposits 6 | 5.17 | 4.53 | 4.36 | 5.32 | 4.40 | 3.26 | 2.36 | 2.14 | 3.06 | 4.31 | |
| Other time deposits 6 | 5.45 | 5.21 | 4.95 | 5.53 | 5.11 | 3.44 | 2.70 | 2.61 | 3.40 | 4.05 | |
| Gross federal funds purchased and RPs | 5.02 | 5.18 | 4.53 | 5.47 | 3.81 | 2.02 | 1.39 | 1.59 | 3.11 | 4.62 | |
| Other interest-bearing liabilities | 9.13 | 8.85 | 8.61 | 8.15 | 7.01 | 5.40 | 4.27 | 3.69 | 5.25 | 7.46 | |
| Income and expense as a percentage of average net consolidated assets | |||||||||||
| Gross interest income | 6.31 | 6.21 | 6.01 | 6.39 | 5.55 | 4.77 | 4.05 | 3.94 | 4.47 | 5.39 | |
| Taxable equivalent | 6.33 | 6.22 | 6.03 | 6.41 | 5.57 | 4.79 | 4.07 | 3.96 | 4.48 | 5.41 | |
| Loans | 4.31 | 4.27 | 4.35 | 4.74 | 4.13 | 3.57 | 3.04 | 2.86 | 3.19 | 3.85 | |
| Securities | .73 | .81 | .85 | .88 | .72 | .73 | .63 | .69 | .72 | .79 | |
| Gross federal funds sold and reverse RPs | .45 | .42 | .30 | .25 | .25 | .12 | .10 | .10 | .18 | .31 | |
| Other | .82 | .70 | .51 | .51 | .44 | .35 | .28 | .30 | .38 | .45 | |
| Gross interest expense | 3.55 | 3.48 | 3.16 | 3.60 | 2.69 | 1.65 | 1.19 | 1.20 | 1.89 | 2.86 | |
| Deposits | 2.26 | 2.20 | 1.97 | 2.33 | 1.74 | 1.05 | .74 | .74 | 1.17 | 1.72 | |
| Gross federal funds purchased and RPs | .54 | .54 | .40 | .49 | .35 | .18 | .13 | .13 | .27 | .47 | |
| Other | .75 | .74 | .79 | .78 | .59 | .41 | .33 | .33 | .45 | .67 | |
| Net interest income | 2.76 | 2.73 | 2.84 | 2.78 | 2.87 | 3.12 | 2.86 | 2.74 | 2.58 | 2.54 | |
| Taxable equivalent | 2.79 | 2.75 | 2.86 | 2.80 | 2.89 | 3.14 | 2.88 | 2.76 | 2.59 | 2.56 | |
| Loss provisions 7 | .16 | .31 | .26 | .38 | .59 | .73 | .35 | .16 | .20 | .21 | |
| Non-interest income | 2.12 | 2.15 | 2.55 | 2.54 | 2.26 | 2.31 | 2.32 | 2.21 | 2.37 | 2.24 | |
| Service charges on deposits | .32 | .33 | .37 | .40 | .44 | .48 | .46 | .45 | .42 | .41 | |
| Fiduciary activities | .34 | .32 | .31 | .27 | .29 | .25 | .26 | .24 | .27 | .23 | |
| Trading revenue | .43 | .33 | .46 | .48 | .43 | .32 | .30 | .23 | .31 | .36 | |
| Interest rate exposures | .23 | .10 | .17 | .20 | .20 | .15 | .12 | .07 | .11 | .09 | |
| Foreign exchange rate exposures | .20 | .20 | .19 | .18 | .14 | .14 | .14 | .12 | .12 | .14 | |
| Other commodity and equity exposures | * | .03 | .09 | .11 | .08 | .03 | .04 | .04 | .07 | .13 | |
| Other | 1.04 | 1.17 | 1.41 | 1.39 | 1.10 | 1.26 | 1.30 | 1.28 | 1.38 | 1.24 | |
| Non-interest expense | 3.24 | 3.47 | 3.45 | 3.31 | 3.13 | 3.16 | 3.02 | 3.11 | 2.99 | 2.80 | |
| Salaries, wages, and employee benefits | 1.45 | 1.45 | 1.57 | 1.46 | 1.38 | 1.41 | 1.39 | 1.34 | 1.38 | 1.39 | |
| Occupancy | .47 | .47 | .50 | .47 | .45 | .46 | .45 | .43 | .43 | .40 | |
| Other | 1.33 | 1.54 | 1.38 | 1.39 | 1.30 | 1.28 | 1.18 | 1.33 | 1.19 | 1.01 | |
| Net non-interest expense | 1.12 | 1.32 | .90 | .77 | .87 | .85 | .70 | .91 | .62 | .56 | |
| Gains on investment account securities | .08 | .11 | .03 | -.03 | .08 | .13 | .11 | .07 | * | -.01 | |
| Income before taxes and extraordinary items | 1.56 | 1.22 | 1.71 | 1.60 | 1.48 | 1.67 | 1.92 | 1.74 | 1.75 | 1.76 | |
| Taxes | .58 | .44 | .66 | .60 | .49 | .56 | .63 | .56 | .57 | .57 | |
| Extraordinary items, net of income taxes | * | * | * | * | -.01 | * | * | * | * | .02 | |
| Net income | .98 | .78 | 1.05 | 1.00 | .99 | 1.11 | 1.29 | 1.18 | 1.18 | 1.21 | |
| Cash dividends declared | .82 | .53 | .79 | .86 | .66 | 1.05 | .99 | .65 | .59 | .63 | |
| Retained income | .15 | .25 | .26 | .13 | .32 | .06 | .30 | .53 | .59 | .58 | |
| Memo: | |||||||||||
| Return on equity | 13.22 | 10.53 | 13.58 | 13.04 | 12.55 | 13.14 | 16.06 | 14.07 | 12.86 | 13.58 | |
Note:
Data are as of April 13, 2007.
1. Includes allocated transfer risk reserve.
Return to table
2. Measured as the sum of large time deposits in domestic offices, deposits booked in foreign offices, subordinated notes and debentures, federal funds purchased and securities sold under repurchase agreements, Federal Home Loan Bank advances, and other borrowed money. Return to table
3. Measured as the sum of construction and land development loans secured by real estate; real estate loans secured by nonfarm nonresidential properties or by multifamily residential properties; and loans to finance commercial real estate, construction, and land development activities not secured by real estate. Return to table
4. Other real estate owned is a component of other non-interest-earning assets. Return to table
5. When possible, based on the average of quarterly balance sheet data reported on schedule RC-K of the quarterly Call Report. Return to table
6. Before 1997, large time deposit open accounts were included in other time deposits. Return to table
7. Includes provisions for allocated transfer risk. Return to table
n.a. Not available.
MMDA Money market deposit account.
RP Repurchase agreement.
MBS Mortgage-backed securities.
| Item | 1997 | 1998 | 1999 | 2000 | 2001 | 2002 | 2003 | 2004 | 2005 | 2006 | |
|---|---|---|---|---|---|---|---|---|---|---|---|
| Balance sheet items as a percentage of average net consolidated assets | |||||||||||
| Interest-earning assets | 87.50 | 87.85 | 88.40 | 88.67 | 88.09 | 88.34 | 88.10 | 88.18 | 87.87 | 87.05 | |
| Loans and leases (net) | 63.89 | 64.37 | 64.22 | 64.88 | 62.14 | 60.00 | 59.48 | 60.63 | 63.37 | 62.80 | |
| Commercial and industrial | 19.01 | 18.92 | 19.40 | 18.19 | 15.84 | 13.27 | 11.96 | 11.90 | 12.18 | 12.16 | |
| U.S. addressees | 17.78 | 17.59 | 18.18 | 17.64 | 15.36 | 12.94 | 11.66 | 11.64 | 11.91 | 11.84 | |
| Foreign addressees | 1.22 | 1.33 | 1.22 | .55 | .48 | .33 | .30 | .26 | .27 | .32 | |
| Consumer | 15.62 | 14.52 | 13.57 | 13.79 | 13.20 | 12.79 | 12.57 | 12.73 | 12.84 | 11.83 | |
| Credit card | 8.50 | 7.67 | 6.78 | 6.97 | 6.97 | 6.56 | 6.35 | 6.90 | 7.44 | 7.00 | |
| Installment and other | 7.12 | 6.86 | 6.79 | 6.82 | 6.23 | 6.22 | 6.21 | 5.83 | 5.39 | 4.84 | |
| Real estate | 22.99 | 24.59 | 24.80 | 26.21 | 27.29 | 28.94 | 30.67 | 32.16 | 34.89 | 35.36 | |
| In domestic offices | 22.85 | 24.42 | 24.62 | 26.12 | 27.21 | 28.88 | 30.54 | 31.97 | 34.73 | 35.15 | |
| Construction and land development | 1.69 | 2.03 | 2.43 | 3.00 | 3.31 | 3.36 | 3.22 | 3.51 | 4.21 | 5.31 | |
| Farmland | .14 | .17 | .19 | .22 | .23 | .22 | .20 | .19 | .19 | .17 | |
| One- to four-family residential | 13.88 | 14.86 | 14.15 | 14.51 | 15.51 | 17.05 | 18.79 | 19.52 | 21.05 | 20.32 | |
| Home equity | 2.22 | 2.17 | 2.08 | 2.49 | 2.90 | 3.92 | 4.74 | 5.90 | 6.04 | 5.02 | |
| Other | 11.65 | 12.69 | 12.07 | 12.02 | 12.60 | 13.13 | 14.05 | 13.62 | 15.01 | 15.30 | |
| Multifamily residential | .93 | 1.00 | 1.02 | 1.11 | 1.16 | 1.20 | 1.32 | 1.34 | 1.45 | 1.46 | |
| Nonfarm nonresidential | 6.21 | 6.36 | 6.82 | 7.28 | 6.99 | 7.05 | 7.00 | 7.41 | 7.83 | 7.89 | |
| In foreign offices | .15 | .18 | .19 | .09 | .09 | .06 | .13 | .20 | .16 | .21 | |
| To depository institutions and acceptances of other banks | 1.30 | 1.09 | .93 | 1.05 | 1.40 | 1.44 | 1.21 | .54 | .56 | .44 | |
| Foreign governments | .09 | .06 | .06 | .03 | .03 | .02 | .02 | .01 | .02 | .01 | |
| Agricultural production | .29 | .33 | .33 | .37 | .32 | .27 | .23 | .19 | .19 | .18 | |
| Other loans | 3.18 | 3.35 | 2.99 | 2.57 | 2.03 | 1.80 | 1.59 | 1.87 | 1.62 | 1.87 | |
| Lease-financing receivables | 2.70 | 2.71 | 3.27 | 3.82 | 3.18 | 2.65 | 2.35 | 2.30 | 2.07 | 1.83 | |
| Less: Unearned income on loans | -.05 | -.04 | -.04 | -.03 | -.02 | -.02 | -.02 | -.02 | -.01 | -.01 | |
| Less: Loss reserves 1 | -1.24 | -1.16 | -1.11 | -1.12 | -1.13 | -1.17 | -1.10 | -1.06 | -.97 | -.87 | |
| Securities | 15.80 | 16.66 | 17.79 | 17.32 | 19.00 | 20.30 | 21.16 | 21.28 | 19.96 | 19.19 | |
| Investment account | 15.07 | 16.13 | 17.28 | 16.10 | 17.71 | 19.17 | 20.09 | 20.12 | 18.80 | 17.69 | |
| Debt | 14.58 | 15.58 | 16.64 | 15.50 | 17.32 | 18.82 | 19.88 | 19.96 | 18.69 | 17.56 | |
| U.S. Treasury | 2.81 | 2.25 | 1.70 | 1.12 | .67 | .74 | .95 | .89 | .60 | .44 | |
| U.S. government agency and corporation obligations | 8.98 | 9.93 | 10.57 | 9.70 | 10.09 | 11.45 | 12.99 | 12.80 | 11.62 | 10.08 | |
| Government-backed mortgage pools | 5.17 | 4.98 | 5.12 | 4.31 | 5.19 | 6.00 | 6.08 | 5.74 | 4.83 | 4.05 | |
| Collateralized mortgage obligations | 2.13 | 2.83 | 2.89 | 2.55 | 2.42 | 2.79 | 3.72 | 3.42 | 3.39 | 2.93 | |
| Other | 1.68 | 2.12 | 2.56 | 2.84 | 2.48 | 2.65 | 3.19 | 3.64 | 3.40 | 3.10 | |
| State and local government | .88 | .92 | .99 | .96 | .99 | .97 | .95 | .96 | .98 | 1.01 | |
| Private mortgage-backed securities | .73 | .96 | 1.35 | 1.66 | 2.01 | 2.13 | 2.14 | 2.65 | 3.58 | 4.28 | |
| Other | 1.18 | 1.53 | 2.02 | 2.06 | 3.56 | 3.53 | 2.85 | 2.66 | 1.90 | 1.75 | |
| Equity | .49 | .55 | .65 | .60 | .39 | .34 | .21 | .16 | .11 | .12 | |
| Trading account | .73 | .54 | .51 | 1.22 | 1.29 | 1.13 | 1.07 | 1.16 | 1.16 | 1.51 | |
| Gross federal funds sold and reverse RPs | 4.38 | 3.57 | 3.34 | 3.76 | 4.06 | 4.71 | 4.20 | 2.98 | 2.30 | 2.86 | |
| Interest-bearing balances at depositories | 3.43 | 3.24 | 3.06 | 2.71 | 2.88 | 3.33 | 3.26 | 3.29 | 2.24 | 2.20 | |
| Non-interest-earning assets | 12.50 | 12.15 | 11.60 | 11.33 | 11.91 | 11.66 | 11.90 | 11.82 | 12.13 | 12.95 | |
| Revaluation gains held in trading accoun | .69 | .75 | .56 | .40 | .55 | .47 | .60 | .42 | .33 | .30 | |
| Other | 11.81 | 11.40 | 11.04 | 10.92 | 11.37 | 11.19 | 11.30 | 11.40 | 11.80 | 12.65 | |
| Liabilities | 91.85 | 91.63 | 91.66 | 91.57 | 91.15 | 90.79 | 90.65 | 89.87 | 88.86 | 88.12 | |
| Core deposits | 51.51 | 49.89 | 48.35 | 46.28 | 46.28 | 47.07 | 47.93 | 46.55 | 48.18 | 46.98 | |
| Transaction deposits | 16.12 | 14.15 | 12.12 | 9.93 | 8.37 | 7.49 | 7.29 | 7.06 | 6.64 | 5.75 | |
| Demand deposits | 14.17 | 12.39 | 10.52 | 8.61 | 7.17 | 6.32 | 5.96 | 5.65 | 5.35 | 4.55 | |
| Other checkable deposits | 1.95 | 1.75 | 1.60 | 1.32 | 1.20 | 1.17 | 1.33 | 1.41 | 1.29 | 1.21 | |
| Savings deposits (including MMDAs) | 21.71 | 22.51 | 23.90 | 24.02 | 26.62 | 30.07 | 32.34 | 31.75 | 33.33 | 32.75 | |
| Small time deposits | 13.69 | 13.24 | 12.32 | 12.33 | 11.28 | 9.51 | 8.30 | 7.74 | 8.21 | 8.47 | |
| Managed liabilities 2 | 36.60 | 38.11 | 39.83 | 41.98 | 40.81 | 39.48 | 38.12 | 39.29 | 37.05 | 37.54 | |
| Large time deposits | 7.37 | 7.83 | 8.17 | 9.54 | 9.72 | 8.99 | 8.20 | 8.76 | 10.10 | 11.47 | |
| Deposits booked in foreign offices | 8.08 | 8.37 | 8.19 | 7.56 | 7.05 | 6.28 | 6.54 | 7.21 | 6.02 | 6.44 | |
| Subordinated notes and debentures | 1.48 | 1.66 | 1.71 | 1.54 | 1.53 | 1.44 | 1.38 | 1.39 | 1.31 | 1.33 | |
| Gross federal funds purchased and RPs | 9.36 | 9.48 | 9.77 | 9.28 | 9.71 | 9.66 | 9.69 | 8.95 | 7.17 | 6.71 | |
| Other managed liabilities | 10.31 | 10.77 | 11.99 | 14.07 | 12.79 | 13.11 | 12.30 | 12.97 | 12.44 | 11.58 | |
| Revaluation losses held in trading accounts | .68 | .76 | .58 | .41 | .52 | .44 | .56 | .40 | .34 | .30 | |
| Other | 3.05 | 2.87 | 2.90 | 2.91 | 3.54 | 3.80 | 4.05 | 3.64 | 3.30 | 3.31 | |
| Capital account | 8.15 | 8.37 | 8.34 | 8.43 | 8.85 | 9.21 | 9.35 | 10.13 | 11.14 | 11.88 | |
| Memo | |||||||||||
| Commercial real estate loans 3 | 9.44 | 10.11 | 11.00 | 12.06 | 12.06 | 12.24 | 12.10 | 12.85 | 13.93 | 15.13 | |
| Other real estate owned 4 | .06 | .04 | .03 | .03 | .04 | .05 | .06 | .05 | .04 | .05 | |
| Mortgage-backed securities | 8.03 | 8.76 | 9.36 | 8.52 | 9.63 | 10.93 | 11.93 | 11.81 | 11.81 | 11.26 | |
| Federal Home Loan Bank advances | n.a. | n.a. | n.a. | n.a. | 4.07 | 4.85 | 4.75 | 4.65 | 5.19 | 5.56 | |
| Average net consolidated assets (billions of dollars) | 1,604 | 1,745 | 1,881 | 2,031 | 2,130 | 2,124 | 2,287 | 2,376 | 2,403 | 2,575 | |
| Effective interest rate (percent) 5 | |||||||||||
| Rates earned | |||||||||||
| Interest-earning assets | 8.33 | 8.12 | 7.84 | 8.44 | 7.54 | 6.03 | 5.30 | 5.26 | 6.05 | 7.06 | |
| Taxable equivalent | 8.36 | 8.16 | 7.88 | 8.48 | 7.58 | 6.07 | 5.33 | 5.29 | 6.08 | 7.09 | |
| Loans and leases, gross | 9.03 | 8.81 | 8.50 | 9.14 | 8.26 | 6.80 | 6.11 | 5.98 | 6.63 | 7.72 | |
| Net of loss provisions | 8.27 | 8.14 | 7.80 | 8.25 | 6.96 | 5.59 | 5.11 | 5.19 | 5.91 | 7.17 | |
| Securities | 6.55 | 6.31 | 6.32 | 6.64 | 5.96 | 4.79 | 3.80 | 3.63 | 4.18 | 5.05 | |
| Taxable equivalent | 6.70 | 6.46 | 6.46 | 6.77 | 6.08 | 4.91 | 3.90 | 3.73 | 4.29 | 5.16 | |
| Investment account | 6.57 | 6.33 | 6.34 | 6.66 | 6.04 | 4.86 | 3.87 | 3.64 | 4.11 | 4.90 | |
| U.S. Treasury securities and U.S. government agency obligations (excluding MBS) | n.a. | n.a. | n.a. | n.a. | 5.83 | 4.28 | 3.17 | 2.94 | 3.47 | 4.29 | |
| Mortgage-backed securities | n.a. | n.a. | n.a. | n.a. | 6.60 | 5.34 | 4.20 | 4.02 | 4.34 | 5.02 | |
| Other | n.a. | n.a. | n.a. | n.a. | 5.13 | 4.22 | 3.61 | 3.29 | 4.06 | 5.18 | |
| Trading account | 6.05 | 5.86 | 5.58 | 6.25 | 4.83 | 3.59 | 2.56 | 3.39 | 5.30 | 6.86 | |
| Gross federal funds sold and reverse RPs | 5.45 | 5.46 | 5.12 | 6.06 | 3.86 | 1.68 | 1.14 | 1.25 | 3.24 | 4.98 | |
| Interest-bearing balances at depositories | 5.76 | 5.67 | 4.81 | 5.49 | 4.38 | 2.46 | 1.93 | 2.27 | 3.20 | 4.21 | |
| Rates paid | |||||||||||
| Interest-bearing liabilities | 4.79 | 4.77 | 4.38 | 5.22 | 4.16 | 2.41 | 1.80 | 1.71 | 2.68 | 3.88 | |
| Interest-bearing deposits | 4.22 | 4.15 | 3.76 | 4.42 | 3.60 | 1.96 | 1.35 | 1.29 | 2.03 | 3.07 | |
| In foreign offices | 5.23 | 5.22 | 4.70 | 5.38 | 3.67 | 1.70 | 1.23 | 1.42 | 2.76 | 4.10 | |
| In domestic offices | 4.04 | 3.96 | 3.60 | 4.26 | 3.60 | 1.99 | 1.36 | 1.27 | 1.95 | 2.95 | |
| Other checkable deposits | 2.01 | 2.41 | 2.03 | 2.57 | 2.32 | .94 | .64 | .72 | 1.29 | 2.11 | |
| Savings deposits (including MMDAs) | 2.84 | 2.76 | 2.49 | 2.94 | 2.30 | 1.08 | .66 | .65 | 1.30 | 2.14 | |
| Large time deposits 6 | 5.47 | 5.32 | 4.96 | 5.88 | 5.11 | 3.37 | 2.70 | 2.49 | 3.31 | 4.46 | |
| Other time deposits 6 | 5.43 | 5.35 | 5.03 | 5.73 | 5.42 | 3.68 | 2.95 | 2.58 | 3.03 | 4.09 | |
| Gross federal funds purchased and RPs | 5.29 | 5.22 | 4.87 | 6.02 | 3.86 | 1.73 | 1.20 | 1.37 | 3.04 | 4.48 | |
| Other interest-bearing liabilities | 5.85 | 5.81 | 5.41 | 6.36 | 5.30 | 3.54 | 3.02 | 2.76 | 3.87 | 5.17 | |
| Income and expense as a percentage of average net consolidated assets | |||||||||||
| Gross interest income | 7.26 | 7.15 | 6.98 | 7.54 | 6.70 | 5.31 | 4.67 | 4.67 | 5.34 | 6.20 | |
| Taxable equivalent | 7.30 | 7.19 | 7.02 | 7.57 | 6.73 | 5.34 | 4.70 | 4.70 | 5.37 | 6.23 | |
| Loans | 5.87 | 5.78 | 5.56 | 6.05 | 5.28 | 4.15 | 3.72 | 3.72 | 4.27 | 4.96 | |
| Securities | .98 | 1.00 | 1.10 | 1.09 | 1.06 | .90 | .75 | .73 | .77 | .88 | |
| Gross federal funds sold and reverse RPs | .22 | .19 | .18 | .22 | .15 | .08 | .04 | .03 | .06 | .14 | |
| Other | .19 | .18 | .14 | .18 | .21 | .18 | .15 | .19 | .22 | .23 | |
| Gross interest expense | 3.41 | 3.45 | 3.26 | 3.96 | 3.14 | 1.77 | 1.30 | 1.26 | 1.94 | 2.82 | |
| Deposits | 2.23 | 2.23 | 2.02 | 2.41 | 2.01 | 1.09 | .77 | .74 | 1.18 | 1.85 | |
| Gross federal funds purchased and RPs | .51 | .51 | .51 | .56 | .38 | .17 | .12 | .13 | .23 | .30 | |
| Other | .68 | .71 | .74 | .99 | .75 | .51 | .41 | .40 | .53 | .67 | |
| Net interest income | 3.85 | 3.70 | 3.72 | 3.58 | 3.56 | 3.54 | 3.37 | 3.41 | 3.40 | 3.38 | |
| Taxable equivalent | 3.89 | 3.73 | 3.75 | 3.61 | 3.59 | 3.57 | 3.40 | 3.44 | 3.43 | 3.41 | |
| Loss provisions 7 | .60 | .53 | .55 | .68 | .91 | .80 | .67 | .55 | .52 | .42 | |
| Non-interest income | 2.76 | 3.09 | 3.36 | 3.18 | 3.35 | 3.30 | 3.29 | 3.05 | 2.75 | 3.13 | |
| Service charges on deposits | .44 | .42 | .41 | .42 | .42 | .42 | .42 | .40 | .37 | .35 | |
| Fiduciary activities | .44 | .49 | .48 | .52 | .42 | .42 | .37 | .42 | .35 | .41 | |
| Trading revenue | .08 | .09 | .08 | .07 | .08 | .08 | .09 | .07 | .06 | .07 | |
| Interest rate exposures | .02 | .03 | .02 | .02 | .04 | .04 | .04 | -.01 | -.01 | .02 | |
| Foreign exchange rate exposures | .05 | .06 | .05 | .04 | .03 | .04 | .04 | .05 | .04 | .05 | |
| Other commodity and equity exposures | * | * | * | * | * | * | .01 | .03 | .02 | * | |
| Other | 1.79 | 2.09 | 2.39 | 2.18 | 2.43 | 2.37 | 2.41 | 2.16 | 1.98 | 2.30 | |
| Non-interest expense | 3.85 | 4.05 | 4.12 | 4.00 | 3.95 | 3.73 | 3.64 | 3.55 | 3.36 | 3.51 | |
| Salaries, wages, and employee benefits | 1.51 | 1.53 | 1.53 | 1.44 | 1.47 | 1.49 | 1.47 | 1.45 | 1.37 | 1.34 | |
| Occupancy | .46 | .46 | .45 | .43 | .42 | .40 | .41 | .39 | .37 | .33 | |
| Other | 1.88 | 2.06 | 2.14 | 2.14 | 2.07 | 1.84 | 1.76 | 1.70 | 1.62 | 1.83 | |
| Net non-interest expense | 1.10 | .95 | .76 | .82 | .60 | .43 | .35 | .50 | .61 | .38 | |
| Gains on investment account securities | .02 | .03 | -.01 | -.05 | .09 | .10 | .06 | .03 | * | -.03 | |
| Income before taxes and extraordinary items | 2.18 | 2.24 | 2.40 | 2.02 | 2.14 | 2.41 | 2.42 | 2.39 | 2.27 | 2.56 | |
| Taxes | .77 | .78 | .86 | .70 | .74 | .82 | .82 | .82 | .77 | .87 | |
| Extraordinary items, net of income taxes | * | * | * | * | * | * | * | * | .01 | .07 | |
| Net income | 1.42 | 1.45 | 1.54 | 1.32 | 1.39 | 1.59 | 1.59 | 1.57 | 1.50 | 1.76 | |
| Cash dividends declared | .93 | .96 | 1.16 | .94 | .96 | .99 | 1.05 | .95 | 1.00 | 1.38 | |
| Retained income | .48 | .49 | .38 | .38 | .43 | .60 | .54 | .62 | .50 | .38 | |
| Memo: | |||||||||||
| Return on equity | 17.36 | 17.37 | 18.46 | 15.72 | 15.74 | 17.24 | 17.03 | 15.54 | 13.48 | 14.80 | |
Note:
Data are as of April 13, 2007.
1. Includes allocated transfer risk reserve.
Return to table
2. Measured as the sum of large time deposits in domestic offices, deposits booked in foreign offices, subordinated notes and debentures, federal funds purchased and securities sold under repurchase agreements, Federal Home Loan Bank advances, and other borrowed money. Return to table
3. Measured as the sum of construction and land development loans secured by real estate; real estate loans secured by nonfarm nonresidential properties or by multifamily residential properties; and loans to finance commercial real estate, construction, and land development activities not secured by real estate. Return to table
4. Other real estate owned is a component of other non-interest-earning assets. Return to table
5. When possible, based on the average of quarterly balance sheet data reported on schedule RC-K of the quarterly Call Report. Return to table
6. Before 1997, large time deposit open accounts were included in other time deposits. Return to table
7. Includes provisions for allocated transfer risk. Return to table
* In absolute value, less than 0.005 percent.
n.a. Not available.
MMDA Money market deposit account.
RP Repurchase agreement.
MBS Mortgage-backed securities.
| Item | 1997 | 1998 | 1999 | 2000 | 2001 | 2002 | 2003 | 2004 | 2005 | 2006 |
|---|---|---|---|---|---|---|---|---|---|---|
| Balance sheet items as a percentage of average net consolidated assets |
||||||||||
| Interest-earning assets | 91.34 | 91.38 | 91.68 | 91.50 | 91.16 | 91.36 | 91.34 | 91.56 | 91.32 | 91.06 |
| Loans and leases (net) | 62.34 | 61.23 | 61.48 | 62.15 | 62.46 | 61.46 | 61.32 | 63.33 | 65.15 | 67.05 |
| Commercial and industrial | 12.38 | 12.45 | 12.64 | 12.95 | 13.03 | 12.38 | 11.51 | 11.52 | 11.78 | 11.69 |
| U.S. addressees | 12.14 | 12.12 | 12.32 | 12.60 | 12.65 | 12.06 | 11.20 | 11.21 | 11.48 | 11.45 |
| Foreign addressees | .23 | .32 | .32 | .36 | .38 | .31 | .31 | .31 | .30 | .23 |
| Consumer | 14.36 | 12.56 | 10.79 | 10.19 | 9.76 | 8.13 | 6.79 | 6.33 | 5.42 | 5.50 |
| Credit card | 5.87 | 4.78 | 3.37 | 3.27 | 3.61 | 2.63 | 1.82 | 1.91 | 1.24 | 1.63 |
| Installment and other | 8.49 | 7.78 | 7.41 | 6.92 | 6.15 | 5.50 | 4.97 | 4.42 | 4.18 | 3.87 |
| Real estate | 33.10 | 33.83 | 35.90 | 36.93 | 37.64 | 38.92 | 40.96 | 43.38 | 45.86 | 47.88 |
| In domestic offices | 33.08 | 33.81 | 35.87 | 36.91 | 37.62 | 38.89 | 40.91 | 43.32 | 45.78 | 47.78 |
| Construction and land development | 2.68 | 2.87 | 3.48 | 4.15 | 4.90 | 5.40 | 5.89 | 7.01 | 8.86 | 10.99 |
| Farmland | .52 | .56 | .58 | .65 | .66 | .73 | .80 | .91 | .99 | 1.07 |
| One- to four-family residential | 18.08 | 18.14 | 18.26 | 17.17 | 16.18 | 15.39 | 15.71 | 15.33 | 15.17 | 14.75 |
| Home equity | 2.29 | 2.14 | 1.99 | 2.10 | 2.21 | 2.51 | 2.92 | 3.46 | 3.60 | 3.24 |
| Other | 15.78 | 16.00 | 16.26 | 15.06 | 13.97 | 12.88 | 12.79 | 11.87 | 11.57 | 11.51 |
| Multifamily residential | 1.28 | 1.25 | 1.44 | 1.58 | 1.69 | 1.83 | 2.00 | 2.24 | 2.37 | 2.32 |
| Nonfarm nonresidential | 10.52 | 10.99 | 12.12 | 13.36 | 14.18 | 15.55 | 16.51 | 17.82 | 18.39 | 18.64 |
| In foreign offices | .02 | .02 | .02 | .02 | .02 | .03 | .05 | .06 | .08 | .10 |
| To depository institutions and acceptances of other banks | .59 | .52 | .46 | .37 | .38 | .37 | .37 | .25 | .13 | .14 |
| Foreign governments | .02 | .03 | .03 | .03 | .03 | .02 | .02 | .01 | * | * |
| Agricultural production | .73 | .80 | .78 | .82 | .85 | .86 | .83 | .82 | .81 | .85 |
| Other loans | 1.47 | 1.30 | 1.25 | 1.22 | 1.22 | 1.18 | 1.25 | 1.32 | 1.36 | 1.20 |
| Lease-financing receivables | .99 | .99 | .78 | .75 | .74 | .75 | .67 | .75 | .75 | .75 |
| Less: Unearned income on loans | -.10 | -.09 | -.08 | -.08 | -.07 | -.06 | -.06 | -.06 | -.06 | -.06 |
| Less: Loss reserves 1 | -1.19 | -1.15 | -1.06 | -1.04 | -1.12 | -1.10 | -1.02 | -.98 | -.90 | -.88 |
| Securities | 23.37 | 24.18 | 25.17 | 24.34 | 22.81 | 23.86 | 24.36 | 23.59 | 21.57 | 19.65 |
| Investment account | 23.26 | 24.08 | 25.09 | 24.25 | 22.70 | 23.80 | 24.23 | 23.54 | 21.50 | 19.57 |
| Debt | 22.65 | 23.39 | 24.33 | 23.46 | 22.28 | 23.30 | 23.79 | 23.18 | 21.21 | 19.30 |
| U.S. Treasury | 4.94 | 3.91 | 2.53 | 1.81 | 1.32 | 1.22 | 1.00 | 1.02 | .83 | .60 |
| U.S. government agency and corporation obligations | 13.91 | 15.08 | 16.29 | 15.56 | 14.70 | 15.85 | 16.96 | 16.70 | 15.05 | 13.61 |
| Government-backed mortgage pools | 6.20 | 6.45 | 6.72 | 6.22 | 6.27 | 6.55 | 7.03 | 6.80 | 5.73 | 4.84 |
| Collateralized mortgage obligations | 3.00 | 3.21 | 3.52 | 3.04 | 3.08 | 3.69 | 3.69 | 3.41 | 3.16 | 2.85 |
| Other | 4.71 | 5.42 | 6.05 | 6.30 | 5.35 | 5.60 | 6.24 | 6.49 | 6.16 | 5.92 |
| State and local government | 2.43 | 2.69 | 2.91 | 2.91 | 2.90 | 2.89 | 2.95 | 2.92 | 2.78 | 2.75 |
| Private mortgage-backed securities | .59 | .65 | 1.00 | .99 | .94 | .99 | .87 | 1.08 | 1.17 | 1.10 |
| Other | .78 | 1.06 | 1.60 | 2.19 | 2.42 | 2.34 | 2.01 | 1.46 | 1.37 | 1.24 |
| Equity | .61 | .69 | .77 | .79 | .43 | .50 | .43 | .36 | .29 | .27 |
| Trading account | .10 | .11 | .08 | .09 | .11 | .06 | .14 | .05 | .08 | .07 |
| Gross federal funds sold and reverse RPs | 3.59 | 4.16 | 3.35 | 3.40 | 4.20 | 4.15 | 3.85 | 2.95 | 2.83 | 2.69 |
| Interest-bearing balances at depositories | 2.05 | 1.80 | 1.68 | 1.60 | 1.68 | 1.89 | 1.81 | 1.69 | 1.76 | 1.68 |
| Non-interest-earning assets | 8.66 | 8.62 | 8.32 | 8.50 | 8.84 | 8.64 | 8.66 | 8.44 | 8.68 | 8.94 |
| Revaluation gains held in trading accounts | * | * | .01 | .02 | .01 | .01 | * | * | * | .03 |
| Other | 8.66 | 8.62 | 8.31 | 8.49 | 8.84 | 8.64 | 8.66 | 8.44 | 8.68 | 8.91 |
| Liabilities | 90.78 | 90.55 | 90.90 | 90.95 | 90.32 | 89.93 | 89.69 | 89.18 | 89.10 | 89.00 |
| Core deposits | 64.06 | 63.87 | 62.48 | 60.80 | 60.33 | 61.26 | 61.31 | 60.40 | 59.03 | 58.03 |
| Transaction deposits | 18.05 | 16.08 | 13.94 | 12.29 | 11.48 | 11.37 | 11.50 | 11.77 | 11.15 | 9.83 |
| Demand deposits | 13.11 | 11.87 | 10.19 | 8.97 | 8.23 | 8.05 | 7.96 | 8.13 | 7.87 | 7.01 |
| Other checkable deposits | 4.94 | 4.22 | 3.75 | 3.32 | 3.25 | 3.32 | 3.54 | 3.64 | 3.28 | 2.83 |
| Savings deposits (including MMDAs) | 23.97 | 26.43 | 28.55 | 28.55 | 29.40 | 32.34 | 34.00 | 34.42 | 33.75 | 32.81 |
| Small time deposits | 22.05 | 21.36 | 19.99 | 19.96 | 19.46 | 17.55 | 15.81 | 14.20 | 14.13 | 15.39 |
| Managed liabilities 2 | 24.89 | 24.65 | 26.33 | 28.01 | 27.75 | 26.57 | 26.40 | 26.98 | 28.38 | 29.32 |
| Large time deposits | 9.68 | 10.09 | 10.30 | 11.98 | 12.60 | 12.17 | 11.92 | 12.12 | 13.64 | 15.23 |
| Deposits booked in foreign offices | 1.23 | 1.31 | 1.20 | 1.28 | 1.24 | .88 | .64 | .65 | .57 | .52 |
| Subordinated notes and debentures | .33 | .37 | .35 | .30 | .31 | .34 | .35 | .35 | .27 | .24 |
| Gross federal funds purchased and RPs | 7.06 | 6.15 | 6.90 | 6.30 | 5.77 | 5.27 | 5.35 | 5.52 | 5.54 | 5.40 |
| Other managed liabilities | 6.59 | 6.73 | 7.57 | 8.15 | 7.84 | 7.90 | 8.13 | 8.34 | 8.35 | 7.92 |
| Revaluation losses held in trading accounts | .01 | .01 | .01 | * | .01 | .01 | * | * | * | .01 |
| Other | 1.82 | 2.02 | 2.10 | 2.13 | 2.23 | 2.08 | 1.98 | 1.81 | 1.69 | 1.64 |
| Capital account | 9.22 | 9.45 | 9.10 | 9.05 | 9.68 | 10.07 | 10.31 | 10.82 | 10.90 | 11.00 |
| Memo | ||||||||||
| Commercial real estate loans 3 | 14.72 | 15.33 | 17.28 | 19.32 | 21.03 | 23.05 | 24.62 | 27.28 | 29.84 | 32.21 |
| Other real estate owned 4 | .11 | .09 | .08 | .07 | .08 | .10 | .11 | .10 | .08 | .08 |
| Mortgage-backed securities | 9.79 | 10.30 | 11.24 | 10.25 | 10.29 | 11.24 | 11.59 | 11.29 | 10.06 | 8.79 |
| Federal Home Loan Bank advances | n.a. | n.a. | n.a. | n.a. | 5.27 | 5.71 | 6.29 | 6.46 | 6.42 | 6.10 |
| Average net consolidated assets (billions of dollars) | 971 | 938 | 972 | 986 | 1,002 | 1,022 | 1,072 | 1,080 | 1,152 | 1,245 |
| Effective interest rate (percent) 5 | ||||||||||
| Rates earned | ||||||||||
| Interest-earning assets | 8.54 | 8.38 | 7.83 | 8.48 | 7.86 | 6.43 | 5.60 | 5.46 | 6.12 | 6.98 |
| Taxable equivalent | 8.63 | 8.47 | 7.92 | 8.56 | 7.94 | 6.51 | 5.68 | 5.53 | 6.19 | 7.05 |
| Loans and leases, gross | 9.53 | 9.42 | 8.74 | 9.42 | 8.76 | 7.32 | 6.57 | 6.25 | 6.90 | 7.76 |
| Net of loss provisions | 8.79 | 8.79 | 8.26 | 8.75 | 7.88 | 6.56 | 6.02 | 5.87 | 6.64 | 7.52 |
| Securities | 6.43 | 6.31 | 6.03 | 6.45 | 5.97 | 4.95 | 3.81 | 3.79 | 4.03 | 4.50 |
| Taxable equivalent | 6.69 | 6.57 | 6.29 | 6.71 | 6.25 | 5.21 | 4.06 | 4.04 | 4.28 | 4.77 |
| Investment account | 6.43 | 6.30 | 6.03 | 6.45 | 5.96 | 4.93 | 3.82 | 3.78 | 4.02 | 4.50 |
| U.S. Treasury securities and U.S. government agency obligations (excluding MBS) | n.a. | n.a. | n.a. | n.a. | 5.85 | 4.54 | 3.42 | 3.15 | 3.47 | 4.16 |
| Mortgage-backed securities | n.a. | n.a. | n.a. | n.a. | 6.33 | 5.38 | 3.95 | 4.01 | 4.23 | 4.61 |
| Other | n.a. | n.a. | n.a. | n.a. | 5.40 | 4.51 | 4.07 | 4.21 | 4.42 | 4.80 |
| Trading account | 6.37 | 6.84 | 7.33 | 9.30 | 6.60 | 14.05 | 3.07 | 10.30 | 6.59 | 4.92 |
| Gross federal funds sold and reverse RPs | 5.42 | 5.31 | 4.98 | 6.15 | 3.91 | 1.73 | 1.27 | 1.57 | 3.31 | 4.94 |
| Interest-bearing balances at depositories | 5.44 | 5.77 | 5.07 | 5.76 | 3.94 | 1.79 | 1.26 | 1.47 | 3.29 | 4.59 |
| Rates paid | ||||||||||
| Interest-bearing liabilities | 4.67 | 4.60 | 4.19 | 4.93 | 4.11 | 2.54 | 1.88 | 1.73 | 2.48 | 3.55 |
| Interest-bearing deposits | 4.34 | 4.28 | 3.84 | 4.46 | 3.82 | 2.28 | 1.61 | 1.44 | 2.09 | 3.09 |
| In foreign offices | 5.42 | 5.55 | 5.07 | 6.13 | 4.45 | 2.14 | 1.43 | 1.43 | 3.05 | 4.50 |
| In domestic offices | 4.32 | 4.25 | 3.82 | 4.43 | 3.81 | 2.28 | 1.61 | 1.44 | 2.08 | 3.08 |
| Other checkable deposits | 2.17 | 2.15 | 1.99 | 2.27 | 1.81 | 1.06 | .74 | .72 | 1.18 | 1.73 |
| Savings deposits (including MMDAs) | 3.08 | 2.96 | 2.65 | 3.07 | 2.22 | 1.17 | .76 | .74 | 1.27 | 2.05 |
| Large time deposits 6 | 5.56 | 5.51 | 5.17 | 6.00 | 5.27 | 3.34 | 2.58 | 2.33 | 3.21 | 4.39 |
| Other time deposits 6 | 5.57 | 5.64 | 5.11 | 5.74 | 5.51 | 3.77 | 2.86 | 2.51 | 3.10 | 4.16 |
| Gross federal funds purchased and RPs | 5.20 | 5.14 | 4.82 | 5.95 | 3.83 | 1.83 | 1.29 | 1.45 | 2.94 | 4.51 |
| Other interest-bearing liabilities | 6.08 | 5.99 | 5.36 | 6.45 | 5.41 | 4.17 | 3.60 | 3.37 | 4.00 | 4.74 |
| Income and expense as a percentage of average net consolidated assets |
||||||||||
| Gross interest income | 7.79 | 7.66 | 7.19 | 7.79 | 7.16 | 5.85 | 5.08 | 4.99 | 5.57 | 6.37 |
| Taxable equivalent | 7.87 | 7.74 | 7.27 | 7.86 | 7.24 | 5.93 | 5.16 | 5.06 | 5.64 | 6.44 |
| Loans | 6.05 | 5.89 | 5.47 | 5.96 | 5.59 | 4.57 | 4.08 | 4.01 | 4.55 | 5.27 |
| Securities | 1.49 | 1.50 | 1.51 | 1.58 | 1.33 | 1.15 | .91 | .88 | .86 | .89 |
| Gross federal funds sold and reverse RPs | .19 | .22 | .17 | .21 | .16 | .07 | .05 | .05 | .09 | .13 |
| Other | .06 | .06 | .04 | .04 | .08 | .06 | .05 | .05 | .07 | .09 |
| Gross interest expense | 3.47 | 3.45 | 3.20 | 3.79 | 3.14 | 1.92 | 1.41 | 1.29 | 1.84 | 2.66 |
| Deposits | 2.69 | 2.70 | 2.44 | 2.87 | 2.48 | 1.49 | 1.04 | .92 | 1.34 | 2.03 |
| Gross federal funds purchased and RPs | .37 | .32 | .34 | .38 | .22 | .09 | .07 | .08 | .16 | .24 |
| Other | .42 | .42 | .42 | .54 | .44 | .34 | .30 | .29 | .34 | .39 |
| Net interest income | 4.32 | 4.22 | 3.99 | 4.00 | 4.02 | 3.93 | 3.68 | 3.70 | 3.73 | 3.72 |
| Taxable equivalent | 4.39 | 4.29 | 4.07 | 4.07 | 4.10 | 4.00 | 3.75 | 3.77 | 3.79 | 3.78 |
| Loss provisions 7 | .58 | .49 | .39 | .52 | .65 | .55 | .40 | .30 | .24 | .23 |
| Non-interest income | 2.07 | 2.26 | 2.31 | 2.35 | 2.37 | 2.37 | 2.31 | 2.26 | 2.02 | 1.98 |
| Service charges on deposits | .40 | .39 | .38 | .36 | .39 | .41 | .41 | .39 | .36 | .35 |
| Fiduciary activities | .32 | .37 | .38 | .44 | .40 | .35 | .34 | .37 | .35 | .30 |
| Trading revenue | .01 | .02 | .02 | .01 | * | * | .01 | .01 | .01 | .01 |
| Interest rate exposures | .01 | .01 | .01 | .01 | -.01 | * | .01 | .01 | .01 | * |
| Foreign exchange rate exposures | * | * | * | * | * | * | * | * | * | * |
| Other commodity and equity exposures | * | * | * | * | * | * | * | * | * | * |
| Other | 1.34 | 1.49 | 1.53 | 1.55 | 1.58 | 1.61 | 1.55 | 1.49 | 1.30 | 1.32 |
| Non-interest expense | 3.73 | 3.86 | 3.70 | 3.84 | 3.88 | 3.73 | 3.60 | 3.54 | 3.37 | 3.34 |
| Salaries, wages, and employee benefits | 1.50 | 1.56 | 1.56 | 1.59 | 1.61 | 1.64 | 1.64 | 1.64 | 1.61 | 1.58 |
| Occupancy | .46 | .47 | .47 | .47 | .46 | .45 | .43 | .43 | .41 | .40 |
| Other | 1.77 | 1.83 | 1.68 | 1.78 | 1.81 | 1.64 | 1.53 | 1.47 | 1.36 | 1.35 |
| Net non-interest expense | 1.66 | 1.60 | 1.39 | 1.48 | 1.52 | 1.36 | 1.29 | 1.29 | 1.35 | 1.36 |
| Gains on investment account securities | .02 | .04 | -.01 | -.04 | .05 | .04 | .05 | .02 | -.01 | -.01 |
| Income before taxes and extraordinary items | 2.10 | 2.16 | 2.20 | 1.96 | 1.90 | 2.06 | 2.03 | 2.13 | 2.13 | 2.12 |
| Taxes | .73 | .74 | .74 | .67 | .66 | .67 | .66 | .68 | .68 | .69 |
| Extraordinary items, net of income taxes | * | .06 | .01 | * | .01 | * | .03 | * | * | * |
| Net income | 1.37 | 1.47 | 1.47 | 1.29 | 1.25 | 1.38 | 1.39 | 1.45 | 1.45 | 1.43 |
| Cash dividends declared | 1.10 | 1.01 | 1.06 | .92 | 1.33 | 1.19 | 1.64 | .78 | .87 | .89 |
| Retained income | .28 | .46 | .40 | .37 | -.08 | .19 | -.25 | .68 | .58 | .54 |
| Memo | ||||||||||
| Return on equity | 14.89 | 15.60 | 16.11 | 14.21 | 12.93 | 13.75 | 13.53 | 13.42 | 13.33 | 13.02 |
Note: Data are as of April 13, 2007
1. Includes allocated transfer risk reserve. Return to table
2. Measured as the sum of large time deposits in domestic offices, deposits booked in foreign offices, subordinated notes and debentures, federal funds purchased and securities sold under repurchase agreements, Federal Home Loan Bank advances, and other borrowed money. Return to table
3. Measured as the sum of construction and land development loans secured by real estate; real estate loans secured by nonfarm nonresidential properties or by multifamily residential properties; and loans to finance commercial real estate, construction, and land development activities not secured by real estate. Return to table
4. Other real estate owned is a component of other non-interest-earning assets. Return to table
5. When possible, based on the average of quarterly balance sheet data reported on schedule RC-K of the quarterly Call Report. Return to table
6. Before 1997, large time deposit open accounts were included in other time deposits. Return to table
7. Includes provisions for allocated transfer risk. Return to table
* In absolute value, less than 0.005 percent.
n.a. Not available.
MMDA Money market deposit account.
RP Repurchase agreement.
MBS Mortgage-backed securities.
| Item | 1997 | 1998 | 1999 | 2000 | 2001 | 2002 | 2003 | 2004 | 2005 | 2006 |
|---|---|---|---|---|---|---|---|---|---|---|
| Balance sheet items as a percentage of average net consolidated assets |
||||||||||
| Interest-earning assets | 92.45 | 92.64 | 92.55 | 92.52 | 92.26 | 92.22 | 92.14 | 92.34 | 92.30 | 92.37 |
| Loans and leases (net) | 58.75 | 59.11 | 59.76 | 62.31 | 62.67 | 62.72 | 62.32 | 63.80 | 65.44 | 66.65 |
| Commercial and industrial | 10.16 | 10.33 | 10.64 | 11.09 | 11.10 | 10.71 | 10.42 | 10.29 | 10.21 | 10.17 |
| U.S. addressees | 10.08 | 10.25 | 10.55 | 11.02 | 11.02 | 10.64 | 10.37 | 10.25 | 10.15 | 10.13 |
| Foreign addressees | .08 | .08 | .08 | .07 | .08 | .06 | .05 | .04 | .06 | .05 |
| Consumer | 8.98 | 8.46 | 8.17 | 7.98 | 7.42 | 6.77 | 6.16 | 5.45 | 4.97 | 4.63 |
| Credit card | .85 | .70 | .69 | .59 | .57 | .49 | .51 | .40 | .36 | .38 |
| Installment and other | 8.14 | 7.76 | 7.47 | 7.39 | 6.85 | 6.28 | 5.64 | 5.05 | 4.61 | 4.25 |
| Real estate | 35.55 | 36.04 | 36.83 | 39.29 | 40.30 | 41.52 | 42.30 | 44.75 | 46.98 | 48.53 |
| In domestic offices | 35.55 | 36.04 | 36.83 | 39.29 | 40.30 | 41.52 | 42.30 | 44.75 | 46.98 | 48.53 |
| Construction and land development | 2.82 | 3.02 | 3.28 | 3.70 | 4.23 | 4.51 | 4.99 | 6.01 | 7.46 | 9.10 |
| Farmland | 2.69 | 2.83 | 2.95 | 3.06 | 3.04 | 3.08 | 3.13 | 3.22 | 3.25 | 3.26 |
| One- to four-family residential | 18.16 | 18.04 | 17.66 | 18.43 | 18.24 | 17.91 | 17.08 | 17.17 | 17.12 | 16.70 |
| Home equity | 1.24 | 1.21 | 1.17 | 1.28 | 1.37 | 1.62 | 1.79 | 2.11 | 2.20 | 2.06 |
| Other | 16.92 | 16.83 | 16.49 | 17.15 | 16.87 | 16.29 | 15.29 | 15.06 | 14.93 | 14.63 |
| Multifamily residential | .95 | .93 | .98 | 1.04 | 1.06 | 1.16 | 1.28 | 1.41 | 1.48 | 1.47 |
| Nonfarm nonresidential | 10.93 | 11.22 | 11.96 | 13.06 | 13.71 | 14.86 | 15.82 | 16.94 | 17.66 | 18.01 |
| In foreign offices | * | * | * | * | * | * | * | * | * | * |
| To depository institutions and acceptances of other banks | .20 | .14 | .14 | .12 | .12 | .10 | .09 | .07 | .05 | .05 |
| Foreign governments | * | * | .01 | .01 | * | * | * | * | * | * |
| Agricultural production | 4.05 | 4.27 | 4.06 | 3.85 | 3.76 | 3.64 | 3.40 | 3.26 | 3.21 | 3.22 |
| Other loans | .67 | .67 | .67 | .69 | .67 | .65 | .66 | .68 | .70 | .70 |
| Lease-financing receivables | .25 | .24 | .26 | .27 | .27 | .31 | .26 | .25 | .24 | .26 |
| Less: Unearned income on loans | -.24 | -.20 | -.15 | -.11 | -.09 | -.07 | -.06 | -.06 | -.05 | -.05 |
| Less: Loss reserves 1 | -.87 | -.86 | -.87 | -.88 | -.88 | -.90 | -.92 | -.89 | -.87 | -.87 |
| Securities | 28.24 | 26.70 | 26.91 | 25.40 | 22.80 | 23.34 | 23.47 | 23.34 | 21.92 | 20.55 |
| Investment account | 28.21 | 26.66 | 26.88 | 25.38 | 22.79 | 23.33 | 23.43 | 23.33 | 21.90 | 20.53 |
| Debt | 27.68 | 26.12 | 26.34 | 24.82 | 22.49 | 23.05 | 23.12 | 23.07 | 21.70 | 20.35 |
| U.S. Treasury | 6.70 | 5.05 | 3.34 | 2.12 | 1.33 | 1.04 | .90 | .81 | .71 | .61 |
| U.S. government agency and corporation obligations | 15.58 | 15.43 | 16.89 | 16.95 | 15.27 | 16.07 | 16.23 | 16.57 | 15.64 | 14.73 |
| Government-backed mortgage pools | 4.01 | 3.90 | 3.95 | 3.47 | 3.78 | 4.54 | 4.84 | 4.76 | 4.23 | 3.62 |
| Collateralized mortgage obligations | 2.19 | 2.02 | 2.00 | 1.70 | 1.94 | 2.30 | 2.20 | 1.96 | 1.70 | 1.50 |
| Other | 9.38 | 9.51 | 10.93 | 11.78 | 9.56 | 9.23 | 9.19 | 9.85 | 9.70 | 9.61 |
| State and local government | 4.60 | 4.80 | 4.96 | 4.64 | 4.51 | 4.56 | 4.73 | 4.67 | 4.49 | 4.30 |
| Private mortgage-backed securities | .19 | .16 | .26 | .23 | .27 | .26 | .21 | .19 | .22 | .24 |
| Other | .61 | .68 | .89 | .88 | 1.11 | 1.12 | 1.05 | .83 | .65 | .48 |
| Equity | .52 | .54 | .53 | .56 | .30 | .27 | .31 | .26 | .20 | .17 |
| Trading account | .03 | .04 | .03 | .02 | .01 | .01 | .04 | .01 | .02 | .02 |
| Gross federal funds sold and reverse RPs | 3.95 | 5.13 | 4.17 | 3.22 | 5.01 | 4.26 | 4.27 | 3.33 | 3.24 | 3.53 |
| Interest-bearing balances at depositories | 1.49 | 1.72 | 1.71 | 1.59 | 1.78 | 1.90 | 2.08 | 1.86 | 1.70 | 1.65 |
| Non-interest-earning assets | 7.55 | 7.36 | 7.45 | 7.48 | 7.74 | 7.78 | 7.86 | 7.66 | 7.70 | 7.63 |
| Revaluation gains held in trading accounts | * | * | * | * | * | * | * | * | * | * |
| Other | 7.55 | 7.36 | 7.45 | 7.48 | 7.74 | 7.78 | 7.86 | 7.66 | 7.70 | 7.63 |
| Liabilities | 89.63 | 89.54 | 89.75 | 89.88 | 89.59 | 89.73 | 89.58 | 89.55 | 89.49 | 89.35 |
| Core deposits | 74.58 | 73.75 | 72.74 | 70.87 | 69.92 | 70.04 | 69.97 | 69.24 | 67.68 | 65.74 |
| Transaction deposits | 24.48 | 24.26 | 23.87 | 23.20 | 22.35 | 22.66 | 23.18 | 23.36 | 22.71 | 20.81 |
| Demand deposits | 13.09 | 13.08 | 12.80 | 12.64 | 12.16 | 12.24 | 12.58 | 12.77 | 12.76 | 11.97 |
| Other checkable deposits | 11.39 | 11.18 | 11.07 | 10.57 | 10.19 | 10.42 | 10.60 | 10.59 | 9.95 | 8.84 |
| Savings deposits (including MMDAs) | 19.00 | 19.05 | 19.77 | 19.19 | 19.38 | 21.32 | 22.43 | 23.24 | 22.98 | 22.65 |
| Small time deposits | 31.10 | 30.43 | 29.10 | 28.48 | 28.19 | 26.05 | 24.36 | 22.64 | 21.98 | 22.27 |
| Managed liabilities 2 | 14.02 | 14.76 | 16.09 | 18.08 | 18.67 | 18.79 | 18.78 | 19.57 | 21.04 | 22.77 |
| Large time deposits | 10.51 | 11.11 | 11.52 | 12.51 | 13.55 | 13.21 | 13.07 | 13.16 | 14.53 | 16.50 |
| Deposits booked in foreign offices | .10 | .07 | .08 | .05 | .06 | .07 | .06 | .07 | .06 | .06 |
| Subordinated notes and debentures | .01 | .01 | .01 | .02 | .02 | .04 | .03 | .04 | .03 | .03 |
| Gross federal funds purchased and RPs | 1.67 | 1.49 | 1.79 | 2.06 | 1.55 | 1.51 | 1.52 | 1.76 | 1.74 | 1.82 |
| Other managed liabilities | 1.73 | 2.08 | 2.69 | 3.44 | 3.49 | 3.96 | 4.09 | 4.54 | 4.68 | 4.36 |
| Revaluation losses held in trading accounts | * | * | * | * | * | * | * | * | * | * |
| Other | 1.02 | 1.03 | .92 | .93 | 1.00 | .90 | .84 | .74 | .77 | .84 |
| Capital account | 10.37 | 10.46 | 10.25 | 10.12 | 10.41 | 10.27 | 10.42 | 10.45 | 10.51 | 10.65 |
| Memo | ||||||||||
| Commercial real estate loans 3 | 14.80 | 15.27 | 16.33 | 17.91 | 19.15 | 20.67 | 22.23 | 24.50 | 26.77 | 28.80 |
| Other real estate owned 4 | .16 | .13 | .11 | .11 | .12 | .14 | .15 | .14 | .13 | .12 |
| Mortgage-backed securities | 6.39 | 6.07 | 6.22 | 5.39 | 5.99 | 7.10 | 7.25 | 6.91 | 6.15 | 5.36 |
| Federal Home Loan Bank advances | n.a. | n.a. | n.a. | n.a. | 3.34 | 3.71 | 3.87 | 4.32 | 4.47 | 4.14 |
| Average net consolidated assets (billions of dollars) | 647 | 644 | 652 | 655 | 675 | 704 | 742 | 768 | 805 | 839 |
| Effective interest rate (percent) 5 | ||||||||||
| Rates earned | ||||||||||
| Interest-earning assets | 8.50 | 8.35 | 8.05 | 8.44 | 7.94 | 6.79 | 5.94 | 5.73 | 6.23 | 7.01 |
| Taxable equivalent | 8.63 | 8.48 | 8.18 | 8.56 | 8.05 | 6.91 | 6.05 | 5.84 | 6.33 | 7.10 |
| Loans and leases, gross | 9.80 | 9.69 | 9.28 | 9.51 | 9.03 | 7.83 | 7.08 | 6.72 | 7.17 | 7.95 |
| Net of loss provisions | 9.49 | 9.35 | 8.89 | 9.14 | 8.59 | 7.39 | 6.72 | 6.45 | 6.94 | 7.75 |
| Securities | 6.26 | 6.04 | 5.88 | 6.15 | 5.86 | 5.03 | 3.87 | 3.74 | 3.87 | 4.28 |
| Taxable equivalent | 6.65 | 6.46 | 6.29 | 6.54 | 6.28 | 5.43 | 4.26 | 4.11 | 4.24 | 4.65 |
| Investment account | 6.26 | 6.04 | 5.89 | 6.15 | 5.86 | 5.02 | 3.87 | 3.73 | 3.87 | 4.28 |
| U.S. Treasury securities and U.S. government agency obligations (excluding MBS) | n.a. | n.a. | n.a. | n.a. | 5.97 | 4.80 | 3.74 | 3.39 | 3.53 | 4.12 |
| Mortgage-backed securities | n.a. | n.a. | n.a. | n.a. | 6.20 | 5.47 | 3.58 | 3.90 | 4.17 | 4.59 |
| Other | n.a. | n.a. | n.a. | n.a. | 5.29 | 4.87 | 4.43 | 4.18 | 4.16 | 4.25 |
| Trading account | 6.33 | 5.26 | 3.60 | 4.01 | 6.43 | 15.38 | 2.89 | 18.95 | 7.52 | 7.19 |
| Gross federal funds sold and reverse RPs | 5.51 | 5.36 | 4.96 | 6.24 | 3.83 | 1.63 | 1.08 | 1.32 | 3.21 | 4.95 |
| Interest-bearing balances at depositories | 5.62 | 5.67 | 5.69 | 6.38 | 4.56 | 2.68 | 1.97 | 2.03 | 3.21 | 4.65 |
| Rates paid | ||||||||||
| Interest-bearing liabilities | 4.60 | 4.60 | 4.28 | 4.80 | 4.40 | 2.92 | 2.13 | 1.87 | 2.43 | 3.43 |
| Interest-bearing deposits | 4.54 | 4.53 | 4.22 | 4.67 | 4.32 | 2.78 | 2.02 | 1.75 | 2.29 | 3.28 |
| In foreign offices | 4.77 | 5.08 | 4.34 | 5.13 | 3.97 | 1.67 | .85 | 1.04 | 2.86 | 4.27 |
| In domestic offices | 4.53 | 4.52 | 4.22 | 4.67 | 4.32 | 2.78 | 2.02 | 1.75 | 2.29 | 3.28 |
| Other checkable deposits | 2.46 | 2.44 | 2.28 | 2.47 | 1.97 | 1.16 | .78 | .69 | 1.00 | 1.45 |
| Savings deposits (including MMDAs) | 3.36 | 3.39 | 3.21 | 3.56 | 2.81 | 1.72 | 1.13 | 1.05 | 1.53 | 2.34 |
| Large time deposits 6 | 5.53 | 5.53 | 5.21 | 5.89 | 5.53 | 3.62 | 2.78 | 2.47 | 3.21 | 4.37 |
| Other time deposits 6 | 5.66 | 5.63 | 5.25 | 5.70 | 5.60 | 3.88 | 2.96 | 2.55 | 3.04 | 4.12 |
| Gross federal funds purchased and RPs | 5.22 | 4.99 | 4.73 | 5.69 | 3.92 | 1.85 | 1.31 | 1.45 | 2.89 | 4.37 |
| Other interest-bearing liabilities | 6.32 | 6.45 | 5.64 | 6.24 | 5.74 | 5.31 | 4.06 | 3.68 | 4.02 | 4.70 |
| Income and expense as a percentage of average net consolidated assets |
||||||||||
| Gross interest income | 7.90 | 7.75 | 7.48 | 7.83 | 7.35 | 6.31 | 5.46 | 5.32 | 5.78 | 6.50 |
| Taxable equivalent | 8.02 | 7.87 | 7.61 | 7.95 | 7.45 | 6.41 | 5.56 | 5.42 | 5.88 | 6.58 |
| Loans | 5.86 | 5.80 | 5.62 | 5.99 | 5.75 | 5.01 | 4.47 | 4.35 | 4.76 | 5.35 |
| Securities | 1.76 | 1.59 | 1.58 | 1.57 | 1.32 | 1.16 | .89 | .87 | .85 | .88 |
| Gross federal funds sold and reverse RPs | .24 | .29 | .22 | .21 | .20 | .07 | .05 | .05 | .11 | .18 |
| Other | .04 | .06 | .06 | .05 | .08 | .06 | .06 | .05 | .06 | .08 |
| Gross interest expense | 3.48 | 3.46 | 3.26 | 3.64 | 3.34 | 2.22 | 1.60 | 1.41 | 1.82 | 2.56 |
| Deposits | 3.28 | 3.25 | 3.02 | 3.30 | 3.08 | 1.98 | 1.42 | 1.22 | 1.58 | 2.27 |
| Gross federal funds purchased and RPs | .08 | .07 | .08 | .12 | .06 | .03 | .02 | .02 | .05 | .08 |
| Other | .11 | .13 | .15 | .21 | .20 | .21 | .17 | .17 | .19 | .21 |
| Net interest income | 4.42 | 4.29 | 4.23 | 4.20 | 4.01 | 4.08 | 3.86 | 3.91 | 3.96 | 3.94 |
| Taxable equivalent | 4.54 | 4.41 | 4.35 | 4.31 | 4.12 | 4.19 | 3.96 | 4.00 | 4.05 | 4.03 |
| Loss provisions 7 | .27 | .29 | .31 | .32 | .36 | .35 | .29 | .23 | .21 | .20 |
| Non-interest income | 1.41 | 1.52 | 1.44 | 1.32 | 1.31 | 1.39 | 1.47 | 1.38 | 1.34 | 1.31 |
| Service charges on deposits | .44 | .42 | .42 | .43 | .44 | .45 | .43 | .43 | .40 | .38 |
| Fiduciary activities | .20 | .23 | .26 | .21 | .25 | .27 | .28 | .32 | .33 | .37 |
| Trading revenue | * | * | * | .01 | * | * | * | * | * | * |
| Interest rate exposures | * | * | * | * | * | * | * | * | * | * |
| Foreign exchange rate exposures | * | * | * | * | * | * | * | * | * | * |
| Other commodity and equity exposures | * | * | * | * | * | * | * | * | * | * |
| Other | .77 | .86 | .75 | .68 | .62 | .67 | .76 | .64 | .61 | .56 |
| Non-interest expense | 3.69 | 3.74 | 3.73 | 3.58 | 3.55 | 3.57 | 3.56 | 3.52 | 3.49 | 3.49 |
| Salaries, wages, and employee benefits | 1.80 | 1.82 | 1.82 | 1.78 | 1.79 | 1.82 | 1.82 | 1.81 | 1.79 | 1.82 |
| Occupancy | .49 | .49 | .49 | .47 | .47 | .46 | .45 | .45 | .44 | .43 |
| Other | 1.40 | 1.43 | 1.42 | 1.32 | 1.29 | 1.28 | 1.28 | 1.26 | 1.25 | 1.24 |
| Net non-interest expense | 2.28 | 2.23 | 2.29 | 2.26 | 2.24 | 2.18 | 2.09 | 2.14 | 2.15 | 2.18 |
| Gains on investment account securities | .01 | .02 | * | -.01 | .04 | .05 | .04 | .01 | * | -.01 |
| Income before taxes and extraordinary items | 1.89 | 1.79 | 1.62 | 1.61 | 1.45 | 1.60 | 1.53 | 1.55 | 1.60 | 1.55 |
| Taxes | .59 | .53 | .47 | .45 | .39 | .41 | .38 | .37 | .38 | .36 |
| Extraordinary items, net of income taxes | * | * | * | * | * | -.01 | * | * | * | * |
| Net income | 1.30 | 1.26 | 1.15 | 1.17 | 1.06 | 1.18 | 1.14 | 1.17 | 1.21 | 1.19 |
| Cash dividends declared | .74 | .82 | .70 | .79 | .64 | .68 | .67 | .64 | .67 | .65 |
| Retained income | .56 | .44 | .45 | .38 | .42 | .49 | .47 | .54 | .54 | .54 |
| Memo | ||||||||||
| Return on equity | 12.53 | 12.02 | 11.26 | 11.52 | 10.17 | 11.46 | 10.97 | 11.24 | 11.54 | 11.17 |
Note: Data are as of April 13, 2007
1. Includes allocated transfer risk reserve. Return to table
2. Measured as the sum of large time deposits in domestic offices, deposits booked in foreign offices, subordinated notes and debentures, federal funds purchased and securities sold under repurchase agreements, Federal Home Loan Bank advances, and other borrowed money. Return to table
3. Measured as the sum of construction and land development loans secured by real estate; real estate loans secured by nonfarm nonresidential properties or by multifamily residential properties; and loans to finance commercial real estate, construction, and land development activities not secured by real estate. Return to table
4. Other real estate owned is a component of other non-interest-earning assets. Return to table
5. When possible, based on the average of quarterly balance sheet data reported on schedule RC-K of the quarterly Call Report. Return to table
6. Before 1997, large time deposit open accounts were included in other time deposits. Return to table
7. Includes provisions for allocated transfer risk. Return to table
* In absolute value, less than 0.005 percent.
n.a. Not available.
MMDA Money market deposit account.
RP Repurchase agreement.
MBS Mortgage-backed securities.
| Item | 1997 | 1998 | 1999 | 2000 | 2001 | 2002 | 2003 | 2004 | 2005 | 2006 |
|---|---|---|---|---|---|---|---|---|---|---|
| Gross interest income | 338,869 | 359,536 | 366,144 | 423,846 | 404,406 | 349,731 | 329,334 | 349,721 | 427,976 | 550,644 |
| Taxable equivalent | 341,303 | 362,000 | 368,771 | 426,481 | 407,093 | 352,478 | 332,116 | 352,705 | 430,930 | 553,898 |
| Loans | 256,144 | 271,300 | 278,539 | 326,804 | 311,664 | 269,519 | 257,813 | 269,509 | 328,296 | 421,619 |
| Securities | 52,660 | 56,599 | 62,117 | 67,667 | 63,089 | 59,315 | 53,317 | 58,579 | 65,868 | 78,848 |
| Gross federal funds sold and reverse repurchase agreements | 13,659 | 15,001 | 12,331 | 13,546 | 12,649 | 6,223 | 5,015 | 5,142 | 11,045 | 21,240 |
| Other | 16,406 | 16,637 | 13,155 | 15,829 | 17,006 | 14,672 | 13,189 | 16,490 | 22,764 | 28,936 |
| Gross interest expense | 164,693 | 178,162 | 174,946 | 222,161 | 188,799 | 118,778 | 94,140 | 98,544 | 162,504 | 263,170 |
| Deposits | 117,351 | 125,218 | 119,665 | 151,147 | 132,352 | 81,733 | 62,403 | 63,642 | 105,925 | 173,743 |
| Gross federal funds purchased and repurchase agreements | 20,439 | 22,182 | 21,130 | 26,860 | 19,590 | 9,920 | 7,590 | 8,842 | 19,161 | 33,722 |
| Other | 26,903 | 30,760 | 34,149 | 44,155 | 36,854 | 27,126 | 24,147 | 26,059 | 37,419 | 55,705 |
| Net interest income | 174,176 | 181,374 | 191,198 | 201,685 | 215,607 | 230,953 | 235,194 | 251,177 | 265,472 | 287,474 |
| Taxable equivalent | 176,610 | 183,838 | 193,825 | 204,320 | 218,294 | 233,700 | 237,976 | 254,161 | 268,426 | 290,728 |
| Loss provisions | 19,402 | 21,403 | 21,186 | 29,386 | 43,238 | 45,278 | 32,766 | 23,895 | 25,580 | 25,249 |
| Non-interest income | 105,640 | 124,051 | 144,430 | 153,163 | 160,925 | 168,281 | 183,887 | 187,988 | 200,405 | 223,059 |
| Service charges on deposits | 18,558 | 19,770 | 21,497 | 23,720 | 26,873 | 29,630 | 31,693 | 33,456 | 33,831 | 36,161 |
| Fiduciary activities | 16,584 | 19,268 | 20,502 | 22,220 | 21,989 | 21,404 | 22,456 | 25,102 | 26,387 | 28,342 |
| Trading revenue | 8,018 | 7,693 | 10,429 | 12,235 | 12,382 | 10,748 | 11,605 | 10,303 | 14,375 | 19,172 |
| Other | 62,480 | 77,319 | 92,001 | 94,988 | 99,679 | 106,501 | 118,133 | 119,128 | 125,810 | 139,386 |
| Non-interest expense | 171,063 | 194,118 | 204,634 | 216,434 | 226,027 | 230,293 | 243,290 | 263,349 | 274,142 | 294,744 |
| Salaries, wages, and employee benefits | 72,348 | 79,548 | 86,153 | 89,038 | 94,209 | 100,454 | 108,460 | 115,271 | 124,041 | 135,800 |
| Occupancy | 22,080 | 24,164 | 25,866 | 26,766 | 27,945 | 29,316 | 31,317 | 33,256 | 35,052 | 36,366 |
| Other | 76,634 | 90,405 | 92,616 | 100,631 | 103,875 | 100,521 | 103,512 | 114,823 | 115,049 | 122,577 |
| Net non-interest expense | 65,423 | 70,067 | 60,204 | 63,271 | 65,102 | 62,012 | 59,403 | 75,361 | 73,737 | 71,685 |
| Gains on investment account securities | 1,825 | 3,090 | 250 | -2,280 | 4,625 | 6,411 | 5,633 | 3,393 | -220 | -1,232 |
| Income before taxes | 91,178 | 92,995 | 110,056 | 106,745 | 111,891 | 130,076 | 148,656 | 155,317 | 165,934 | 189,309 |
| Taxes | 32,001 | 31,957 | 39,211 | 37,250 | 37,284 | 42,817 | 48,530 | 50,267 | 53,568 | 61,082 |
| Extraordinary items, net of income taxes | 56 | 506 | 169 | -31 | -324 | -78 | 427 | 59 | 241 | 2,652 |
| Net income | 59,232 | 61,542 | 71,013 | 69,464 | 74,284 | 87,181 | 100,554 | 105,108 | 112,606 | 130,880 |
| Cash dividends declared | 42,801 | 41,205 | 52,102 | 52,547 | 54,844 | 67,230 | 77,757 | 59,539 | 64,622 | 82,296 |
| Retained income | 16,430 | 20,337 | 18,912 | 16,917 | 19,438 | 19,951 | 22,798 | 45,568 | 47,984 | 48,584 |
Note: Data are as of April 13, 2007.