
Household Response to the 2008 Tax Rebates:
Survey Evidence and Aggregate Implications*
Keywords: Tax rebates, marginal propensity to consume, survey responses
Abstract:
Only about one-fifth of respondents in the Reuters/University of Michigan survey report that the 2008 tax rebates led them to mostly increase spending, while over half said it would lead them to mostly pay off debt. Of those in the mostly-spend category, the response was swift, with over 80 percent reporting increasing their spending within three months of receiving their rebate. Older households, households with higher wealth and higher income, and those expecting future income growth were generally more likely to spend the rebates. A review of other surveys confirms the general pattern of results and suggests that small changes in survey design do not have a major effect on the distribution of responses.
The distribution of survey answers corresponds to an aggregate MPC after one year of about one-third. The paper combines this survey-based estimate of the MPC and the survey-based estimate of the timing of spending to show that the rebates help explain the aggregate movements in saving, spending, and debt in 2008. Because the rebate was large and distributed over a short period, we estimate that it had a non-trivial effect on total spending in the second and third quarters of 2008. Nonetheless, the results imply that the rebates provided only a modest stimulus to spending per dollar of rebate.
1. Introduction
Since the start of the recession in early 2008, various measures have been enacted with the aim of stimulating consumer spending. These include one-time stimulus payments, lowered income tax withholding, and extended unemployment benefits. These actions have renewed the debate among policymakers and academics about the effects of fiscal stimulus and, in particular, the impact on aggregate spending of the alternative policies. The life-cycle/permanent income theory suggests that, in response to such temporary increases in income, consumers should increase their spending only by the annuity value of the one-time stimulus payments. Indeed, under Ricardian equivalence forward-looking households might not increase their spending at all because they anticipate the future tax increases needed to offset the countercyclical tax decreases. Thus, the increase in spending in any given quarter due to stimulus payments or other temporary boosts to income from fiscal policy might be small. For a variety of reasons--including borrowing constraints, myopia, preferences that are biased toward present consumption, and rule-of-thumb spending of current income--households might, however, spend a larger fraction of a temporary boost to income. Indeed, analyses of similar government programs in the past using a variety of methodological approaches have generally found a non-trivial positive marginal propensity to consume (MPC). The exact magnitude and timing of the spending response to a temporary boost to income have not been settled. Moreover, the MPC might vary across individuals or depend on prevailing economic conditions. Especially now that such polices have become common in countercyclical economic policy, it is valuable to study the effects of different episodes of economic policy.
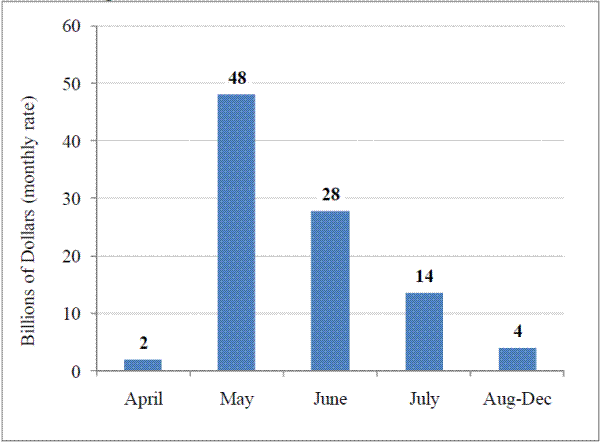
In this paper, we estimate the effects on consumer spending of the $96 billion in one-time stimulus payments that households received as part of the Economic Stimulus Act of 2008 beginning in late April of 2008. Although these stimulus payments were not directly tied to tax liabilities, we will follow the common parlance and refer to them as "tax rebates." Of those eligible, single individuals received between $300 and $600, and married couples received between $600 and $1,200. Those with dependent children received an additional $300 per child. A broad group of households--those with an income tax liability or those with at least $3,000 of qualifying income--were eligible for the 2008 rebate. Qualifying income included forms of income that are not fully taxable, such as Social Security benefits. The rebate was phased out at higher income levels by reducing the payment by 5 percent of any income above $75,000 for single filers and $150,000 for joint filers and was first applied to any outstanding federal debts (such as student loans and child support).1 In total, about 120 million individuals received a rebate in 2008. Treasury distributed the rebates electronically (direct deposit) if it had taxpayer bank account information. Otherwise, it mailed a paper check. Conditional on the form of the payment, the exact timing of the payment depended on the recipient's Social Security number. The payments, in particular the electronic fund transfers, were distributed quickly.2 Before the payments, all eligible households were sent a letter from the U.S. Treasury stating the amount of their forthcoming rebate. Figure 1 shows the total amount of rebate income paid out by Treasury each month in 2008.3 These stimulus payments were large and were disbursed quite quickly. They amounted to approximately 0.8 percent of 2008 personal income and 8.7 percent of 2008 Federal personal tax payments. Most of the payments were disbursed in May and June.
We analyze responses from households in the Reuters/University of Michigan Survey of Consumers to study the effects of the 2008 rebates. In particular, households were asked whether "the tax rebate [will] lead you mostly to increase spending, mostly to increase saving, or mostly to pay off debt?" The survey includes questions designed to characterize the type of spending or debt repayment and the timing of spending, as well as assess the validity of the survey responses. In summary, the survey results suggest that roughly one-third of the rebate income was spent in 2008 and that the spending response was concentrated in the first few months after receipt. We also show that the survey-based estimates of rebate spending are consistent with aggregate data on spending and debt.
The plan of the paper is as follows. In the next section we explore the survey responses--the basic response patterns, systematic variation across households, and the translation of the survey responses to aggregate effects. Section 3 then examines the survey-based estimates in the context of aggregate statistics and uses a standard consumption model to assess the counterfactual level of spending in the absence of rebates. In Section 4 we discuss other survey evidence on the behavioral response to the 2008 rebates. The final section concludes and offers some general remarks on fiscal policy and the role of the rebates in the pattern of aggregate demand in 2008.
2. Survey Evidence on the Spending Response to the 2008 Rebates
In this section, we discuss the responses to questions we fielded in the Reuters/University of Michigan Survey of Consumers.4 Similar questions have been used to study the changes in income tax withholding in 1992 (Shapiro and Slemrod, 1995) and the income tax rebates of 2001 (Shapiro and Slemrod, 2003a, 2003b). We fielded questions pertaining to the 2008 economic stimulus payments in February through June 2008, and again in November and December 2008. Shapiro and Slemrod (2009) present an analysis of the February through June 2008 survey results. This paper will focus on the November and December 2008 results, but also brings to bear evidence from the surveys in the first half of 2008.
2.1 Patterns in November and December Michigan Survey
The key survey questions in the November and December 2008 survey are as follows. First, the policy is explained to the respondent and then the respondent is asked whether the respondent has received the payment. The question module begins as follows:
Under the economic stimulus program, tax rebates were sent to most individuals earlier this year. In most cases, the tax rebate was six hundred dollars for individuals and twelve hundred dollars for married couples. Those with dependent children received an additional three hundred dollars per child. Individuals earning more than seventy-five thousand dollars and married couples earning more than one hundred fifty thousand dollars got smaller tax rebates or no rebate at all.
Did you (or your family) receive a tax rebate?
Then, if the respondent indicated having received the payment, the respondent is asked the following:
Thinking about your family's financial situation this year, did the tax rebate lead you mostly to increase spending, mostly to increase saving, or mostly to pay off debt?
Note that, because of its retrospective nature, this series of questions in the November and December 2008 surveys has a slightly different structure than the series of questions asked in the first half of 2008. In the February through June implementations of the survey, there is a single question that introduces the policy and asks about mostly spending/saving/paying debt. Respondents are coded as not receiving the rebate only if they volunteer that fact. The differences in the survey design appear to affect the number who report not receiving the rebate but seem to have little effect on the reported spending rates.5
Table 1 gives the basic results for the household response to the 2008 economic stimulus payments. Across all months of the survey, roughly one-fifth of rebate recipients report that the rebate led them to mostly increase their spending. In November and December, nearly the same fraction said that they increased their saving. The modal response--accounting for over half of responses overall--was that receiving the payments led people mostly to pay down debt.6 This finding conveys the central message of this research. The economic stimulus payments were largely saved or used to pay down debt and therefore only provided a modest impetus to aggregate spending per dollar of rebate income. The percent of respondents reporting that they would mostly spend the stimulus payment is quite similar to the responses concerning the advance payments (tax rebates) in 2001; Shapiro and Slemrod (2003a, 2003b) report a "mostly spend" rate also of about one-fifth from the advance payments.
Table 1 shows some small differences in the results across months of the survey. Notably, though, the headline result concerning the mostly spend rate shows almost no difference across the surveys. Given that this statistic is of central concern to our analysis and more generally to the macroeconomic effects of the policy, the consistency of the results across the months of the survey is reassuring. As already mentioned, the November-December results show a slight increase in the rate of mostly paying debt at the expense of mostly saving.7 There are, though, non-trivial differences in the number of individuals reporting not receiving the payment: in November-December 19 percent of respondents report not receiving a rebate versus about half that rate in May-June and an even lower rate earlier in the year. In part, individuals may have learned that they were not receiving the rebate. Also, the November-December surveys (unlike the earlier surveys) explicitly asked about receipt of the rebate which likely contributed to the differences in the results. Since we are interested in the direct effect of the rebate it makes sense to focus only on those households who actually received a rebate. We focus on the November and December 2008 results for most of the paper both because of this slight difference in question design and because these surveys contain a number of questions aimed at understanding the nature and timing of the spending of the stimulus payment.
The distribution of the three possible response categories and of the follow-up question about the timing of the spending do not map directly to an aggregate spending effect--that is, the total amount of the rebate spent at various points in time. But under some further assumptions about the underlying distribution of the individual marginal propensities to consume (as used in Shapiro and Slemrod (2003b) and described in Section 2.3), the result that 22 percent of respondents say that they mostly increased spending yields an aggregate MPC of approximately one-third. Thus, with rebates totaling $96 billion, these results suggest that about $32 billion of extra spending was generated in 2008.
2.1.1. Test-Retest Reliability of Responses
About 40 percent of our sample in November and December had previously answered questions about the rebates in May and June. We developed new questions for this subset of respondents to check the reliability of the survey responses. Table 2a presents the cross-tabulation of the responses from individuals who were interviewed twice and in each interview provided a planned use for their rebate. As a comparison of the bottom row and last column shows, there was little change in the aggregate pattern of responses for individuals interviewed in both November-December and May-June. The total fraction who reported that they mostly increased their spending rose modestly, from 20 to 23 percent and there was a small shift toward debt repayment. The relative stability of the aggregates estimates masks changes at the individual level. For example, 35 percent of respondents (20 out of 58 in the first row) who expected to spend their rebate when first asked in the spring instead reported in the fall that they had mostly used their rebate to increase their savings or pay down their debt. In contrast, only 13 percent of those (30 out of 235 in the bottom two rows) who expected not to spend their rebate actually ended up spending it within the first year. Altogether, about one-quarter of the re-interviews reported a different use for the rebate in the November-December surveys than in the May-June surveys.
Individuals who changed their answer were then asked the following question:
When we last talked to you in (May/June), you expected that the tax rebate would lead you to mostly (increase spending/increase saving/pay off debt). Why did you change your plans?
Table 2b summarizes the reasons for two groups of switchers: those who switched to spending the rebate (30 respondents) and those who switched to not spending the rebate (21 respondents).8 Over 40 percent of respondents in both groups of switchers cited a change in personal circumstances or needs. A change in economic conditions and the rebate being less than expected were cited as reasons somewhat more often by those who switched to saving than those who switched to spending. A sizeable fraction of those who switched to spending did not provide a specific reason for their change in response. Yet, in total, more than 70 percent of the 80 respondents who changed their response to the rebate articulated a reason, generally related to changes in personal circumstances or economic conditions for the difference. We interpret the results from the re-interviews as suggesting that the survey questions are a fairly reliable measure of individuals' plans for spending the rebate. At an individual level, plans did change, usually for a good reason, but there was no systematic pattern to changes.
2.1.2. Timing of spending
The impact of the rebate policy depends on the timing of the induced spending as well as its eventual total magnitude. A sharp boost to spending occurring within a few quarters could have very different indirect effects than a slow steady rise in spending occurring over several years. To better understand the timing of consumer responses, we asked those individuals who said that the tax rebates led them to mostly increase spending about the timing of this increase.
The answers summarized in Table 3 suggest a rapid response to the tax rebates. Over one-third of the individuals who reported mostly increasing spending said that their spending increased within a "few weeks" of receiving their rebate.9 For another 50 percent of individuals, the spending response occurred between "one and three months" after receipt; less than one-sixth of the respondents said that the spending occurred "more than three months" after receipt. Taken together, the survey implies the impetus to aggregate spending happened soon after households received the rebates, and that the induced spending faded rapidly over the subsequent months.10
The last two columns of Table 3 show the timing of spending for mostly-spend households with low income and with low assets--households that we might think ex ante would be credit-constrained or follow rule-of-thumb behavior. We define "low-income" households as those in the bottom third of the income distribution for rebate recipients (those with annual household income below $40,000), and "low asset" households as those without any stock holdings (either directly or in mutual funds or retirement accounts). Table 3 shows that households in each group are substantially more likely to increase their spending within a few weeks of receipt than other mostly-spend households. Interestingly, while those two sub-groups spent their rebate more quickly, the fraction of respondents who said that the rebate led them to mostly increase spending over the year--shown in the second memo line--did not differ much from the sample as a whole.11 Thus, the differential response of those who ex ante might be more credit-constrained appears only in the speed of the spending response of those who were led to spend more.
The results from the Reuters/Michigan survey on the timing of the spending response are broadly consistent with Broda and Parker's (2008) preliminary estimates of the effect of the 2008 rebate using household expenditure data from AC Nielsen Homescan data supplemented by a survey about receipt of the rebate. They find a noticeable boost to spending in the five weeks following the receipt of a rebate. This increase is concentrated among low-income and low-asset households, and fades away quickly.12
2.1.3. Type of spending
The survey also probed further about the type of rebate spending. If an individual reported that the rebate mostly led them to increase their spending, then the survey followed up by asking, "Was the increase in spending mostly for regular purchases or mostly for something else that you would not have otherwise purchased?" According to the survey, the type of spending was almost evenly split between regular and non-regular purchases. The distinction between "regular" and other spending has been asked before in the Survey of Consumers, but it has some ambiguity about what is meant by "regular" and whether or not this spending should be interpreted as incremental. Accordingly, our survey also included the following question for all individuals who spent the rebate: "Specifically, what was that spending?" The responses to this question are reported in Table 4. The first column of Table 4, which provides the distribution of all rebate spending across the specific types, shows that one-quarter of the individuals who mostly spent their rebate used the rebate to purchase a major household item, such as a home appliance or furniture. More than half of spenders cited some other specific expense, such as food or recreation. Another 17 percent reported that used the rebate for "general expenses." A small fraction (3 percent) of the self-reported "spenders" said that they used the rebate to pay off credit cards or other bills and taxes. Individuals in this last category might more plausibly be assigned to the "pay down debt" group. The last two columns repeat the tabulation distinguishing between those who specified "regular expenses" and "something else" in the initial question about type of spending. In general, the characterization of their spending provided by households is sensible. For example spending on food and gasoline is a "regular expense" while vacation spending is "something else."
These results give some reassurances about the validity of the survey responses. Individuals had little problem identifying the type of spending, which suggests that the questions are salient for them. Moreover, there appears to be little misclassification in the responses on the basis of the follow-up question. That is, few who responded mostly spend were using the rebate for debt repayment. Admittedly, there is remaining ambiguity about whether the spending was truly incremental, for example, whether spending on gasoline from the rebate would have taken place absent the rebate or, absent the rebate, whether the consumer would have cut back on some other spending to pay for gasoline.
2.1.4. Type of debt
We knew from the February to June 2008 surveys that debt repayment was the modal use of the rebate. Given this prevalence of debt repayment, we asked households in the November and December 2008 surveys about the type of debt paid down. Table 5 shows that about half of the respondents who said the rebate led them to mostly pay off debt said that their rebate mostly went to lowering their credit card balances, while another 9 percent used the rebate to pay down their mortgage debt. About one-quarter said that the debt repayment went to other specific bills or debts, such as medical bills, and the remaining 14 percent reported that they paid down every day bills or expenses.
The last two columns of Table 5 show that there were substantial differences in the composition of the debts paid off with respect to household income and stock ownership. Households with low income and those with low assets are more likely to pay off every day bills and less likely to pay off credit cards than the full sample. These differences in the type of debt paid off likely reflect differences in the types of debt held by these subgroups and the fact that low income/assets households are more likely to be behind in paying bills.
An interesting and important issue is whether people who report that the rebate led them to "mostly pay off everyday bills" should be thought of as "spending" the rebate. The parsing of past, current, and future consumption--that is, the separation of debt and spending--is a challenge in interpreting the responses to the Reuters/Michigan survey as well as any other survey-based data that investigates rebate spending effects. If "pay off debt" or "pay bills" refers to paying medical bills or student loans that, in the absence of rebates, would have been deferred or financed with other sources of credit, then the rebates led people to pay off debt. However, if these households would have otherwise cut back on their spending to pay those bills or pay off debt, then the rebates led to an increase in spending.
2.1.5. Is Saving and Debt Repayment Lagged Spending?
In the case of someone who reports that the rebate led them to initially add to their savings or pay off debt, but then later led them to increase their spending, the rebates induced greater spending with some lag. Indeed, using credit card records at a large financial institution, Agarwal et al. (2008) find that payments to credit card accounts increased soon after receiving the 2001 rebate, but were subsequently offset by higher spending. To address this possibility, we followed Shapiro and Slemrod's (2003b) approach and asked the mostly-save households whether they would use the additional savings to make a purchase later this year, or instead would try to keep up the higher savings for at least a year; we asked the analogous question for those who said they would mostly pay off debt. In both cases the response was overwhelmingly that people who reported mostly not spending the tax rebate intended the resulting increase in assets (or decrease in debt) to last at least a year, with 85 percent of savers saying this and 90 percent of debt reducers saying so. These results are quite similar to what Shapiro and Slemrod (2003b) find for the 2001 rebate.
Hence, the survey evidence suggests that the increased saving and the debt reduction that the survey respondents report as a result of the 2008 rebate is quite persistent. True, the survey responses admit the possibility that the increased saving or debt repayment might lead to spending after a year has passed. Indeed, to the extent that the rebates represent incremental lifetime resources they will presumably be spent eventually. Spending at horizons beyond a year, however, provide no current economic stimulus and is likely not the impact that proponents of the stimulus envisioned or hoped for.
2.2 Cross-sectional Variation in Mostly Spending the Stimulus Payment
In this section, we analyze how the consumer response to the rebate varies across households in the November-December surveys.
2.2.1. Age
Table 6 shows the distribution of mostly-spend rates by age. Column (A) of the table gives the percent of respondents in each age group. Columns (B), (C), (D), and (E) give the frequency of the responses. Column (F) gives the mostly-spend rate (Column B as a fraction of the sum of columns B, C,
and D). Column (G) gives the ![]() value for the test that the mostly-spend rates are equal across age groups. The following tables that examine other covariates have similar formats.
value for the test that the mostly-spend rates are equal across age groups. The following tables that examine other covariates have similar formats.
Table 6 shows that the mostly-spend rate is significantly related to age. Those under thirty have a mostly-spend rates of 11 percent while those sixty-five and over have mostly-spend rates of 26 percent. Except for the 50-64 age group, the mostly-spend rate is increasing in age. The same age pattern of spending rates occurred for the 2001 tax rebates (Shapiro and Slemrod, 2003a and 2003b).
The age pattern is qualitatively consistent with the prediction of the life-cycle model that a one-time increase in income is divided between current and future consumption. The life-cycle model predicts spending rates that are higher for older households (who have a relatively low future-current ratio). Even so, the spending rates are high relative to a life-cycle benchmark absent liquidity constraints or other factors that increase the propensity to consume from a one-time shock to income.
The age pattern of the mostly-spend rates is not consistent with the liquidity constraints. Younger households are more likely to be liquidity constrained. If liquidity constraints were important, we would expect a higher mostly-spend rate for them, other things equal.
2.2.2. Income and wealth
Table 7 reports tabulations of the mostly-spend rate for income and wealth. The following pattern emerges.
- High-income and high-wealth groups have the highest mostly-spend rates.
- There is a modest U-shape in the spending distribution. The lowest income group and the group with no stock ownership have slightly higher mostly-spend rates than higher-income groups and stock owners, but these differences are small and statistically insignificant.
The pattern for stock ownership is similar to that for income. Stock ownership is the only measure of financial wealth available on the survey. The question first asks whether or not the household owns stock, including in retirement accounts and mutual funds. Those who report owning stock are asked to provide an exact amount. Those who decline to give an exact amount are asked for a bracketed amount. In the table, we impute values for the bracketed responses equal to the median of exact responses within the respective brackets. More respondents give bracketed responses to the stock question than to the income question.
The "no stocks" row in the second panel of Table 7 provides the responses of those who said explicitly they own no stock. The "owns stock" gives the responses of those who said explicitly that they owned stock. This line is followed by the responses by level of stock ownership of those who said they owned stock (either exact or imputed from brackets). The second to last row provides information about those who refused to give a bracketed amount. The last line gives the responses of those who refused or did not know whether they owned stock.
The two-thirds of the population that owns stock has a slightly higher mostly-spend rate than the one-third of the population that does not. There is also an interesting pattern within the stockholders. The highest-stock-ownership individuals have relatively high mostly-spend rates--25 percent for those with stock valued between $100,000 and $250,000 and almost 40 percent for those with stock is excess of $250,000. The lowest spending rate is for those with a moderate amount of stock--between $50,000 and $100,000. The mostly-spend rates for the high-wealth households tell a similar story as that told by income. The best-off households are most likely to spend the stimulus payment. As with income, the results based on stock market wealth do not support the contention that less-well-off households are more likely to spend a rebate. One story that is consistent with these findings is that moderate-stock-wealth households have an inclination to save but, unlike the high-wealth households, have not accomplished their saving goals. That is, high-wealth households might be high-saving types, but have already met their asset targets.
2.2.3. How the payment was received
The stimulus payments were paid by direct deposit if the Internal Revenue Service had bank account information from an income tax return filed previously and were disbursed by check otherwise. Table 8 shows the distribution of responses to the rebate by the form of disbursement, and reveals that the form of disbursement has no correlation with the spending rate from the payment. Given that those with electronic-funds-transfer information are likely to be different from those without it (i.e., more likely to have a bank account, be more financial sophisticated) one might have expected differences in behavior.
2.2.4. Changing financial conditions and income expectations
Table 9 reports the survey responses by how the household's financial condition compares with the previous year (first panel), by what the respondent expects for financial conditions next year (second panel), and by income expectations (third panel). There are no strong patterns in these results. Indeed, the patterns in the second and third panels appear to be contradictory--worse expected financial conditions is associated with more spending, but worse expected income is associated with less spending. Note, however, that these differences are not statistically significant. We will further explore the relationship between expected income and spending in the multivariate analysis that follows.
2.2.5. Multivariate analysis: Age, Income, and Wealth
A number of the covariates we have just discussed are correlated, perhaps in complicated ways. Indeed, the preceding univariate analysis might be misleading because of the correlation among the covariates. To untangle the relationships between the covariates and the response to the rebate, we next present a multivariate analysis of the factors just discussed plus some others.
Table 10 reports the results of estimating a linear probability model where the dependent variable is equal to 100 if the respondent reports that the rebate led mostly to spending the rebate and zero if the respondent reports that it led mostly to saving or mostly to paying off debt. Column (A)
reports the regression on dummies for age, income and wealth categories, and survey-month dummies for the November and December surveys. It also includes some simple demographic variables--a dummy variable that is equal to 1 if the respondent is married or partnered, and a variable equal to the
number of children in the household. The remaining columns report results pooled across all the surveys (February though June, November, and December). Recall that, because the wording of the survey has slight differences across months, these results capture survey design effects as well as time
effects. We pool the results to gain precision, especially for categories of the covariates that are relatively infrequent. The estimates use the sampling weights, and the standard errors are corrected for the heteroskedasticity arising from the weighting. The monthly dummies in column (B), though
they bounce up and down, are not significantly different from zero (the ![]() value for the hypothesis that they are jointly zero is 0.53).
value for the hypothesis that they are jointly zero is 0.53).
The multivariate results are broadly consistent with the univariate tabulations.
- The youngest respondents (the excluded group in the regressions) have the lowest mostly-spend rate. The oldest group has the highest.
- The highest income group has the highest mostly-spend rate.
- The highest wealth group has the highest mostly-spend rate. There is a dip down in spending rates for the moderate wealth group.
The presumption that the young and the poor are more likely to spend a rebate shaped the debate over the 2008 stimulus payments. The Congressional Budget Office (2008, p. 7) in its analysis of the options for stimulus in early 2008, states, "Lower-income households are more likely to be credit constrained and more likely to be among those with the highest propensity to spend. Therefore, policies aimed at lower-income households tend to have greater stimulative effects." A Hamilton Project paper on stimulus options (Elmendorf and Furman, 2008, p. 20) reaches the same conclusion. Our findings do not support these presumptions. Nonetheless, concerns about equity might argue for directing ad hoc government payments to low-income individuals. And the rebates did afford the opportunity for low-income individuals to reduce debt or to save, which surely increases their well-being. Yet, they did not provide as large a boost to current aggregate demand as that from the rebates paid to higher-income households.
2.2.6. Multivariate Analysis: Form of Payment
We also consider whether the multivariate results for the form of payment differ from what is suggested by the univariate tabulations, where the form of payment had no association with the spending response to the rebate. In the univariate setting, there could be conflicting confounds for receiving the rebate by EFT, for example, the old, even though they have relatively high wealth, might be reluctant to have EFT. A multivariate analysis (not tabulated) of whether the payment was received by EFT leads to the same conclusion as the univariate one (coefficient of dummy variable for EFT is -0.2 with a standard error of 2.6). Thus, the form of payment has no predictive power for the effect of the rebate.
2.2.7. Multivariate Analysis: Expected Income Growth
We now turn to a multivariate analysis of the relationship between spending the rebate and households' income and expected income. The permanent income model implies that there should be a low spending rate from a temporary tax rebate. In the presence of liquidity constraints, spending might be higher from a temporary rebate depending on the relationship of current to future income. In particular, if individuals are liquidity constrained and their income is expected to be higher in the future, the spending rate from transitory income should be high as the household uses the temporary income to smooth consumption.
We are able to examine this possibility using the expected income growth questions that are asked each month in the Survey of Consumers. Prior to answering our questions about the rebates, respondents are asked whether they expect their income next year to be higher, lower, or the same as next
year. Those who expect income to change are asked by what percent they expect it to change. Responses to these questions are incorporated into the multiple regression analysis reported in columns (C) and (D) of Table 10. The third column includes dummies that are equal to one for those who expect
income to increase (![]() >0) and one for those who expect it to decrease (
>0) and one for those who expect it to decrease (![]() <0). Income expected to remain unchanged is the omitted category. Controlling for income, stock
holding, and demographics, expected income growth is positively associated with mostly spending the rebate. The difference in the mostly-spend rate between those expecting income to increase and income to decrease is 5.6 percentage points (the
<0). Income expected to remain unchanged is the omitted category. Controlling for income, stock
holding, and demographics, expected income growth is positively associated with mostly spending the rebate. The difference in the mostly-spend rate between those expecting income to increase and income to decrease is 5.6 percentage points (the ![]() -value for the test that the coefficients are jointly zero is 0.02 and is 0.003 for the test that their difference is zero).
-value for the test that the coefficients are jointly zero is 0.02 and is 0.003 for the test that their difference is zero).
Column (D) uses the quantitative expectations about expected change in income. In the survey, those who said income would rise or fall are asked for the percent change (coded as an integer). We define dummies for those expecting income to rise 4 percent or more, to rise between 1 and 3 percent,
to fall between 1 and 9 percent, and to fall by 10 percent or more. The dummies are defined to equally divide those expecting falling and rising income, respectively. Again, those whose income is expected to remain the same are the excluded category. The results strengthen the findings shown in
column (C). There is a strong, monotonic relationship between expected income growth and spending the rebate, as predicted by the permanent income model. There is a difference of 9 percentage points in the mostly-spend rate between those expecting especially large (![]() 4 percent) income growth and those expecting especially large (
4 percent) income growth and those expecting especially large (![]() 10 percent) income declines. These differences are strongly statistically significant.
10 percent) income declines. These differences are strongly statistically significant.
These results showing a strong relationship between expected income growth and rebate spending are consistent with the view that liquidity constraints are important for determining spending of the rebate. Controlling for the level of assets (stock market wealth) and income, those with expected income growth are substantially more likely to spend the rebate than those with expected income declines. Moreover, in our sample, low-income individuals do not have particularly high expected income growth, so the level of income is not a valid proxy for detecting liquidity-constrained behavior.
2.3 Translation of Survey Response to Aggregate Spending
In this section, we translate the survey results to an estimate of the aggregate spending in each month following the distribution of the rebates. This calculation requires us to estimate both a cumulative MPC out of the rebates and the timing of spending. To calculate the MPC out of the rebates after one year, we start with Shapiro and Slemrod's (2003b) method for translating the fraction saying they will mostly spend the rebate into an MPC. The method recognizes that those saying they will mostly spend may save part of the rebate and those saying they will mostly save or pay debt may spend part of the rebate. Shapiro and Slemrod (2003b) proposed a simple, piece-wise linear probability distribution function of the MPC for rebate recipients and calibrate it based on three assumptions. 1) An individual reports "mostly spend" if her MPC is 0.5 or higher; 2) the modal MPC is set equal to the average mostly-spend rate; 3) the probability distribution function is piece-wise linear, such that it has a constant slope from a 0 MPC to the modal MPC and a constant (potentially different) slope from the mode to a maximum MPC. The distribution function for the individual MPCs that is implied by these assumptions has only four parameters (only one of which is a free parameter given the assumptions about the shape of the distribution). The calibration of one of those parameters, determines the values of the other three parameters as well as the average MPC. By varying the free parameter, this procedure implies that the aggregate MPC corresponding to a 22 percent spend rate lies between 0.30 and 0.35. While acknowledging that this is just one of many possible reasonable methodologies for constructing an estimate of the MPC from the survey responses, we use an MPC of one-third as our baseline in this analysis. We will also present the implications of alternative assumptions about the distribution and timing of spending.
In the survey, individuals who report mostly spending their rebate are given three options for reporting the timing of that spending: within a few weeks of receipt (36 percent), one to three months later (50 percent), and more than three months later (14 percent). The percent of spending distributed across these three time periods was previously discussed in Table 3. To construct our measure of aggregate rebate spending, we use the monthly timing of the rebate disbursements (as shown in Figure 1). We also need monthly timing for spending at a finer level of detail than provided by the survey responses. The first column of Table 11 shows our translation of the survey responses to the percent of rebate spending in each month after a respondent receives a rebate. (Note this column sums to 100 percent.) The next three columns show how we distribute the categorical survey responses across these seven months. For example, we assume that all of the individuals (in the second column) who claimed to spend their rebates "within a few weeks" (36 percent of all spenders) did their spending within a month of receiving their rebate. For those (in the third column) who said that their spending occurred "within one to three months" of receiving the rebate, we assume that some of the spending occurred within the month of receipt, but most was concentrated in the second month after receipt. Similarly, we assume that the spending of the last category "more than three months later" was concentrated in the early months of that category. While other interpretations are possible, our presumed monthly pattern of spending respects the basic pattern from the survey responses. Notice also that the sums of the second through fourth column in the "Total" line match the survey responses in Table 3. In the final column of Table 11, which sums to one-third, we multiply our monthly timing pattern for all rebate spending (in column 1) by our estimate of the aggregate MPC to get the fraction of the rebate spent in each month after receipt.
Here is a summary of our approach to translating the survey responses into aggregate estimates: First, we use a distributional assumption to translate mostly-spend rates into an MPC. Second, we translate the survey responses about timing of spending (middle three columns of Table 11) into a presumed monthly pattern of spending (first column of Table 11). Third, we multiply the monthly pattern of timing of spending by the survey-based estimate of the MPC to get spending propensities distributed by month from receipt of the rebate (last column of Table 11). Fourth, we use the aggregate data on the timing of disbursements from Figure 1 and the monthly spending propensities from the last column of Table 11 to derive monthly aggregate spending from the rebate.
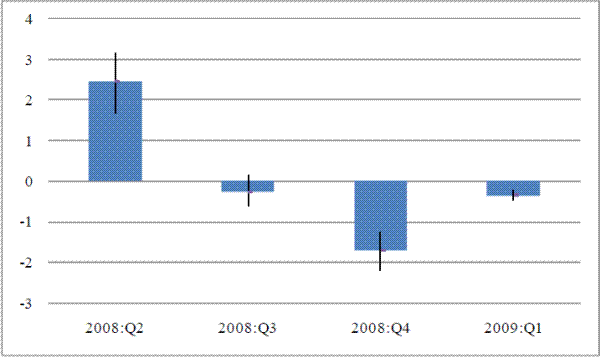
Our estimate of the addition to aggregate spending due to the rebates in each quarter last year is reported in Table 12. The first and third columns of Table 12 translate the monthly increases in income in Figure 1 to quarterly values. They underscore how the rebates caused a sharp, but temporary, boost to disposable personal income (DPI). In 2008:Q2 the rebates of $312 billion (at an annual rate) boosted the growth in real DPI by 12 percentage points at an annual rate.13 And while the disbursement of the rebates continued in the third and fourth quarters, the amounts were substantially less than in the second quarter, so the rebates were then a drag on the growth of real DPI. According to the survey, the household spending response built up somewhat more slowly than the increase in income. The main boost to the growth of real PCE (in the fourth column) also occurred in the second quarter when the income boost was the largest. The largest reversal of this temporary spending effect occurred in the fourth quarter--one quarter later than the reversal in income. Again, since the rebates provide a one-time increase in income, any boost to PCE growth rates must be reversed as spending falls back to its normal level. These survey-based estimates suggest that, given the large magnitude of the rebates, a cumulative MPC of one-third provided a substantial boost to the change in aggregate spending in the second quarter and a substantial drag to the change in spending in the fourth quarter.
While we view this estimate of the aggregate rebate spending responses as a reasonable representation of the survey responses, it is not the only possible estimate. To further explore this issue, we constructed nine alternate translations of the survey responses to aggregate rebate spending. One set of scenarios is based on a smaller cumulative MPC of 0.25, based on assuming that individuals who report "mostly spending" have an MPC of 0.8 and those who report "mostly save/pay debt" have an MPC of 0.1. (The MPC of 0.1 is roughly a straight-line amortizing of the rebate income over 10 years.) A lower MPC is also consistent with a story that the claimed spending of some of the mostly-spend respondents who said the rebate led them to increase "regular expenses" might actually represent a change in the timing of spending, but not a true increment to spending. In another set of scenarios, we use a higher aggregate MPC of 0.40 based on the follow-up probe to whether the individual will maintain the higher savings and lower debt levels for a year. The inclusion of individuals who will later spend the rebate increases the proportion of "mostly spend" to 29 percent and is consistent with an MPC of 0.40 using the Shapiro and Slemrod's (2003b) method of conversion. Another reason for a higher MPC is the respondents who said that they paid off regular bills and expenses with their rebate, since they might have cut back on this spending in the absence of the rebates. In the remaining scenarios the MPC is set to the baseline MPC estimate of 0.33, but we vary the timing of spending to create a faster and slower monthly spending, The various estimates for rebate spending under these alternative assumptions about the aggregate MPC and the monthly timing pattern are shown in Table 13. The high and low values for the contribution of rebates to the change in real spending in each quarter are depicted as the whiskers on the bars in Figure 2. These alternate estimates create an interval of about one-half percentage point (at an annual rate), on average, around the baseline estimate of the aggregate MPC and do not substantially alter the implied timing of aggregate spending of the rebate.
3. Comparisons with Aggregate Data
In this section, we compare our survey-based estimates of the rebate program's effect on aggregate consumer spending and household debt levels with data from the National Income and Product Accounts (NIPA) published by the Bureau of Economic Activity (BEA) and data on consumer credit published by the Federal Reserve Board. In general, we conclude that our survey-based estimates of the aggregate MPC are consistent with how these aggregates fluctuated in 2008. We recognize, though, that the appropriate counterfactual against which to measure the rebate's effect cannot be known with certainty. In response, we present various methods, including simple tabulations and model simulations, and various data sources to assess the aggregate impact.
This analysis is limited to the direct effects of the rebate on aggregate spending and debt repayment. We make no attempt to account for the general equilibrium or multiplier effects. Similarly, we make no attempt to account for possible policy responses to the rebate, for example, whether or not the Federal Open Market Committee would have chosen a different path for its policy rate had there not been a rebate.
3.1 Aggregate Spending Data
In the last section, we used the survey results to estimate the boost to consumer spending in the year following the rebates. We now compare our estimates of rebate-induced incremental spending to the aggregate data from the NIPA using tabulations and to simulations of a standard forecasting model of consumer spending.
3.1.1. Personal Saving Rate
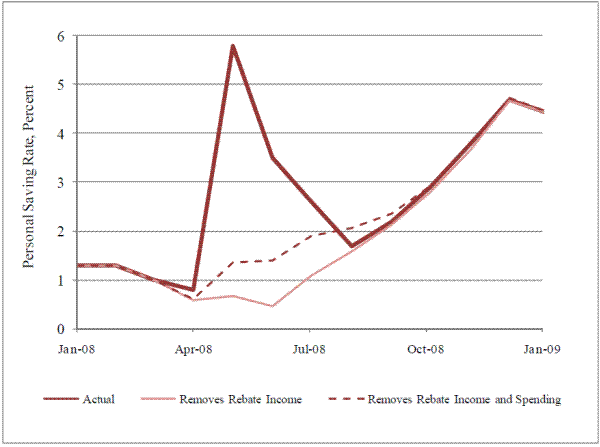
The personal saving rate, which is often used to summarize household spending behavior, fluctuated sharply over the course of 2008. As the thick line in Figure 3 shows, the personal saving rate began near 1 percent at the start of 2008 and jumped sharply to just below 6 percent in May when half of the rebate income was disbursed. When the rebate payments subsided, the saving rate fell back below 2 percent in August. When the financial turmoil intensified in the fall and consumer spending contracted sharply, the saving rate moved up again and ended 2008 at near 5 percent.
The saving rate has been used in both the popular press and academic discussions to assess the impact rebates. Similar to these analyses, the thin light line in Figure 3, which excludes the rebate income (from Figure 1) from the denominator of the saving rate, illustrates that the large changes in rebate income which have an immediate effect on the denominator of the saving rate can fully account for the sharp rise in the saving rate in the spring of 2008. Note that the vertical difference between the thick and thin solid lines is exactly equal to the rebate payments as a percent of disposable income. As Shapiro and Slemrod (2009) point out, this graph shows that over this period the rebate as a percent of disposable personal income closely tracks the personal saving rate. Note, however, that the thin line still reflects the aggregate spending numbers from the NIPAs, so that alternate saving rate in the thin line still includes any effects of the rebates on spending. The dashed line in Figure 3 removes both our survey-based estimate of rebate spending (from Section 2.3) and the rebate income from the saving rate. If there were no other shocks hitting the economy in the spring of 2008 and if the rebates had no general equilibrium effects, this dashed line represents the personal saving rate in the counterfactual world with no rebates. Here we see that, in the absence of the rebates, the saving rate would have risen slowly and fairly smoothly from 1/2 percent in April to 2 percent in August. As shown by the difference between the dashed line and the thin line, our survey-based estimates suggests that the rebate-induced spending held the saving rate down by roughly 3/4 percentage point, on average, in May through August. While this is only a fraction of the 4 percentage point increase in the saving rate over 2008, it does suggest that the rebates had a noticeable impact on household spending, at least temporarily. As noted, though, an assumption underlying this simple analysis is that households did not face any other shocks during the spring of 2008. In fact the distribution of the rebates coincided with a rising unemployment rate, falling consumer sentiment, declining household net worth, falling house prices, and rising oil prices. All of these factors would be likely relevant in determining a reasonable counterfactual saving rate and are not reflected in this analysis. We turn next to simulations of a forecasting model to assess the plausibility of our estimated rebate spending effects.
3.1.2. Model-Based Comparisons
There were many factors driving spending and saving decisions in 2008 other than the tax rebate. In this section we use a simple model of aggregate spending to isolate innovations in consumption growth and to compare them with the survey-based estimate of changes in spending owing to the rebate. We project the quarterly change in real PCE using a standard model (as in Davis and Palumbo, 2001) of aggregate spending that excludes rebate income and determine how "surprised" this model is by the actual spending.14 Note that this analysis is partial equilibrium. It makes no attempt to account for any endogenous responses (multiplier effects) of the rebate.
Table 14 compares the actual change in personal consumption expenditure to the econometric simulation and our survey-based estimate. The quarterly changes in real consumer spending in 2008 (the top line in Table 14) as published by the BEA are broadly consistent with a fast, albeit temporary, increase in spending after households received their tax rebates. The model simulation under the counterfactual of no rebates is shown in the second line of Table 14. This projection incorporates some of the other factors referred to earlier that likely affected spending in 2008, such as consumer sentiment, the unemployment rate, and the declines in disposable income (excluding rebates).15 However, this model does not have any direct measures of financial market turmoil or the tightening of credit standards or controls for energy prices (apart through their effect on real disposable income through the PCE deflator).
The results of the model simulation that excludes the rebate income suggest that the actual change in real spending in the second quarter was surprisingly strong (the model error was 2.2 percentage points, as shown in the third line of Table 14) and then was surprisingly weak in the third and fourth quarters (the model errors were -4.0 percentage points and -0.7 ppt. respectively). Line 4 of Table 14 shows the survey-based estimates of aggregate spending from the rebate taken from Table 12. As a comparison of the third and fourth lines in Table 14 shows, the survey-based contribution of the rebates to the change in real PCE can account for a sizeable portion of the model residual in the second and fourth quarters. Thus the survey responses on rebates are helpful in understanding part of the quarterly pattern of spending last year. Unsurprisingly, a large negative residual remains in the second half of 2008 even after accounting for the rebates owing to the collapse in spending related to the financial crisis. All in all, it appears that a rapid, temporary boost to spending from the rebates was an important factor in the quarterly pattern of aggregate spending last year.
Hence, although the survey evidence indicates that only about a third of the rebate was spent, the rebate was large enough relative to income, and its effect on spending concentrated enough in time, that it had a noticeable effect on the timing of spending in 2008. The growth in household spending was stronger in the second quarter and weaker in the third and fourth quarter than it would have been absent the rebate. Absent the rebate, a weakening of spending earlier in 2008--prior to the September financial crisis and collapse of the stock market--would have been more apparent. This line of reasoning suggests that the weakening of spending (perhaps from high oil prices and poor employment prospects) was a factor driving the weakness of the economy prior to the financial collapse in the fall, and that the financial crisis was likely not the only factor leading to a decline in spending (increase in saving) in the second half of 2008.
3.2 Aggregate Debt Data
Because a large fraction of households reported that the rebate led them to pay down debt, we also examine aggregate data on consumer debt for a rebate effect. Table 15 translates the survey responses into the aggregate addition to savings and repayment of debt due to the rebates. The survey question prompts individuals for the effect of the rebates on their "financial situation this year," so these estimates should not necessarily be viewed as the "long-run" response to the rebates. Nonetheless, the behavioral response within the first year is arguably the most important for fiscal stimulus. Recall that the survey responses suggest that the $96 billion of rebate income led to an additional $32 billion of spending within a year of receipt. Of the remaining amount, the relative percentages of "save" and "pay down debt" in the third column ("Nov-Dec" responses) of Table 1 suggest that 70 percent of the $64 billion that was not spent (a total of $45 billion) went to debt reduction. According to respondents (as reported in Table 5), half of the debt paid off with the rebates was credit card debt, which implies $23 billion less credit card debt. As we have already discussed, one open question with the debt responses is how to interpret the sizeable minority of households that said they used the rebates to pay specific everyday "bills." Here we treat those as (non-credit card) debt repayment, but recognize that they might be indicate increased spending.
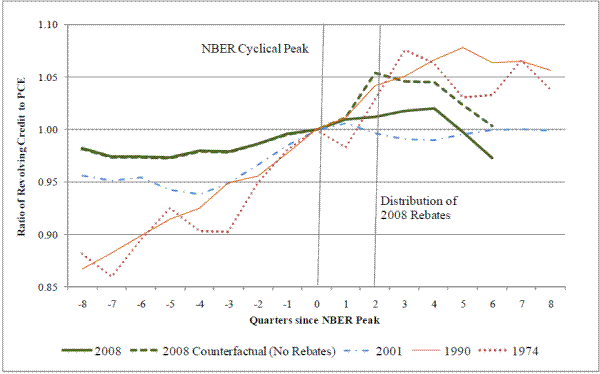
It is then useful to compare our survey estimates of debt repayment due to the rebates to aggregate data on consumer credit and assess whether the counterfactual implied by the survey-based estimates is plausible. Figure 4 depicts the ratio of revolving consumer credit (mainly credit cards) to spending in the current and several prior recessions.16 We use the ratio of debt-to-spending to remove the differences in the patterns of spending across the recessions, such as the sharp drop in spending in the 2008 recession versus the modest gains in the 2001 recession, because these differences in spending tend to directly affect the accumulation of debt.17 Moreover, since borrowing tends to rise in recessions, we have normalized the ratio to one at the NBER-dated cyclical peak of each recession. We show the ratio in the two years prior to the peak and the two years after the peak. The thick solid line shows the movement in consumer credit in the current recession, where the cyclical peak is in 2007:Q4. The thick dashed line is the counterfactual experience of no rebates constructed from our survey-based estimates of rebate-induced debt repayment and spending.18 In the absence of the rebates, we would have expected the revolving debt to rise more rapidly relative to spending than it actually did. By the second quarter of 2008, the counterfactual ratio is over 5 percent higher than its level in 2007:Q4, whereas, the published data show an increase of only 1 percent.19 For comparison, the other lines in the figure show the ratio of revolving credit to spending in the 2001, 1990, and 1974 recessions. The most recent recession in 2001--during which households also received tax rebates--shows little change in the ratio of revolving debt to spending. However, in the 1990 recession and the 1974 recession (another recession with a temporary reduction in taxes), the ratio rose more than 5 percent above their cyclical peaks. Thus, according to our estimates, the rebates in 2008 markedly slowed the growth in revolving credit relative to spending in this recession. The counterfactual is well within the range of past recessions.
4. Comparisons to Other Surveys
Survey responses can be sensitive to the precise wording of questions, the ordering of questions, and other aspects of the survey instrument in ways that can be misleading about the respondents' actual or intended behaviors. A natural response to this potential problem is to field the surveys with a wide variety of reasonable wording, question order, etc., and analyze the differences in the responses. Such research would require a sample and budget larger than ours.
A second-best approach is to compare across the pattern of answers provided in response to other surveys that address the same question but that do so in slightly different ways. This is a second-best approach because it is impossible to control for all aspects of the survey other than the desired treatment (e.g., question wording, and order); generally the timing of the survey, survey mode, sampling technique, and other features also differ. Nevertheless, such comparisons can be insightful.
We identified twenty-two surveys that addressed the question of the consumer response to the 2008 tax rebates, many undertaken by the most prominent polling organizations. In Table 16 we summarize the findings of twelve of those surveys, the twelve done by nationally known polling organizations.20 The figures listed there generally differ from the headline numbers provided by the polling organization, as we have re-calculated them to be a percentage of those who received a rebate and provided an answer, and made some other imputations. Several of these surveys featured a three-part answer set similar to ours. Sometimes the term "save or invest" was used instead of "save" sometimes the term "pay bills" was used instead of "pay down debt," etc.
In the four polls using a three-part answer scheme and wording very close to ours (#2, #5, #6, and #10), the response distributions were very similar to what we found. The spend rate varied from 19 percent to 23 percent, the save rate varied from 24 percent to 38 percent, and the pay down debt rate varied from 35 percent to 53 percent.
One notable variation in the question wording was the substitution of "pay bills" for "pay off debt" or "pay down debt." When "pay bills" was the third option of a three-part question, (in poll #5 and #10), the percentage that gave this answer was somewhat higher--49 percent and 53 percent in these two surveys.
One clear outlier to this central tendency of results is a poll done on January 30-31 by Fox News/Opinion Dynamics. This poll offered the respondents just two basic choices for what they "would do with the money": "save it [a tax rebate] or spend it," with an option of "spend some, save some." In response to this question, only 37 percent said they would save it, 53 percent said they would spend it, and 10 percent said they would spend some and save some. If this stark difference in the response distribution is due just to the two-part rather than three-part question structure, this is a troubling sign of non-robustness to the survey design, although the correct interpretation is not completely clear. But we believe that the main source for the outlying result is that the absence of a response option of "pay off bills" or "pay off debt" prompted people to label it as spending when the rebate check was used, for example, to pay off bills that had piled up on the dining room table. This should more properly be categorized as not affecting the flow of expenditure.
Some polls allowed multiple responses to the question of what they would do with the rebate check. Consider the ABC News/Washington Post poll done on January 30-February 1 (#3). If we categorize the multiple answers into our standard three categories, we find that 24 percent said they would most likely spend the federal rebate, 36 percent said they would save or invest (with more than three-quarters using the save terminology), and 35 percent said they would "pay bills" or "pay off debt"; of the latter category, more than five times as many people volunteered the term "pay off bills" compared to "pay off debt." A similar pattern of answers was found in a follow-up poll done in April (#9). A Zogby International poll for TransUnion TrueCredit.com (#4)) found that 45 percent would pay down debt and 29 percent would save (or invest). The 24 percent listed in the "spend' category is the sum of those who answered they would buy something necessary and those who would "splurge;" of the 24 percent in the spend category, 18 percent would buy something necessary, and 6 percent would "splurge." This semantic distinction may be important, if "necessary" implies spending that would occur anyway, but for which the rebate might have (just) changed the timing of the expenditure or the timing of the payment for the expenditure. Poll #11, also conducted by Zogby, found a relatively high 34 percent spend rate. As in the other Zogby poll, the 34 percent figure is the sum of those who responded they would spend the rebate on everyday expenses and those who would splurge; of the 34 percent, 26 percent would purchase everyday items, and 8 percent would splurge on something they wouldn't normally buy.
We conclude from this exercise that small changes in question wording and possibly major differences in survey design such as question ordering and context do not have a major effect on the distribution of responses. However, the absence of a "pay bills" or "pay off debt" response option may induce many people to report spending the rebate when they in fact paid off debt. Moreover, when asked to characterize a "spend" response between everyday expenses (such as gas, food, and utilities) or "splurge" expenses that they otherwise wouldn't buy, more than three-quarters of people choose the former, suggesting that some of what is characterized as spending in the headline survey results (including our own) may instead be alterations in short-term debt.
5. Conclusions and Implications
How households respond to the tax rebates is central for evaluating the aggregate stimulus that the Economic Stimulus Act of 2008 provided. One way to learn about how households responded is to ask them. When we do so, we learn that only about one-fifth say that the rebates led them to mostly increase spending, while over half said it would lead them to mostly pay off debt. Of those in the mostly-spend category, the spending response was swift, with a third reporting most of the spending occurred within a few weeks of receiving the rebate and another half increasing their spending within one to three months of receiving the rebate. Older respondents were generally more likely to spend the rebates. Low-income and low-wealth households do not report spending more as a result of the rebate, although those who do report mostly spending the rebate in this group do so more quickly than other spenders. A review of other surveys confirms the general pattern of results, and suggests that small changes in survey design do not have a major effect on the distribution of responses, although the absence of a "pay bills" or "pay off debt" response option induces many people to report spending the rebate when their behavior is better characterized as altering the timing of a largely unchanged spending pattern.
The survey responses imply that about one-third of the rebate was spent. This MPC, combined with our evidence about the timing of this spending, seems quite consistent with aggregate data on movements in saving, spending and debt in 2008. Of course, definitive interpretation of the aggregate data requires knowing how the aggregates would have behaved under the counterfactual of no rebate. Providing evidence on this counterfactual is a principal motivation for our survey analysis. Overall, the results suggest that the rebate program provided only a modest stimulus per dollar of rebate.
Nonetheless, the rebates were so large and so quickly disbursed and the fraction spent was spent so rapidly that we think they had a non-trivial effect on aggregate spending in the second and third quarters of 2008. Although the rebates clearly did not stave off the sharp drop in economic activity in 2008, they did affect the timing of its onset by making growth in household spending noticeably stronger in the second quarter and noticeably weaker in the fourth quarter than it would have been absent the rebate. Taking into account the effect of the rebate in delaying the collapse of household spending in 2008 will be important for understanding the causes of the sharp decline in output in the second half of the year. Absent the rebate, we estimate that the sharp decline in spending that is evident in aggregate data beginning in the third quarter of 2008 would have started in the second quarter, prior to the financial crisis of the fall.
Appendix: Survey Questions
This appendix gives the wording of the main question about spending or saving the rebate from the 2008 Reuters/University of Michigan Survey of Consumers. The wording of the question varies depending on whether the survey was in the field before, during, or after the disbursement of the rebate.
The text of the complete tax rebate module is available at http://www.umich.edu/![]() shapiro/.
shapiro/.
February, March, and April 2008
This year (it is likely that)21 tax rebates will be mailed to most individuals. In most cases, the tax rebate will be six hundred dollars for individuals and twelve hundred dollars for married couples. Those with dependent children will receive an additional three hundred dollars per child. Individuals earning more than seventy-five thousand dollars and married couples earning more than one hundred fifty thousand dollars will get smaller tax rebates or no tax rebate at all.
Thinking about your (family's) financial situation this year, will the tax rebate lead you mostly to increase spending, mostly to increase saving, or mostly to pay off debt?
May and June 2008
Under this year's economic stimulus program tax rebates will be mailed or directly deposited into a taxpayer's bank account. In most cases, the tax rebate will be six hundred dollars for individuals and twelve hundred dollars for married couples. Those with dependent children will receive an additional three hundred dollars per child. Individuals earning more than seventy-five thousand dollars and married couples earning more than one hundred fifty thousand dollars will get smaller tax rebates or no rebate at all.
Thinking about your (family's) financial situation this year, will the tax rebate lead you mostly to increase spending, mostly to increase saving, or mostly to pay off debt?
November and December 2008
Under the economic stimulus program, tax rebates were sent to most individuals earlier this year. In most cases, the tax rebate was six hundred dollars for individuals and twelve hundred dollars for married couples. Those with dependent children received an additional three hundred dollars per child. Individuals earning more than seventy-five thousand dollars and married couples earning more than one hundred fifty thousand dollars got smaller tax rebates or no rebate at all.
Did you (or your family) receive a tax rebate?
[For those who received the rebate,]
Thinking about your (family's) financial situation this year, did the tax rebate lead you mostly to increase spending, mostly to increase saving, or mostly to pay off debt?
ReferencesAgarwal, Sumit, Chunlin Liu, and Nicholas S. Souleles (2007). "The Reaction of Consumer Spending and Debt to Tax Rebates--Evidence from Consumer Credit Data." Journal of Political Economy, 115(6), 986-1019.
Broda, Christian and Jonathan A. Parker (2008). "Preliminary Estimates of the Impact of the 2008 Economic Stimulus Payments on Household Spending." (http://www.kellogg.northwestern.edu/faculty/parker/htm/slides/TaxReb2008.pdf)
Coronado, Julia L., Joseph P. Lupton, and Louise M. Sheiner (2005). "The Household Spending Response to the 2003 Tax Cut: Evidence from Survey Data." FEDS Working Paper 2005-32.
Congressional Budget Office. (2008). Options for Responding to Short-Term Economic Weakness. Washington, D.C.
Elmendorf, Douglas W. and Jason Furman. (2008). "If, When, How: A Primer on Fiscal Stimulus." Hamilton Project Strategy Paper. Washington, D.C. Brookings Institution.
Johnson, David, Jonathan A. Parker, and Nicholas S. Souleles (2006). "Household Expenditure and the Income Tax Rebates of 2001." American Economic Review, 95(5), 1589-1610.
Johnson, David, Jonathan A. Parker, and Nicholas S. Souleles (2009). "The Response of Consumer Spending to Rebates During an Expansion: Evidence from the 2003 Child Tax Credit" Working Paper.
Palumbo, Michael G. and Morris A. Davis (2001). "A Primer on the Economics and Time Series Econometrics of Wealth Effects." FEDS Working Paper 2001-9.
Parker, Jonathan A., (1999). "The Reaction of Household Consumption to Predictable Changes in Social Security Taxes." American Economic Review, 89(4), 959-73.
Shapiro, Matthew D. and Joel Slemrod (1995). "Consumer Response to the Timing of Income: Evidence from a Change in Tax Withholding." American Economic Review, 85(1), 274-283.
Shapiro, Matthew D. and Joel Slemrod (2003a). "Consumer Response to Tax Rebates."American Economic Review, 93(1), 381-396.
Shapiro, Matthew D. and Joel Slemrod (2003b). "Did The 2001 Tax Rebate Stimulate Spending? Evidence From Taxpayer Surveys." Tax Policy and the Economy, Editor James Poterba. Cambridge: MIT Press, 2003.
Shapiro, Matthew D. and Joel Slemrod (2009). "Did the 2008 Tax Rebates Stimulate Spending?" American Economic Review Papers and Proceedings, 99, 374-379.
Note: Data are from the U.S. Bureau of Economic Analysis, Department of Treasury. Levels are at monthly rate in current dollars and are not seasonally adjusted
Figure 2: Contribution of Rebates to Change in Real Personal Consumption Expenditures
Survey-Based Estimates of Aggregate Rebate Spending
Note: The solid bars are our baseline estimates from the survey responses of the contribution to the change in real PCE (at an annual rate) as reported in Table 12 and described in the text. The whiskers on each bar represent the range of survey-based estimates reported in Table 13.
Note: The actual data are from the BEA. The figures removing the rebate are based on authors' calculations as described in the text.
Note: The ratio of revolving credit to spending is constructed with the nominal, seasonally adjusted aggregate of revolving consumer credit outstanding in the Federal Reserve Board's G.19 Consumer Credit statistical release and the BEA's nominal, seasonally adjusted estimate of PCE. The quarter of the cyclical peaks is from the NBER. For the current episode, the aggregate data are available only through 2009:Q2. To construct the dashed line, we add estimated rebate-induced debt payment to the numerator and subtract estimated rebate-induced spending from the denominator and.
| Feb-Apr | May-Jun | Nov-Dec | Pooled | |
|---|---|---|---|---|
| Percent of respondents with a plan who spend | 20% | 19% | 22% | 20% |
| Percent of respondents with a plan who save | 31% | 27% | 23% | 28% |
| Percent of respondents with a plan who pay debt | 49% | 53% | 55% | 52% |
| Percent of all respondents who did not get rebate | 7% | 9% | 19% | 11% |
| Percent of all respondents who don't know plan for rebate | 2% | 2% | 3% | 3% |
| Memo: Number of respondents | 1,447 | 980 | 990 | 3,417 |
| Respons in Nov.-Dec.: Increase spending | Response in Nov.-Dec.: Increase saving | Response in Nov.-Dec.: Pay off debt | Row percent | |
|---|---|---|---|---|
| Response in May-June: Increase spending | 38 | 6 | 14 | 20% |
| Response in May-June: Increase saving | 16 | 56 | 18 | 31% |
| Response in May-June: Pay off debt | 14 | 11 | 120 | 49% |
| Column percent | 23% | 25% | 52% | 100% |
| Switch to Spending | Switch to Not Spending | |
|---|---|---|
| Change in personal circumstances | 42% | 43% |
| Change in economic conditions | 10% | 22% |
| Rebate less than expected | 2% | 11% |
| No reason / don't know | 46% | 24% |
| All | Low Income | Low Assets | |
|---|---|---|---|
| Spending increased within a few weeks | 36% | 48% | 57% |
| Spending increased within 1-3 months | 50% | 31% | 25% |
| Spending increased after more than 3 months | 14% | 22% | 18% |
| Memo: Don't know timing | 9% | 16% | 18% |
| Memo: Percent increase spending* | 22% | 21% | 20% |
Note: Author's weighted tabulations of individuals who mostly increased their spending in response to the rebate. The top panel excludes individuals who did not report the timing of their increase in spending. There are 156 individuals who spent the rebate and report a timing of which 42 are with low income (income less than $40,000) and 37 with low asset (no stocks).
| All | "Regular Expenses" | "Something Else" | |
|---|---|---|---|
| Major household item (durables, appliances) | 25% | 12% | 38% |
| Other specific expenses total | 56% | 54% | 57% |
| Other specific expenses: Food | 10% | 20% | 0% |
| Other specific expenses: Gasoline, fuel | 2% | 4% | 0% |
| Other specific expenses: Clothing | 8% | 9% | 7% |
| Other specific expenses: Recreation (incl. travel) | 21% | 8% | 34% |
| Other specific expenses: Housing-related expenses (incl. renovations) | 9% | 7% | 11% |
| Other specific expenses: Vehicle-related (incl. purchases and repairs) | 3% | 2% | 4% |
| Other specific expenses: Medical, education, other specific expenses | 2% | 4% | 1% |
| General expenses | 17% | 31% | 2% |
| Pay off credit card or other loan, pay taxes | 3% | 3% | 2% |
| Memo: Percent don't know type of spending | 3% | 5% | 2% |
| Memo: Percent of all spenders in this group | 100% | 50% | 50% |
| All | Low Income | Low Assets | |
|---|---|---|---|
| Credit card | 51% | 37% | 37% |
| Mortgage, home equity | 9% | 7% | 7% |
| Specific bills (medical, tuition) | 26% | 31% | 32% |
| Everyday bills (utilities, fuel), other debt | 14% | 25% | 24% |
| Memo: Don't know type of debt | 2% | 4% | 4% |
| Memo: Percent pay off debt* | 55% | 62% | 64% |
Note: There are 400 individuals in the top panel who said that the rebates led them to mostly to pay off debt and report the type of debt paid off of which 141 are with low income (income less than $40,000) and 141 with low asset (no stocks).
| Percent of Group (A) | Frequency Spend (B) | Frequency Save ( C ) | Frequency Pay Debt (D) | Frequency No Rebate (E) | Percent Spend (F) | p-value (G) | |
|---|---|---|---|---|---|---|---|
| Under 30 | 8% | 6 | 12 | 35 | 20 | 11% | 0.059 |
| 30-39 | 18% | 25 | 30 | 94 | 20 | 17% | 0.059 |
| 49-49 | 21% | 41 | 31 | 93 | 40 | 25% | 0.059 |
| 50-64 | 29% | 46 | 47 | 122 | 66 | 21% | 0.059 |
| 65 and over | 24% | 48 | 58 | 80 | 45 | 26% | 0.059 |
| Under 65 | 76% | 117 | 120 | 344 | 144 | 20% | 0.104 |
| 65 and over | 24% | 48 | 58 | 80 | 45 | 26% | 0.104 |
| Percent of Group (A) | Frequency Spend (B) | Frequency Save (C) | Frequency Pay Debt (D) | Frequency No Rebate (E) | Percent Spend (F) | p-value (G) |
|
|---|---|---|---|---|---|---|---|
| Household Income: $0 to $20,000 | 15% | 20 | 14 | 67 | 44 | 20% | 0.208 |
| Household Income: $20,001 to $35,000 | 16% | 29 | 25 | 78 | 21 | 22% | 0.208 |
| Household Income: $35,001 to $50,000 | 14% | 21 | 36 | 65 | 8 | 17% | 0.208 |
| Household Income: $50,001 to $75,000 | 17% | 26 | 33 | 95 | 12 | 17% | 0.208 |
| Household Income: More than $75,000 | 33% | 58 | 58 | 106 | 92 | 26% | 0.208 |
| Household Income: Refused / Don't know income | 5% | 11 | 13 | 12 | 14 | 30% | 0.208 |
| No stocks | 33% | 48 | 36 | 152 | 75 | 20% | 0.078 |
| Owns Stocks: Any amount | 67% | 114 | 140 | 267 | 115 | 22% | 0.078 |
| Owns Stocks: $1 to $15,000 | 13% | 21 | 22 | 68 | 11 | 19% | 0.078 |
| Owns Stocks: $15,001 to $50,000 | 14% | 24 | 26 | 73 | 11 | 19% | 0.078 |
| Owns Stocks: $50,001 to $100,000 | 10% | 11 | 23 | 45 | 12 | 14% | 0.078 |
| Owns Stocks: $100,000 to $250,000 | 11% | 20 | 28 | 30 | 23 | 25% | 0.078 |
| Owns Stocks: More than $250,000 | 9% | 19 | 19 | 11 | 39 | 39% | 0.078 |
| Owns Stocks: Refused / Don't know stock value | 11% | 20 | 22 | 39 | 19 | 25% | 0.078 |
| Refused / Don't know stock ownership | 1% | 3 | 2 | 6 | 1 | 27% | 0.078 |
| Percent of Group (A) | Frequency Spend (B) | Frequency Save (C) | Frequency Pay Debt (D) | Percent Spend (E) | p-value (F) |
|
|---|---|---|---|---|---|---|
| Payment received by mail | 49% | 77 | 100 | 188 | 21% | 0.897 |
| Payment received by direct deposit | 51% | 82 | 77 | 220 | 22% | 0.897 |
| Percent of Group (A) | Frequency Spend (B) | Frequency Save (C) | Frequency Pay Debt (D) | Frequency No Rebate (E) | Percent Spend (F) | p-value (G) |
|
|---|---|---|---|---|---|---|---|
| Better financial condition compared to last year | 20% | 34 | 38 | 90 | 27 | 21% | 0.724 |
| Same financial condition compared to last year | 21% | 39 | 50 | 74 | 42 | 24% | 0.724 |
| Worse financial condition compared to last year | 59% | 92 | 90 | 261 | 122 | 21% | 0.724 |
| Better financial condition expected next year | 26% | 39 | 40 | 119 | 47 | 20% | 0.341 |
| Same financial condition expected next year | 55% | 86 | 104 | 216 | 102 | 21% | 0.341 |
| Worse financial condition expected next year | 19% | 38 | 33 | 70 | 34 | 27% | 0.341 |
| Higher income expected next year | 53% | 92 | 90 | 226 | 96 | 23% | 0.421 |
| Same income expected next year | 23% | 42 | 45 | 96 | 41 | 23% | 0.421 |
| Lower income expected next year | 24% | 31 | 43 | 96 | 54 | 18% | 0.421 |
| Nov-Dec (A) | Pooled (B) | Pooled (C) | Pooled (D) |
|
|---|---|---|---|---|
| Married | -3.5 | 0.8 | 0.8 | 0.8 |
| Married standard errors | (-3.6) | (-1.8) | (-1.8) | (-1.8) |
| Children | -5.5 | -1.3 | -1.1 | -1.0 |
| Children standard errors | (-4.4) | (-2.0) | (-2.0) | (-2.0) |
| Age 30 to 39 | 6.9 | 2.6 | 2.5 | 2.7 |
| Age 30 to 39 standard errors | (-6.1) | (-3.1) | (-3.1) | (-3.1) |
| Age 40 to 49 | 12.4 | 5.6 | 5.8 | 6.1 |
| Age 40 to 49 standard errors | (-6.2) | (-3.1) | (-3.0) | (-3.0) |
| Age 50 to 64 | 6.1 | 6.6 | 7.4 | 7.7 |
| Age 50 to 64 standard errors | (-6.4) | (-3.2) | (-3.2) | (-3.2) |
| Age 65 and over | 10.3 | 15.6 | 16.8 | 17.2 |
| Age 65 and over standard errors | (-6.8) | (-3.5) | (-3.5) | (-3.5) |
| Nov-Dec (A) | Pooled (B) | Pooled (C) | Pooled (D) |
|
|---|---|---|---|---|
| $20,001 to $35,000 | 2.9 | 2.8 | 2.4 | 2.6 |
| $20,001 to $35,001 standard errors | (-5.9) | (-3.0) | (-3.0) | (-3.0) |
| $35,001 to $50,000 | -1.1 | -0.9 | -1.1 | -1.1 |
| $35,001 to $50,001 standard errors | (-6.1) | (-3.1) | (-3.1) | (-3.1) |
| $50,001 to $75,000 | -0.0 | 0.5 | -0.2 | -0.2 |
| $50,001 to $75,001 standard errors | (-6.1) | (-3.1) | (-3.1) | (-3.1) |
| More than $75,000 | 8.5 | 4.9 | 4.5 | 4.6 |
| More than $75,001 standard errors | (-6.7) | (-3.3) | (-3.4) | (-3.4) |
| Did not report income | 8.5 | 7.4 | 8.1 | 8.1 |
| Did not report income standard errors | (-9.6) | (-4.3) | (-4.4) | (-4.4) |
| Nov-Dec (A) | Pooled (B) | Pooled (C) | Pooled (D) |
|
|---|---|---|---|---|
| g > 0 | 2.9 | |||
| g > 0 standard errors | (-2.0) | |||
| g < 0 | -2.8 | |||
| g < 0 standard errors | (-2.3) | |||
| g > 4% | 3.9 | |||
| g > 4% standard errors | (-2.2) | |||
| 0 < g < 4% | 1.7 | |||
| 0 < g < 4% standard errors | (-2.2) | |||
| -10% < g < 0 | -0.8 | |||
| -10% < g < 0 standard errors | (-2.8) | |||
| g < -10% | -5.1 | |||
| g < -10% standard errors | (-2.8) |
| Nov-Dec (A) | Pooled (B) | Pooled (C) | Pooled (D) |
|
|---|---|---|---|---|
| $1 to $15,000 | 0.7 | -0.3 | -0.4 | -0.2 |
| $1 to $15,000 standard errors | (-5.2) | (-2.6) | (-2.6) | (-2.6) |
| $15,001 to $50,000 | -1.2 | 2.0 | 2.4 | 2.5 |
| $15,001 to $50,000 standard errors | (-5.1) | (-2.6) | (-2.6) | (-2.6) |
| $50,001 to $100,000 | -7.7 | 0.9 | 1.2 | 1.2 |
| $50,001 to $100,000 standard errors | (-5.1) | (-3.0) | (-3.0) | (-3.0) |
| $100,000 to $250,000 | 2.1 | 4.9 | 5.1 | 5.2 |
| $100,000 to $250,000 standard errors | (-6.0) | (-3.0) | (-3.0) | (-3.0) |
| More than $250,000 | 14.3 | 4.9 | 5.2 | 5.2 |
| More than $250,000 standard errors | (-8.3) | (-3.5) | (-3.5) | (-3.5) |
| Did not report stock value | 2.5 | 2.5 | 2.5 | 2.5 |
| Did not report stock value standard errors | (-6.0) | (-3.0) | (-3.0) | (-3.0) |
| Nov-Dec (A) | Pooled (B) | Pooled (C) | Pooled (D) |
|
|---|---|---|---|---|
| March | 0.8 | 0.8 | 0.7 | |
| March standard errors | (-2.8) | (-2.7) | (-2.7) | |
| April | 3.1 | 3.5 | 3.5 | |
| April standard errors | (-2.8) | (-2.8) | (-2.8) | |
| May | -0.9 | -0.5 | -0.5 | |
| May standard errors | (-2.7) | (-2.7) | (-2.7) | |
| June | 3.3 | 3.6 | 3.5 | |
| June standard errors | (-2.8) | (-2.8) | (-2.8) | |
| November | 4.3 | 5.0 | 5.0 | |
| November standard errors | (-3.0) | (-3.0) | (-3.0) | |
| December | -2.6 | 1.9 | 2.5 | 2.4 |
| December standard errors | (-3.2) | (-2.9) | (-2.9) | (-2.8) |
| Memo: Constant | 15.3 | 7.4 | 5.6 | 5.3 |
| Constant standard errors | (-7.9) | (-4.0) | (-4.2) | (-4.2) |
| Number of observations | 769 | 2,921 | 2,909 | 2,909 |
| R-squared | 0.04 | 0.03 | 0.03 | 0.03 |
| All | Spending "Within a Few Weeks" | Spending "Within 1-3 Months" | Spending "More than 3 Months Later" | Total Fraction of Rebate Spent | |
|---|---|---|---|---|---|
| In month of receipt | 40% | 36% | 4% | .013 | |
| 1st month after | 30% | 30% | .010 | ||
| 2nd month after | 16% | 16% | .005 | ||
| 3rd month after | 8% | 8% | .003 | ||
| 4th month after | 3% | 3% | .001 | ||
| 5th month after | 2% | 2% | .001 | ||
| 6th month after | 1% | 1% | .000 | ||
| Total | 100% | 36% | 50% | 14% | 0.33 |
| Memo: Within first 3 months | 86% | 36% | 50% | 0% | 0.29 |
| Memo: More than 3 months | 14% | 0% | 0% | 14% | 0.05 |
| Income (billions, a.r.) | Spending (billions, a.r.) | Income (Contrib. to Pct. Change, a.r.) | Spending (Contrib. to Pct. Change, a.r.) | |
|---|---|---|---|---|
| 2008:Q2 | 312 | 62 | 12.0% | 2.4% |
| 2008:Q3 | 62 | 55 | -8.9% | -0.3% |
| 2008:Q4 | 9 | 10 | -2.0% | -1.7% |
| 2009:Q1 | 0 | 1 | 0.0% | -0.3% |
| Slower than MPC of .25 | Baseline of MPC of .25 | Faster than MPC of .25 | Slower than MPC of .33 | Baseline of MPC of .33 | Faster than MPC of .33 | Slower than MPC of .40 | Baseline of MPC of .40 | Faster than MPC of .40 | |
|---|---|---|---|---|---|---|---|---|---|
| 2008:Q2 | 42 | 46 | 50 | 56 | 62 | 66 | 67 | 74 | 79 |
| 2008:Q3 | 44 | 41 | 40 | 59 | 55 | 53 | 71 | 66 | 63 |
| 2008:Q4 | 8 | 7 | 6 | 11 | 10 | 8 | 13 | 12 | 9 |
| 2009:Q1 | 1 | 1 | 1 | 1 | 1 | 1 | 2 | 1 | 1 |
| 2008Q1 | 2008Q2 | 2008Q3 | 2008Q4 | |
|---|---|---|---|---|
| (1) Published national accounts data | -0.6 | 0.1 | -3.5 | -3.1 |
| (2) Dynamic model simulation excluding rebate income | 0.5 | -2.2 | 0.5 | -2.4 |
| (3) Difference between data and model simulation | -1.1 | 2.2 | -4.0 | -0.7 |
| (4) Contribution of rebates to the change in real PCE estimated from responses in the Michigan survey | 0.0 | 2.4 | -0.3 | -1.7 |
| Additional Income | Additional Spending | Total Not Spent | Saving (Added to Assets) | Total Debt Paid Down | Credit Card Debt Paid Down |
|---|---|---|---|---|---|
| 96 | 32 | 64 | 19 | 45 | 23 |
| Interview Date | Question | Number of Respondents | Percent Spend | Percent Save | Percent Pay Debt | Percent Other | |
|---|---|---|---|---|---|---|---|
| 1. Fox News / Opinion Dynamics | Jan 30 - 31 | If you received a tax rebate in the next few months, what do you think you would do with the money -- save it or spend it? | 900 | 53 | 37 | -- | 10 |
| 2. Harris Interactive for CCH Complete Tax | Jan 30 - Feb 1 | If you were to get a tax rebate, which of the following would you be most likely to do with all or most of the money? | 2,020 | 21 | 32 | 47 | -- |
| 3. Washington Post / ABC News* | Jan 30 - Feb 1 | If you get a federal rebate, what will you most likely do with it? | 1,249 | 24 | 36 | 35 | 4 |
| 4. Zogby International for TransUnion TrueCredit.com* | Jan 30 - Feb 1 | If you were to get a tax rebate, which of the following would you be most likely to do with all or most of the money? | 3,036 | 24 | 29 | 45 | 3 |
| 5. Pew Research Center | Jan 30 - Feb 2 | If you receive a cash rebate from the government, how are you most likely to use the money? Are you most likely to spend it, save it, pay off bills, or something else? | 1,502 | 20 | 24 | 49 | 7 |
| 6. Bloomberg / LATimes | Feb 21 - 25 | When you get your rebate check, will you spend it on purchases, or will you pay down some of your debt, or will you put it in your savings account? | 1,408 | 23 | 38 | 35 | 6 |
| 7. CNN/Opinion Research Corp. | Mar 14 - 16 | If you receive a tax rebate, what will you do with the money -- spend it, save it, pay off bills, or donate it to charity? | 1,019 | 21 | 32 | 41 | 3 |
| 8. Harris Interactive* | April 7 - 15 | How much money (in dollars) do you think you will use for the following? | 2,529 | 40 | 25 | 30 | 5 |
| 9. Washington Post / ABC News* | April 10 - 13 | If you get a federal rebate, what will you most likely do with it? | 1,197 | 26 | 37 | 35 | 3 |
| 10. CBS News / New York Times | Apr 25 - 27 | What do you expect to do with the tax rebate money you receive- will you spend it, use it to pay bills, or save or invest it? | 664 | 19 | 28 | 53 | -- |
| 11. Zogby International* | May 6 - 8 | How do you plan to spend the majority of your 2008 tax rebate? | 7,815 | 34 | 25 | 32 | 9 |
| 12. Harris Interactive* | Aug 11 - 17 | How much money (in dollars) did you use for the following? | 2,710 | 39 | 20 | 35 | 5 |
| Sahm-Shapiro-Slemrod (2009) | Feb - Jun, Nov - Dec | Did the tax rebate lead you mostly to increase spending, mostly to increase saving, or mostly pay off debt? | 3,417 | 20 | 28 | 52 | -- |