Time-to-Plan Lags for Commercial Construction Projects
Keywords: Time to plan, gestation lags, construction, investment, commercial real estate
Abstract:
JEL Classification: E22, R33, L74
1 Introduction
The U.S. economy emerged from recession in mid-2009, but commercial construction activity did not hit bottom until nearly two years later and even now is up only slightly from its low. Although the recent weakness partly reflects the tight credit conditions induced by the global financial crisis, commercial construction also lagged behind the broader recovery in each of the three previous business cycles. Averaging across those recoveries, which date back to 1982, commercial construction reached its low about three quarters after the official business cycle trough determined by the National Bureau of Economic Research.1 A plausible explanation for this lag is that commercial buildings require substantial planning before construction can begin, which delays the upturn in this sector.
This explanation resonates with the use of gestation lags in some macroeconomic models, starting with Kydland and Prescott (1982). Two distinct types of gestation lags can be defined. The time-to-plan lag represents the period between the initiation of planning on a project and the start of construction, while the time-to-build lag represents the period from the start of construction to the completion of the project.
Although time-to-build lags have garnered most of the attention in the literature, time-to-plan lags are important for understanding construction activity and other types of investment spending. The decision to undertake a construction project will reflect information available during the planning period, including present and expected economic conditions as well as a host of regulatory and other factors specific to the locale of the project. Once construction has started, it typically becomes very costly to defer or abandon the project if circumstances change.2 Thus, the planning period is the critical window for the formation of expectations and the perceptions of risk that drive construction spending.
Existing empirical work provides only limited information about the length of gestation lags for investment projects. One strand of this literature incorporates gestation lags into the structure of a model-either an investment model, a dynamic factor demand model, or a business cycle model-and estimates the lags as part of the overall model estimation.3 The model-based studies generally point to time-to-build lags of one to two years for structures or capital aggregates that include both equipment and structures but are largely silent about the length of time-to-plan lags. One exception is Millar (2005b), who found that it takes at least one year for shocks to total factor productivity to induce changes in spending on business fixed capital, a lag that was interpreted as the time-to-plan lag.
The second strand of the literature directly measures gestation lags. To our knowledge, only one study, Mayer (1960), estimates the time-to-plan period. Using survey data on new industrial plants and additions to existing plants, he estimated a mean time-to-plan period of 7 months and a mean time-to-build period of 15 months, for a total gestation lag of 22 months. Krainer (1968) and Koeva (2000) provide estimates of gestation lags for investment projects in the industrial sector that combine the time-to-build period and part of the earlier planning period. Krainer found that two to three years generally elapsed from the date when the company's board of directors approved the project to its completion, while Koeva estimated a period of about two years on average from a company's announcement of its intention to build a new plant to the end of construction.4 Finally, Montgomery (1995) estimated time-to-build lags using construction reports from the Census Bureau that cover all major types of construction projects. Over the period from 1961 to 1991, Montgomery found a mean time-to-build lag of 17 months for nonresidential structures.5
Overall, the existing literature suggests substantial time-to-build lags or general gestation lags for construction projects and new industrial plants, but almost no information is available on the duration of time-to-plan lags. This paper begins to fill that void by providing comprehensive estimates of time-to-plan lags for commercial construction projects and by exploring sources of variation in these lags. We estimate time-to-plan lags using a large project-level dataset from CBRE Economic Advisors/Dodge Pipeline, supplemented by MSA- and county-level data from the Census Bureau and other governmental sources. The dataset covers more than 80,000 commercial construction projects in the United States from 1999 to 2010.
Our analysis generates four main results. First, time-to-plan lags are quite lengthy for commercial construction projects, averaging about 17 months across the projects in our dataset. Large projects - which account for a disproportionate share of total construction spending - tend to have even longer lags. Indeed, when we weight the projects by their construction cost, the average time-to-plan lag rises to more than 28 months. This estimate represents the average planning time associated with a given dollar of commercial construction spending. Second, time-to-plan lags vary considerably around these averages depending on the characteristics of the building and the building's location. For example, time-to-plan lags are longer for larger, more complex projects, and the metropolitan statistical areas (MSAs) with the longest time-to-plan lags are concentrated in California and the Northeast corridor. Third, time-to-plan lags have lengthened significantly from 1999 to 2010, rising by an average of 3 to 4 months. This increase has been widespread, occurring for all types of buildings, in MSAs across the population spectrum, and in most regions of the country. Finally, we find that the regulatory environment in a jurisdiction helps to explain the variation in lags across locations, and we present some anecdotal evidence that may link at least some of the lengthening in planning lags over time to heightened regulatory scrutiny.6
Section 2 of the paper describes our data, and section 3 presents the regression analysis. Section 4 focuses on whether differences in land-use regulation can account for the variation we find in planning lags across MSAs and over time; this section also summarizes what we learned from consultations with industry experts on changes in planning periods over time. Section 5 concludes.
2 Data
We assembled our dataset using project-level data from the CBRE Economic Advisors/Dodge Pipeline database, supplemented with information about localities from the Census Bureau and other governmental sources. The Pipeline database includes more than 250,000 commercial construction projects planned in the United States from 1999 to 2010. Pipeline aims to include all office, hotel, retail, and warehouse projects started since 1999 with estimated construction costs-excluding land and design fees-that exceed $500,000 at the time of the start.7 Pipeline also includes projects meeting these criteria that have been planned since 1999 but have not yet been started because they were abandoned, deferred, or are still in the planning process. After accounting for missing data and other exclusions, our regression sample consists of 82,303 projects-about 85 percent of which (69,723) were started before our cutoff date of December 2010.
The key information in Pipeline for this study is that on project timelines. After field representatives identify a potential new construction project, they track the dates at which the project transitions through its planning process. The planning timeline begins with the preplanning phase, when the developer has announced an intention to build but has not yet hired an architect, then transitions to the planning phase, when architects are hired to draw up schematics for the building, and to the final planning phase, when specific plans have been (or are about to be) finalized.8 During these three phases, the developer also completes the many legal steps (such as holding public hearings and obtaining zoning approvals from local governments) needed to secure regulatory approval for the project. Once the planning phases are completed, Pipeline representatives record when construction on the project started. If the developer decides to defer the project or abandon it altogether at any time before completion, these dates are recorded as well.9
The Pipeline database shows the exact month and year during which construction on the project began, but the other dates on the project timeline are recorded with less precision. These other dates are less precise because the Pipeline field representatives are only required to check on each project once every six months during the planning period. Thus, the dates recorded for the beginning of each phase prior to the start represent the month and year during which the representative discovered the change of status, rather than the actual date of the change. For this reason, the reported dates for all changes in status before the start represent the end of a six-month interval in which the actual change occurred.10 We account explicitly for this interval reporting in our empirical work.
For our analysis, we define the time-to-plan lag for started projects as the number of months between the beginning of the planning phase, subject to the measurement issue just noted, and the date of the construction start. The decision to exclude the earlier "preplanning" phase was dictated largely by data availability. Dates for the preplanning phase were available only for the small fraction of projects that could be identified at their inception through industry contacts.11 These projects tended to be much larger and more costly than the median project in the dataset. All told, we were able to determine the beginning of the planning phase for nearly 90,000 projects that were started prior our cutoff in December 2010, compared to only about 12,000 projects based on the earlier preplanning date.12
Many of the projects in Pipeline had not yet been started by our cutoff date of December 2010. Excluding such records would cause our sample to underrepresent projects with longer planning durations, thereby exposing our results to truncation bias. To address this issue, we employ an estimation method that regards the time to plan for unstarted projects as being right-censored, with a true planning duration at least as long as the number of months between the planning date and the cutoff date. Although this approach deals with the potential for truncation bias, it can introduce a separate bias in the opposite direction. In particular, some unstarted projects may be very unlikely to move forward, yet remain in the Pipeline database because the developer has not formally declared the project abandoned. To deal with these potential "zombie" projects, we exclude from our sample any unstarted projects whose status at the December 2010 cutoff date had been listed as deferred for more than 60 consecutive months. We also excluded any projects that were listed as abandoned prior to the cutoff date, as abandoned projects very rarely are resumed at a later date.13
To account for the effects of project-specific factors on time-to-plan lags, we assembled data on a number of project characteristics. From the Pipeline database, we obtained the location of each project (including its MSA, county, and geocode), building type (office, hotel, retail, or warehouse), construction type (new buildings or additions, alterations, or conversions of existing structures), number of buildings, total number of floors, square footage, and dummy variables indicating whether the project had been deferred prior to groundbreaking.14 For each project, we calculated distance to the city center using geocodes for the project's location and the employment-weighted center (from the Department of Housing and Urban Development).15 We also obtained Pipeline data for each project's construction costs in current dollars, which were converted to real terms using the price deflator for nonresidential buildings from the National Income and Product Accounts that prevailed at the planning date.
These project-specific variables were supplemented with MSA- and county-level controls from the 2000 Decennial Census. Specifically, we use MSA-level estimates of population, and county-level estimates of the average number of persons per household, the urban share of the population, the homeownership rate for occupied housing units, the median house price, median household income, and the share of the households who had high income (annual income above $100,000). These characteristics could influence land-use regulations across localities and thereby cause planning durations to differ across projects that are identical except for the jurisdictions in which they are located.
Table 1 reports the distribution of projects along several dimensions. As shown in the top part of the table, most of the projects in our sample had their primary property type listed as office or retail, with the remainder split between warehouse and hotel properties.16 About 95 percent of the projects were for new buildings, with the remainder involving some combination of additions to existing buildings, alterations that do not affect square footage, or conversions of property type (such as transforming retail space to office). Geographically, the South Atlantic division, which stretches from Maryland to Florida, accounts for more than 20 percent of the projects, while New England contains about 5 percent, reflecting its much smaller population. The shares for the other divisions are all between 10 and 20 percent. The lion's share of the projects-about 90 percent-were located in MSAs in the top population quartile; the 25 most populous MSAs alone contain nearly 40 percent of the observations in the dataset and account for roughly half of total construction cost.
As shown in table 2, the projects in our sample vary substantially by size, cost, proximity to city center, and characteristics of the surrounding county. Although the typical project in our sample involved the construction of a modest one-story building, the indicators of project size (number of buildings, number of floors, and construction cost) have pronounced right tails that push the mean values above the medians. In the location dimension, projects range from being nearly at the city center to more than 65 miles away. As can be seen in the lower panel of the table, the projects are located in counties with widely varying characteristics. The counties in the dataset tend to be somewhat more urban and to have higher housing density than the overall mean in the 2000 Census. However, the mean values for all the other county characteristics are similar to the national averages in that year.
3 Regression Analysis
We use the project-level dataset described above to estimate how the variation in our control variables affects time-to-plan lags and to characterize the distribution of these lags. To estimate the regression, we employ a maximum likelihood procedure that accounts for both the interval reporting of the initial planning date and the fact that the measured planning duration is right censored for unstarted projects, under the assumption that the true residuals are distributed normally.17
3.1 Explanatory variables
The explanatory variables for the regression consist of characteristics of the project itself, characteristics of the county in which the project is located, and time and MSA fixed effects. The project and county characteristics include all those shown in table 2; for each variable, the regression contains both linear and quadratic terms to allow for nonlinear effects. We also include dummy variables for the type of building (retail, warehouse, or hotel properties, with office buildings as the omitted category); type of construction (additions, alterations, or conversions, with new construction as the omitted category); and whether the project was ever deferred. We interact the deferral dummy with both linear and quadratic terms for the project's square footage to allow for the possibility that deferrals lengthen the planning period by differing amounts for small and large projects.
The remaining variables in the regression are time and MSA fixed effects. We include a year fixed effect for the year in which project planning began (with 2004 as the omitted year) and a month fixed effect for the same event (with June as the omitted month). The regression also includes 362 MSA fixed effects (with Atlanta as the omitted MSA). One of the 362 fixed effects covers about 4900 projects located in MSAs with a population of less than 50,000 in the 2000 Census or for which the MSA could not be determined using location fields in Pipeline.18
The constant term in the regression represents the planning lag for a baseline project. In our setup, the baseline project is defined in terms of the omitted categories for the dummy variables, the omitted fixed effects, and the median characteristics of projects. The constant captures median characteristics because we normalize every non-dummy variable (except distance to city center) prior to estimation by subtracting its median across all projects in the sample. With this convention, the constant term represents the fitted planning lag for a hypothetical new office project with median characteristics located in the center of Atlanta, for which the planning phase began in June 2004 and proceeded without deferral or abandonment.
3.2 Baseline planning lag and effects of characteristics
Table 3 presents the estimates, along with bootstrap standard errors, of the constant term and the coefficients for all of the project and county characteristics. To begin, the constant term indicates that the baseline project has a planning period of 14 months; this baseline planning lag is estimated fairly precisely, with a 95 percent confidence band that runs from 12¾ months to 15¼ months. This result confirms that the planning lags for a typical commercial construction project is lengthy. The differences in the estimated planning lags for the various types of buildings and types of construction are relatively small, though some of the differences from the baseline are statistically significant. Among the significant results, the planning lags for retail buildings and hotels are roughly one-half to a full month longer than for office buildings, while the planning lag for additions to existing structures is a bit more than one month shorter than for new construction.
Moving to the next block of the table, the dummy variable for project deferral has an enormous effect on total planning time. Deferral adds about 25 months to the planning lag for a project with median square footage.19 The effect of deferral rises to about 29 months for the largest projects in the dataset, those at the 99th percentile of the distribution of square footage. Accordingly, projects that were ever deferred impart a long right-hand tail to the distribution of planning lags for the full sample.
The variables measuring project size and complexity -- the number of buildings, number of floors, square footage, and cost per square foot - all have positive and significant coefficients on the linear terms, combined with negative and mostly insignificant coefficients on the quadratic terms. One county characteristic, the median home price, has the same pattern, with significant coefficients on both the linear and quadratic terms. However, the coefficients on all the other project and county characteristics are insignificant.
To assess the quantitative implications of these results, table 4 uses the linear and quadratic coefficients to calculate the change in the time-to-plan lag as each project or county characteristic increases from the ![]() percentile value of its distribution to the
percentile value of its distribution to the ![]() percentile value. The table also shows the 95 percent confidence interval for the effect of the
change in each variable.
percentile value. The table also shows the 95 percent confidence interval for the effect of the
change in each variable.
Starting with the project characteristics, increasing the number of buildings in the project from the ![]() to the
to the ![]() percentile value lengthens the planning period by 6.5 months, all else equal, with a 95 percent confidence band that runs from 5 months to 8 months. A parallel change in the number of floors adds 7.2 months to the planning lag, with a slightly
narrower confidence band than for the number of buildings. Boosting the total square footage of a project with a fixed number of floors and buildings also lengthens the planning period but by less than those two variables. Thus, as would be expected, large projects take substantially longer to plan
than small projects. In contrast, a higher cost per square foot has only a small effect on time to plan in the presence of our other regression controls, while the effect of distance from the city center is negligible.
percentile value lengthens the planning period by 6.5 months, all else equal, with a 95 percent confidence band that runs from 5 months to 8 months. A parallel change in the number of floors adds 7.2 months to the planning lag, with a slightly
narrower confidence band than for the number of buildings. Boosting the total square footage of a project with a fixed number of floors and buildings also lengthens the planning period but by less than those two variables. Thus, as would be expected, large projects take substantially longer to plan
than small projects. In contrast, a higher cost per square foot has only a small effect on time to plan in the presence of our other regression controls, while the effect of distance from the city center is negligible.
Among the county characteristics, median home price strongly affects planning times. Moving from the ![]() percentile to the
percentile to the ![]() percentile of the home price distribution lengthens the planning period by nearly 10 months, all else equal, with a 95 percent confidence band that runs from 6.3 months to 13.4 months. This result is consistent with the notion that development
plans receive heightened scrutiny when county homeowners have a lot at stake through the value of their homes.20 The only other county characteristic with a
substantial effect on the planning period is median income. Surprisingly, counties with the highest median income have considerably shorter planning lags than counties at the low end of the income distribution. The effects of all the other county characteristics - housing density, the urban share
of population, the homeowner share, and the high-income share - are both small and statistically insignificant.
percentile of the home price distribution lengthens the planning period by nearly 10 months, all else equal, with a 95 percent confidence band that runs from 6.3 months to 13.4 months. This result is consistent with the notion that development
plans receive heightened scrutiny when county homeowners have a lot at stake through the value of their homes.20 The only other county characteristic with a
substantial effect on the planning period is median income. Surprisingly, counties with the highest median income have considerably shorter planning lags than counties at the low end of the income distribution. The effects of all the other county characteristics - housing density, the urban share
of population, the homeowner share, and the high-income share - are both small and statistically insignificant.
We would caution, however, against interpreting the effects of these county characteristics too strictly. First, even though our regression sample is large, the amount of information used to estimate these effects is much more limited than for the project characteristics. Our dataset contains 1593 counties, compared with roughly 82,000 projects. Moreover, because our regression controls for MSA fixed effects and because the county characteristics do not vary across time, the county effects are identified solely by cross-sectional variations within the 362 MSAs in our sample. Second, the county characteristics could well be endogenous. In particular, the factors influencing the development process in a county likely affect both the length of the planning period and most, if not all, of the county characteristics in our regression. To address this potential endogeneity, we estimated an IV version of our regression with instruments for the county characteristics that included indicators of geographic constraints on buildable land in the spirit of Saiz (2010) and demographic characteristics - such as the age distribution of county residents - that should be much less affected by the regulatory environment. Although the instruments pass standard specification tests, some of the estimated county effects seemed implausible.21 All in all, we would regard the county characteristics as useful controls in the regression but would not attach a strong causal interpretation to the specific results.
3.3 Variation in planning lags across MSAs
The "heat map" in figure 1 displays the estimated planning duration for the 362 MSAs in our sample for a project with the baseline set of characteristics.22 Projects with longer planning times are represented by deeper shades of red. As shown, the MSAs with the longest planning times are concentrated in California and the Northeast corridor, while planning times generally are shorter in the interior of the country.
The upper panel of figure 2 arranges the same information as a distribution of planning times across MSAs for the baseline project. The distribution spans a broad range of values and is skewed to the right. This distribution gives each project equal weight regardless of size and hence overstates the importance of MSAs with generally small projects relative to a nationally representative measure. Accordingly, the distribution in the lower panel weights the MSA planning lags by the total cost of each MSA's projects. This distribution has a higher mean and is somewhat more tightly concentrated than the unweighted distribution. That said, the weighted distribution still shows wide differences in time-to-plan lags across MSAs even after controlling for the host of project-specific and county characteristics included in the regression. We explore possible sources of this variation in section 4 below.
3.4 Patterns of planning lags over time
Table 5 presents results for the month and year effects in the regression. Looking first at the monthly patterns, planning periods tend to be slightly longer - by about one-half to a full month - when the planning starts late in the year rather than in June, the omitted month. The reason for this minor seasonal pattern is not clear, though perhaps project planning gets a slow start when it begins shortly before the year-end holidays.
The year effects are much more pronounced. Planning lags have increased over time, with projects initiated in 2010 having planning periods that were roughly 3 months longer than projects undertaken in 1999, the first year of our sample. If we measure the change instead from 2000, the year with the smallest estimated year effect, the increase in planning lags through 2010 was about 4 months.
Figure 3 plots the annual time series of the planning lag for the baseline project, measured as the year-effect coefficients plus the estimated constant in the regression. The shaded region shows the 95 percent confidence interval around these estimates. As can be seen, the confidence bands suggest that the upward trend is statistically significant, and an F-test overwhelmingly rejects the null hypothesis that the year fixed effects are equal in all years.
An important question is whether the upward trend is pervasive or whether it is concentrated in a particular set of observations, such as a single region of the country or just one type of construction. We address this question by augmenting the previous regression with variables formed by interacting the year effects with three other sets of factors: the building-type dummies defined above, MSA population dummies, and geographic dummies for the nine Census Bureau divisions. To form the population dummies, we grouped the MSAs in our sample into the 25 most populous MSAs, the rest of the highest population quartile, the second quartile, and the combination of the third and fourth quartiles. One variable from each set of these dummies must be omitted to avoid perfect co-linearity with the baseline year dummies. We omitted office buildings, the largest 25 MSAs, and the South Atlantic Census division (which contains Atlanta, the omitted MSA in the original regression). In this specification, the year dummies without any interactions represent the year effects for office buildings in the largest MSAs in the South Atlantic region. The interaction terms show the deviations from this baseline set of year effects for projects with different characteristics.
We summarize the results in figures 4 to 6 and report the underlying coefficient estimates for the plan-year effects in the appendix.23 Figure 4 plots the planning duration for each type of building, normalized to our baseline case by adding the constant term in the augmented regression to the relevant plan-year coefficients. As shown, planning lags rose for all four types of buildings over the sample period, with increases of 7 months for hotel projects, 4 months for office and warehouse projects, and about 2½ months for retail stores. Figure 5 presents the parallel results for the MSA population groups, normalized once again for the baseline case. For each group, the planning lag increased 3 to 5 months. Thus, along both dimensions, the trend toward longer planning times was widespread, though the magnitude of the increase varied with different slices of the data.
Figure 6 shows the comparable results for the nine Census divisions, and we find some notable regional differences. Planning lags rose the most on the Pacific coast - by more than 8 months over the sample period. Increases of 4 to 5 months occurred in the Mountain states and along the Middle and South Atlantic coast, which runs from New York to Florida. In contrast, the planning lag rose only about 1½ months in two of the four central regions and was little changed on net in the other two. All told, the shift toward longer planning lags was concentrated in the Far West and on the East coast but encompassed, to varying degrees, all types of buildings and MSAs of all sizes.
The confidence bands in figures 4 to 6 suggest that the lengthening of planning periods was statistically significant in many cases. In table 6, we present more formal tests of this proposition for each type of building, each MSA population group, and each Census division. We test three versions of the null hypothesis that planning lags were unchanged over the sample period. The first version compares the initial year and the final year of the sample. This test, however, will be inadequate if the endpoint years, by themselves, do not reflect the underlying trend in time-to-plan lags. To address this possibility, the second version of the test compares the average year effect in the first three years of the sample (1999-2001) to that in the final three years (2008-2010), while the third version of the test expands the window to be five years on each end. Taken together, these tests should provide a reasonably robust method to detect changes in time-to-plan lags over time.
The p-values in table 6 provide strong evidence of a widespread lengthening of planning times. As shown, for all four types of buildings, the null hypothesis of no change in time-to-plan lags is decisively rejected at the five-percent level. The same is true for the MSA populations groups, except for the sole case of the second population quartile when the year effects are averaged over five-year periods. With regard to the regional effects, the p-values for the Pacific, Mountain, Middle Atlantic, and South Atlantic divisions are all less than 0.001, and the results for New England are nearly as strong when the data are averaged over three- or five-year periods. Among the other Census divisions, the results in the West North Central and East South Central are similar to those for New England, in that we reject the null of unchanged planning times when the data are averaged over three- and five-year periods. Only in the West South Central division - which contains Texas, Oklahoma, Louisiana, and Arkansas - do all three tests fail to reject the null of unchanged planning times.
3.5 Summing up: the full distribution of planning times
Thus far, we have explored a variety of factors that affect planning times, generally from the perspective of a standardized baseline project. Now we take a more comprehensive view and ask: "What is the full distribution of planning times across all the projects in our sample?" The construction of this distribution would be straightforward if we knew the true time to plan for each project. However, we do not observe this information because of the six-month interval reporting in the data and the right-censoring for projects still in the planning phase at the end of the sample period. Given both of these measurement issues, we can only place bounds on the true time to plan for a given project.
Despite this limitation at the project level, we can use results from our interval regression to construct an overall distribution that reflects the variation within these known bounds. Specifically, we form a notional planning lag for every project equal to the fitted value from the regression plus a random draw of the error term from a truncated normal distribution consistent with these measurement bounds, where the error variance is taken from the fitted regression. We then assemble an overall distribution from the notional planning lags.
Figure 7 shows the distribution of planning times after making these corrections. As shown in the top panel, the overall distribution of planning times is extremely wide and sharply skewed to the right. The long right-hand tail reflects, in large part, the influence of projects that have had deferrals -- recall from table 3 that deferral adds, on average, more than two years to the planning period. This figure also illustrates the importance of including censored projects in our sample. These projects, represented by the dark portion of the bars, are concentrated in the right-hand part of the distribution and account for vast majority of projects with planning times of 60 months or more. Hence, excluding these cases would cause projects in the upper portion of the planning lag distribution to be substantially under-represented.
The distribution in the top panel counts the number of projects in each time-to-plan bucket and does not distinguish between small and large projects. The bottom panel, in contrast, weights each project by its share of the total cost of all projects in the sample. This cost-weighted distribution shows the planning time for each dollar of construction spending and thus is a more appropriate measure for assessing the macroeconomic consequences of planning lags. As shown, the cost-weighted distribution is skewed even more sharply to the right than the unweighted distribution. Given the long right tail, the mean cost-weighted time-to-plan lag is more than 28 months. Even the typical (i.e. median) cost-weighted project has a time-to-plan lag of 18 months. These statistics indicate that commercial buildings generally have a lengthy time-to-plan before any construction dollars are spent.
Table 7 provides additional detail about mean time-to-plan lags along two dimensions: the influence of deferred projects and differences across types of buildings. First, the table shows that deferrals are an important factor behind the lengthy mean planning lags. Excluding projects with any period of deferral shortens the unweighted mean lag from about 17 months to about 14 months for the aggregation of all building types. The effect of excluding deferred projects on the cost-weighted mean lag is even greater. Second, among the four types of buildings, hotels have the longest mean planning periods - roughly 8 to 9 months longer than office, retail, and warehouse projects on an unweighted basis and as much as 14 months longer with cost weighting. Much of this differences owes to the differential effect of deferrals across the four types of buildings. As can be seen, excluding deferred projects cuts the differential about in half on an unweighted basis and eliminates most of the gap with cost weighting. The differences that remain mostly reflect the relatively large scale of the typical hotel project.
4 Interpretation and Additional Results
This section takes a closer look at two key results from section 3: the wide variation in planning times across MSAs for a standardized project and the upward trend in planning times over our sample period. In particular, we explore whether land-use regulations can account for these patterns using data from the Wharton survey on residential land-use regulation reported in Gyourko, Saiz, and Summers (2008). We also summarize what we learned from our own consultations with industry experts on changes in planning periods over time.
4.1 Wharton survey on residential land-use regulation
The Wharton survey asked officials in roughly 6900 municipalities across the country to provide information about their process for regulating residential land use and about the outcomes of that process.24 The survey was mailed in June 2004, and responses were received from about 2650 municipalities, which represent a finer level of geography - census places - than the MSA level. Gyourko, Saiz, and Summers (2008) used the results to create an overall index of the stringency of land-use regulation in each census place, along with eleven separate component indexes.
Table 8 briefly describes the eleven components of the aggregate index. The first four components (from the approval delay index through the local assembly index) characterize the length of the project approval process and the number of entities whose approval is required. The next four components (from the supply restrictions index through the open space index) reflect the local rules that define permissible development activity. Among the remaining components, the local political pressure index aggregates a large number of survey questions that measure the extent of local political opposition to development. The state political involvement index measures the presence of state-level land-use restrictions and the direct involvement of the state legislature in local project decisions. Finally, the state court involvement index measures the tendency of the courts to uphold local land-use regulation in the face of legal challenges. Both the overall index and all the components are defined so that higher values correspond to a tighter regulatory environment.
4.2 Variation in planning periods across localities
To assess these regulatory effects, we re-ran the initial regression using fixed effects for census places rather than the MSA fixed effects. After accounting for missing or miscoded location information in the Pipeline database, the dataset for this regression included 74,409 projects and 5,984 places. However, most of these places had only a handful of projects, so we ran our regression with separate fixed effects for the 1,712 places that had at least ten projects and with a single catch-all fixed effect for all the other places. Recall that the fixed effect represents the estimated time-to-plan lag in a given locality for our standardized project. After setting aside the places that had no Wharton survey data and those in the catch-all group, we regressed the fixed effects in the remaining 666 places on either the overall Wharton index or the individual components of the index.25 In each case, we estimated the second-stage regression in two ways -- first without weights on the individual places and then by weighting the data for each place by its share of the total project cost in the sample.
The results are reported in table 9. Regardless of whether we weight the data, the estimated coefficient on the overall Wharton index is insignificant and the regression R![]() is
essentially zero. However, when we unpack the components of the overall index, the explanatory power of the regression improves notably. This is especially true for the cost-weighted regression, where six of the index components are significant and the R
is
essentially zero. However, when we unpack the components of the overall index, the explanatory power of the regression improves notably. This is especially true for the cost-weighted regression, where six of the index components are significant and the R![]() jumps to 0.356. In that regression, the time-to-plan lag for each place is positively related to two index components: the approval delay index (which measures the time required to complete project reviews) and the local zoning
approval index (which measures the number of local entities required to approve zoning changes). Both of these results suggest a direct link between the regulatory review process and planning timelines.
jumps to 0.356. In that regression, the time-to-plan lag for each place is positively related to two index components: the approval delay index (which measures the time required to complete project reviews) and the local zoning
approval index (which measures the number of local entities required to approve zoning changes). Both of these results suggest a direct link between the regulatory review process and planning timelines.
At the same time, four components have significant negative coefficients. These results indicate that the planning period tends to be shorter in places (i) that require developers to help pay for infrastructure improvements, (ii) that restrict the density of development, (iii) that have greater political opposition to development activity, and (iv) whose land-use regulations tend to be upheld by the courts. Burge and Ihlanfeldt (2006a, b) offer an explanation for the negative coefficient on the first of these variables - namely, that localities receive a fiscal benefit from collecting infrastructure impact fees from developers, and thus have an incentive to ease the approval process. A related fiscal argument may explain the negative coefficient on density restrictions. Municipalities often use such restrictions to shape development in a way that limits the fiscal burden on existing households (Ihlanfeldt, 2004). This may have the effect of screening out projects that would be subject to heightened scrutiny because of their potential negative fiscal implications, thereby shortening average review times in those localities. The final two index components describe an environment in which the regulatory authorities wield considerable power. In that situation, developers may tend to propose projects that will be favorably received in order to avoid the costs of an unsuccessful application. If such proposals require less time to review than proposals that push the envelope in the developer's favor, this self-policing might explain why project reviews tend to be shorter when developers face a strong regulatory authority.
Table 10 assesses the quantitative importance of the Wharton index components in the cost-weighted regression, based on the same method we used earlier for the project and county characteristics. As before, we measure the effect of moving each explanatory variable (in this case, the index components) from the 1st percentile of its distribution to the 99th percentile. The percentile values for the index components are shown in the first two columns of table 10.26 The impact of each component on the place fixed effect, shown in the next column, equals the difference in the percentile values multiplied by the estimated coefficient in the cost-weighted regression. The final two columns present the 95 percent confidence interval for this estimated impact. The (+) and (-) symbols indicate index components with significant positive and negative coefficients, respectively, in the cost-weighted regression.
As can be seen, the quantitative impact of the approval delay index is by far the largest in the table. Moving from the 1st percentile to the 99th percentile of this index raises the time-to-plan lag for a given place by 7 months, with a tight confidence interval. The next most influential component is the local zoning approval index, for which the impact of a comparable change is 3¾ months. This suggests that the length and intensity of the review process can explain a substantial part of the cross-sectional variation in planning times. In contrast, the effects of the four index components with negative coefficients in the regression are smaller, ranging from less than 1 month to 3 months.
4.3 Planning periods over time
Although most of the information collected from the Wharton survey is cross sectional, the survey includes a few questions about changes over time. In particular, one question asks: "Over the last 10 years, how did the length of time required to complete the review and approval of residential projects in your community change?" The possible responses are "no change," "somewhat longer," and "considerably longer," with separate responses for single-family and multifamily projects. The question did not allow respondents to indicate that review periods had become shorter. Because of this asymmetry, we cannot use the responses to examine our finding that planning times became longer, on average, for the nation as whole. However, by comparing the responses across Census divisions, we can assess whether the Wharton survey provides independent confirmation of our finding that the shift toward longer planning periods was concentrated on the East Coast and in the West.27
To do this, we created an index of the Wharton responses at the Census division level. For each of the 666 places in the Wharton regression sample, we converted the responses of "no change," "somewhat longer," or "considerably longer" to values of zero, one, or two, respectively, and then averaged the values for single-family and multifamily projects. Next, we aggregated the results to the Census division level in two ways -- first as an unweighted average of the included places and then by weighting each place by its share of the number of Pipeline projects in that division. The unweighted average captures the general perception among the survey respondents in each Census division, but it makes no allowance for differences in the importance of each Census place to overall activity. Weighting each place by its number of projects helps on the latter score, but a potential downside is that it emphasizes the views of some survey respondents more than others, even though this weighting does not reflect their degree of expertise about the regulatory review and approval process. On a priori grounds, we could not see a clear case for one method over the other, so we tried both.
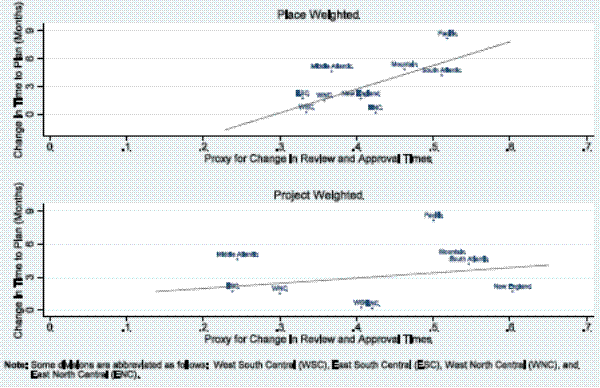
Figure 8 plots both versions of the Wharton proxy for the change in review and approval times against the change in the estimated plan-year effect from 1999 to 2010, calculated from the results in figure 6. As can be seen, the tightness of the relationship depends heavily on the method of aggregating the Wharton responses. The scatter plot constructed with the unweighted Wharton measure (the top panel) shows a close, positive link across Census divisions with the change in the estimated plan-year effects. In contrast, the scatter plot based on the project-weighted Wharton measure shows only a weak positive correlation. Overall, the results from this exercise are ambiguous: we do not find strong independent confirmation of our findings about the change in planning periods, but at the same time, we uncover no evidence that runs counter to those findings.
To gain further perspective on the upward trend in planning durations, we consulted with firms that are directly involved in real estate development and with informed industry observers. Although some of the comments reflected conditions across the country, a substantial fraction of the real estate firms we contacted work primarily in the Washington, D.C. area, so the responses are skewed somewhat toward that market.
An overwhelming majority of these contacts indicated that planning timelines had lengthened over our sample period, consistent with our econometric results. In addition, several contacts noted that the trend toward longer planning periods had started a decade or more before the beginning of our sample period. Among the factors cited for this trend, by far the most common was that the regulatory process for the review and approval of construction projects had become more time-consuming. The specific features of the regulatory process seen as contributing to this trend included greater citizen involvement in project review, tougher environmental standards, and an increase in the number of government agencies whose approval is required. Of course, it is important to emphasize that, even if changes in land-use regulations do account for the increase in planning lags over time, we are not able to assess whether these changes reflect a shift to over-regulation, a catch-up from too light regulation, or a change over time in the optimal amount of regulation.
5 Conclusion
Gestation lags have long been understood to be an important feature of the investment process, and estimates of these lags can be found in the literature. However, previous research has focused on the time-to-build part of the gestation period and has provided very little information on the earlier time-to-plan lag. In addition, most of what we know about gestation lags has come from indirect inference in structural models estimated with aggregate data. Only a handful of studies have estimated gestation lags using project-level information.
This paper addresses both of these limitations. We estimate time-to-plan lags for commercial construction projects using a rich project-level dataset that allows direct observation of these lags. Our analysis demonstrates that time-to-plan lags for commercial construction projects are long, averaging about 17 months when we aggregate all the projects in the dataset without regard to size. When we weight the projects by their construction cost - which is needed to measure the average planning time for a given dollar of commercial construction outlays - the average lag rises to more than 28 months.
Our results also show that the full distribution of time-to-plan lags spans a wide range, with an especially long right-hand tail. The characteristics of the building to be constructed and its location account for part of this variation, while project deferrals also contribute importantly to the long tail. Another key result is that time-to-plan lags increased by several months, on average, over the 1999-2010 period that we study. This lengthening occurred for all types of buildings, in MSAs of all sizes, and in most regions of the country. Finally, we find that differences in the regulatory environment across jurisdictions help explain the cross-sectional variation in time-to-plan lags, and we present some anecdotal evidence that the upward trend in planning lags may be related as well to the regulatory review process. As noted, our results do not say whether the increase in time-to-plan lags reflects a move toward or away from the optimal amount of regulation.
These results contribute to the literature in both macroeconomics and urban/real estate economics. Macroeconomists can use the results to calibrate business cycle models and to help specify the lag structure in models of investment spending. For urban and real estate economists, our findings provide the most detailed information to date on the planning periods for commercial real estate projects. We quantify the length of these planning periods and establish that they have been influenced importantly by the regulatory review process at the local level.
The Pipeline database is a valuable source of information about the planning process for commercial construction projects. We know of no similar data for other types of investment spending. Accordingly, the Pipeline data have the potential to provide new insights into the factors affecting firms' decisions to continue, defer, or stop investment projects. In future work, we intend to use the Pipeline data to study the effect of uncertainty on these decisions in the commercial real estate sector.
Table 1
Summary Statistics: Type of Building, Type of Construction, and Location
| Percent of observations | Percent of construction cost | |
|---|---|---|
| Type of building: Office | 33.7 | 39.8 |
| Type of building: Retail | 42.5 | 25.8 |
| Type of building: Warehouse | 17.9 | 17.1 |
| Type of building: Hotel | 5.9 | 17.3 |
| Type of construction |
95.1 | 93.1 |
| Type of construction |
7.1 | 7.3 |
| Type of construction |
5.7 | 4.1 |
| Type of construction |
1.0 | 0.5 |
| Census Division: New England | 5.4 | 5.1 |
| Census Division: Middle Atlantic | 10.2 | 15.0 |
| Census Division: South Atlantic | 23.8 | 21.6 |
| Census Division: North Central |
17.9 | 16.7 |
| Census Division: South Central |
18.5 | 13.2 |
| Census Division: Mountain | 11.5 | 11.6 |
| Census Division: Pacific | 12.7 | 16.8 |
| MSA population: Top 25 MSAs | 39.0 | 52.0 |
| MSA population: Rest of first quartile | 49.6 | 40.1 |
| MSA population: Second quartile | 7.0 | 4.6 |
| MSA population: Third and fourth quartiles | 4.4 | 3.2 |
Note: Based on 82,303 projects with planning dates recorded between 1999 and 2010. See the text for details about the construction of the sample.
1. A given project may encompass multiple types of construction.
2. Combination of East North Central and West North Central.
3. Combination of East South Central and West South Central.
Table 2
Summary Statistics: Project and County Characteristics
| Variable | Mean | Percentile of distribution: |
Percentile of distribution: 50 |
Percentile of distribution: |
|---|---|---|---|---|
| Project characteristics: Number of buildings | 1.5 | 1 | 1 | 10 |
| Project characteristics: Number of floors | 1.8 | 1 | 1 | 12 |
| Project characteristics: Construction cost (millions of 2005 dollars) | 5.6 | .2 | 1.5 | 64.4 |
| Square footage (thousands) | 59 | 2 | 18 | 600 |
| Cost per square foot (2005 dollars) | 110 | 21 | 85 | 466 |
| Project characteristics: Distance from city center (miles) | 14 | 1 | 10 | 66 |
| County characteristics (in year 2000): Housing density (units per square mile) | 626 | 11 | 218 | 11,675 |
| County characteristics (in year 2000): Urban share of population (percent) | 86 | 33 | 93 | 100 |
| County characteristics (in year 2000): Homeowner share of occupied units (percent) | 67 | 27 | 67 | 85 |
| County characteristics (in year 2000): Median household income (thou. of dollars) | 46 | 28 | 43 | 74 |
| County characteristics (in year 2000): Median home price (thou. of dollars) | 129 | 58 | 115 | 361 |
| County characteristics (in year 2000): High-income share (percent of households) |
13 | 4 | 12 | 35 |
Note: Based on 82,303 projects with planning dates recorded between 1999 and 2010. See the text for details about the construction of the sample.
1. Share of households with income above $100,000.
Table 3
Regression Results: Baseline Planning Lag and Effects of Characteristics
| Variable | Linear effect | Quadratic effect |
|---|---|---|
| Constant (planning lag for baseline project) | 14.02* | |
| Constant (planning lag for baseline project) (Standard Error) | (.62) | |
| Type of building (omitted: office) Retail | .58* | |
| Type of building (omitted: office) Retail (Standard Error) | (.14) | |
| Type of building (omitted: office) Warehouse | -.18 | |
| Type of building (omitted: office) Warehouse (Standard Error) | (.19) | |
| Type of building (omitted: office) Hotel | .85* | |
| Type of building (omitted: office) Hotel (Standard Error) | (.32) | |
| Type of construction (omitted: new structure) Addition | -1.20* | |
| Type of construction (omitted: new structure) Addition (Standard Error) | (.20) | |
| Type of construction (omitted: new structure) Alteration | -.09 | |
| Type of construction (omitted: new structure) Alteration (Standard Error) | (.30) | |
| Type of construction (omitted: new structure) Conversion | -.42 | |
| Type of construction (omitted: new structure) Conversion (Standard Error) | (.78) | |
| Other project characteristics Ever deferred | 24.92* | |
| Other project characteristics Ever deferred (Standard Error) | (.37) | |
| Other project characteristics Ever deferred * square footage | .016* | |
| Other project characteristics Ever deferred * square footage (Standard Error) | (.0044) | |
| Other project characteristics Ever deferred * (square footage) |
-1.58e-6 | |
| Other project characteristics Ever deferred * (square footage) |
(2.25e-6) | |
| Other project characteristics Number of buildings | .74* | -.0015 |
| Other project characteristics Number of buildings (Standard Error) | (.095) | (.0013) |
| Other project characteristics Number of floors | .89* | -.017* |
| Other project characteristics Number of floors (Standard Error) | (.084) | (.0024) |
| Other project characteristics Square footage | .0071* | -3.36e-8 |
| Other project characteristics Square footage (Standard Error) | (.0010) | (4.72e-7) |
| Other project characteristics Cost per square foot | 3.49* | -.120 |
| Other project characteristics Cost per square foot (Standard Error) | (.77) | (.103) |
| Other project characteristics Distance from city center | -.0083 | 6.4e-5 |
| Other project characteristics Distance from city center (Standard Error) | (.0104) | (7.8e-5) |
| County characteristics Housing density | -1.03e-5 | -4.64e-9 |
| County characteristics Housing density (Standard Error) | (2.20e-4) | (5.23e-9) |
| County characteristics Urban share of population | 1.62 | -1.20 |
| County characteristics Urban share of population (Standard Error) | (2.26) | (1.82) |
| County characteristics Homeowner share of occupied units | -11.47 | 12.04 |
| County characteristics Homeowner share of occupied units (Standard Error) | (11.23) | (8.04) |
| County characteristics Median household income | -.095 | -4.26e-4 |
| County characteristics Median household income (Standard Error) | (.12) | (1.31e-3) |
| County characteristics Median home price | .063* | -7.35e-5* |
| County characteristics Median home price (Standard Error) | (.013) | (2.66e-5) |
| County characteristics High-income share | 15.9 | -25.4 |
| County characteristics High-income share (Standard Error) | (11.0) | (32.2) |
Note: Estimated by a maximum likelihood procedure that accounts for right censoring and interval reporting of the time-to-plan data.Bootstrap standard errors are shown in parentheses. A total of 500 bootstrap replications were run; 495 drew samples in which all parameters could be identified. Asterisks indicate significance at the 5 percent level. The results for the month and year dummies are reported in table 5. The results for the MSA fixed effects are available from the authors upon request.
Table 4
Effects of Change in Characteristics on Planning Duration
(in months)
| Variable | Total effect | Bottom 95 percent confidence interval | Top 95 percent confidence interval |
|---|---|---|---|
| Project characteristics Number of buildings | 6.5 | 5.0 | 8.0 |
| Project characteristics Number of floors | 7.2 | 6.0 | 8.5 |
| Project characteristics Square footage | 4.2 | 3.2 | 5.3 |
| Project characteristics Cost per square foot | 1.5 | 0.9 | 2.2 |
| Project characteristics Distance from city center | -0.3 | -1.1 | 0.6 |
| County characteristics Housing density | -0.7 | -4.4 | 3.0 |
| County characteristics Urban share of population | 0.0 | -0.9 | 1.0 |
| County characteristics Homeowner share of occupied units | 1.2 | -2.1 | 4.5 |
| County characteristics Median household income | -6.4 | -10.0 | -2.7 |
| County characteristics Median home price | 9.8 | 6.3 | 13.4 |
| County characteristics High-income share | 1.8 | -2.2 | 5.8 |
Note: The total effect represents the change in planning duration, using the results reported in table 3, when one explanatory variable at a time is adjusted from the ![]() percentile of
its distribution to the
percentile of
its distribution to the ![]() percentile. The 95 percent confidence interval for each variable is calculated from the bootstrapped variance-covariance matrix of the coefficient
estimates.
percentile. The 95 percent confidence interval for each variable is calculated from the bootstrapped variance-covariance matrix of the coefficient
estimates.
Table 5
Regression Results for Time Effects
| Month (omitted: June) | Coefficient | Year (omitted: 2004) | Coefficient |
|---|---|---|---|
| January | .22 | 1999 | -.67 |
| January (Standard Error) | (.24) | 1999 | (.35) |
| February | .39 | 2000 | -1.77* |
| February (Standard Error) | (.24) | 2000 | (.30) |
| March | .32 | 2001 | -.32 |
| March (Standard Error) | (.23) | 2001 | (.30) |
| April | -.02 | 2002 | -.81* |
| April (Standard Error) | (.23) | 2002 | (.27) |
| May | .07 | 2003 | -.82* |
| May (Standard Error) | (.24) | 2003 | (.27) |
| July | .27 | 2005 | .74* |
| July (Standard Error) | (.24) | 2005 | (.25) |
| August | .62* | 2006 | 1.12* |
| August (Standard Error) | (.23) | 2006 | (.25) |
| September | .37 | 2007 | .74* |
| September (Standard Error) | (.24) | 2007 | (.24) |
| October | .50* | 2008 | 2.02* |
| October (Standard Error) | (.25) | 2008 | (.25) |
| November | .93* | 2009 | 1.52* |
| November (Standard Error) | (.25) | 2009 | (.28) |
| December | .50 | 2010 | 2.58* |
| December (Standard Error) | (.27) | 2010 | (.30) |
Note: See table 3 for a description of the regression. The results for the constant term in the regression and for the project and county characteristics are reported in table 3. The results for the MSA fixed effects are available from the authors upon request.
Table 6
Tests of Equality of Year-Effect Coefficients
(p-values)
| Null hypothesis for year effects: 1999 = 2010 | Null hypothesis for year effects: 1999-2001 = 2008-2010 | Null hypothesis for year effects: 1999-2003 = 2006-2010 | |
|---|---|---|---|
| Type of building: Office | .000 | .000 | .000 |
| Type of building: Retail | .015 | .000 | .000 |
| Type of building: Warehouse | .001 | .000 | .000 |
| Type of building: Hotel | .000 | .000 | .000 |
| MSA population group: Top 25 | .000 | .000 | .000 |
| MSA population group: Rest of first quartile | .000 | .000 | .000 |
| MSA population group: Second quartile | .014 | .003 | .071 |
| MSA population group: Third and fourth quartiles | .001 | .001 | .002 |
| Census divisions: Pacific | .000 | .000 | .000 |
| Census divisions: Mountain | .000 | .000 | .000 |
| Census divisions: West North Central | .344 | .015 | .000 |
| Census divisions: West South Central | .846 | .882 | .817 |
| Census divisions: East North Central | .881 | .078 | .000 |
| Census divisions: East South Central | .206 | .000 | .000 |
| Census divisions: New England | .523 | .017 | .000 |
| Census divisions: Middle Atlantic | .000 | .000 | .000 |
| Census divisions: South Atlantic | .000 | .000 | .000 |
Note: All results are obtained from the augmented regression described in the text. The multi-year periods in the hypothesis tests (1999-2001, for example) use the averages of the year effects for the included years. The results for office buildings, for the top 25 population group, and the South Atlantic Census division are identical because these are the omitted categories in the year-effect interactions, so the year effects in each case are captured by the uninteracted year dummies.
Table 7
Mean Time to Plan
| Unweighted All projects | Unweighted Excl. deferred | Cost-weighted All projects | Cost-weighted Excl. deferred | |
|---|---|---|---|---|
| All building types | 17.3 | 13.9 | 28.6 | 20.5 |
| Office | 17.2 | 13.6 | 29.3 | 21.7 |
| Retail | 16.5 | 13.8 | 24.6 | 20.1 |
| Warehouse | 16.9 | 13.5 | 23.4 | 17.0 |
| Hotel | 25.2 | 18.1 | 37.9 | 22.4 |
Note: Figures shown are means of the distribution of planning lags for projects within each building type with corrections for right-censoring and interval collection.
Table 8
Components of the Wharton Residential Land-Use Regulatory Index
| Index Component | Description |
|---|---|
| Approval delay index | An index of the time required to complete the review of (i) residential construction projects, (ii) rezoning applications, and (iii) subdivision applications. |
| Local zoning approval index | The number of local entities required to approve zoning changes. |
| Local project approval index | The number of local entities required to approve new projects. |
| Local assembly index | Dummy variable. Equals one if town meetings are required to approve zoning changes. |
| Supply restrictions index | An index of limits on annual permit issuance and allowable construction activity. |
| Exactions index | Dummy variable. Equals one if developers are required to fund infrastructure improvements in order to build. |
| Density restrictions index | Dummy variable. Equals one if any area in the locality has a minimum lot-size requirement of at least one acre. |
| Open space index | Dummy variable. Equals one if developers are required to supply open space in order to build. |
| Local political pressure index | An index that measures (i) the degree to which various local entities are involved in development decisions and (ii) the importance of governmental and citizen opposition to growth. |
| State political involvement index | An index of the state-level involvement in local land-use regulations and the enactment of state-level land-use restrictions. |
| State court involvement index | An index for the tendency of appellate courts to uphold local land-use regulation. |
Note: See Gyourko, Saiz, and Summers (2008) for details.
Table 9
Regression of Estimated Place Fixed Effects on the Wharton Residential Land Use Regulatory Index and Components
| Variable | Unweighted | Unweighted | Cost-weighted | Cost-weighted |
|---|---|---|---|---|
| Constant | 11.12* | 11.21* | 12.21* | 11.65* |
| Constant (Standard Error) | (.27) | (.34) | (.16) | (.24) |
| Aggregate index | .35 | -.07 | ||
| Aggregate index (Standard Error) | (.25) | (.18) | ||
| Approval delay index | .17 | 1.69* | ||
| Approval delay index (Standard Error) | (.18) | (.13) | ||
| Local zoning approval index | .41* | .85* | ||
| Local zoning approval index (Standard Error) | (.20) | (.19) | ||
| Local project approval index | .18 | -.06 | ||
| Local project approval index (Standard Error) | (.19) | (.16) | ||
| Supply restrictions index | -.04 | -.28 | ||
| Supply restrictions index (Standard Error) | (.23) | (.24) | ||
| Exactions index | -.13 | -.54* | ||
| Exactions index (Standard Error) | (.19) | (.15) | ||
| Density restrictions index | -.25 | -.35* | ||
| Density restrictions index (Standard Error) | (.15) | (.15) | ||
| Open space index | .06 | -.28 | ||
| Open space index (Standard Error) | (.18) | (.16) | ||
| Local political pressure index | -.15 | -.51* | ||
| Local political pressure index (Standard Error) | (.15) | (.09) | ||
| State political involvement index | .65* | -.13 | ||
| State political involvement index (Standard Error) | (.31) | (.14) | ||
| State court involvement index | -.51* | -.52* | ||
| State court involvement index (Standard Error) | (.25) | (.16) | ||
| R |
.006 | .050 | .0002 | .356 |
Note: Each regression is estimated by OLS using the 666 places that have at least 10 projects. In the cost-weighted regressions, each place is weighted by its share of total construction cost in the 666 places. The local assembly index is excluded from the regressions because it takes the same value in every place. Robust standard errors are shown in parenthesis. An asterisk indicates significance at the five-percent level.
Table 10
Distribution of Wharton Index Components and Estimated Impact of Changes
on Place Fixed Effects
| Index Component | Value at |
Value at |
Impact on place fixed effects (measured in months) | Bottom 95 percent confidence interval (measured in months) | Top 95 percent confidence interval (measured in months) |
|---|---|---|---|---|---|
| Approval delay index (+) | 1.3 | 17.5 | 7.0 | 6.0 | 8.0 |
| Local zoning approval index (+) | 0.0 | 4.0 | 3.7 | 2.1 | 5.4 |
| Local project approval index | 0.0 | 4.0 | -0.3 | -1.5 | 1.0 |
| Supply restrictions index | 0.0 | 4.0 | -1.4 | -3.6 | 0.9 |
| Exactions index (-) | 0.0 | 1.0 | -1.2 | -1.9 | -0.6 |
| Density restrictions index (-) | 0.0 | 1.0 | -0.9 | -1.5 | -0.2 |
| Open space index | 0.0 | 1.0 | -.0.6 | -1.2 | 0.1 |
| Local political pressure index (-) | -1.4 | 4.4 | -3.0 | -4.0 | -1.9 |
| State political involvement index | -1.8 | 2.4 | -0.5 | -1.7 | 0.6 |
| State court involvement index (-) | 1.0 | 3.0 | -1.5 | -2.5 | -0.6 |
Note: The estimated impacts and associated confidence intervals are based on the cost-weighted regression with the Wharton index components in table 8. The (+) and (-) symbols indicate index components that had significant positive and significant negative coefficients, respectively, in that
regression. The impact on the place fixed effects represents the estimated change in the fixed effect when one index component at a time is adjusted from the ![]() percentile of its
distribution for the 666 places to the
percentile of its
distribution for the 666 places to the ![]() percentile. Each place has an equal weight for the purpose of constructing the distributions. The 95 percent confidence interval for each
effect is calculated from the bootstrapped variance-covariance matrix of the coefficient estimates.
percentile. Each place has an equal weight for the purpose of constructing the distributions. The 95 percent confidence interval for each
effect is calculated from the bootstrapped variance-covariance matrix of the coefficient estimates.
References
Altug, Sumru. 1989. "Time-to-Build and Aggregate Fluctuations: Some New Evidence." International Economic Review 30(4): 889-920.
Burge, Gregory, and Keith Ihlanfeldt. 2006a. "Impact Fees and Single-Family Home Construction." Journal of Urban Economics 60(2): 284-306.
Burge, Gregory, and Keith Ihlanfeldt. 2006b. "The Effect of Impact Fees on Multifamily Housing Construction." Journal of Regional Science 46(1): 5-23.
Casaras, Miguel. 2006. "Time-to-Build, Monetary Shocks, and Aggregate Fluctuations." Journal of Monetary Economics 53(6): 1161-76.
Christiano, Lawrence J., and Richard M. Todd. 1996. "Time to Plan and Aggregate Fluctuations." Federal Reserve Bank of Minneapolis Quarterly Review 20(1): 14-27.
Christiano, Lawrence J., and Robert J. Vigfusson. 2003. "Maximum Likelihood in the Frequency Domain: The Importance of Time-to-Plan." Journal of Monetary Economics 50(4): 789-815.
Del Boca, Alessandra, et al. 2008. "Investment and Time to Plan and Build: A Comparison of Structures vs. Equipment in a Panel of Italian Firms." Journal of the European Economic Association 6(4): 864-89.
Dixit, Avinash K., and Robert S. Pindyck. 1994. Investment Under Uncertainty (Princeton, NJ: Princeton University Press).
Edge, Rochelle M. 2007. "Time-to-Build, Time-to-Plan, Habit-Persistence, and the Liquidity Effect." Journal of Monetary Economics 54(6): 1644-69.
Fischel, William A. 2001. The Homevoter Hypothesis: How Home Values Influence Local Government (Cambridge, MA: Harvard University Press).
Glaeser, Edward L., and Bryce A. Ward. 2009. "The Causes and Consequences of Land Use Regulations: Evidence from Greater Boston." Journal of Urban Economics 65(3): 265-78.
Gyourko, Joseph. 2009. "Housing Supply." Annual Review of Economics 1:295-318.
Gyourko, Joseph, Albert Saiz, and Anita Summers. 2008. "A New Measure of the Local Regulatory Environment for Housing Markets: The Wharton Residential Land Use Regulatory Index." Urban Studies 45(3), 693-729.
Holland, A. Steven, Steven H. Ott, and Timothy J. Riddiough. 2000. "The Role of Uncertainty in Investment: An Examination of Competing Investment Models Using Commercial Real Estate Data." Real Estate Economics 28(1): 33-64.
Huang, Haifang, and Yao Tang. 2012. "Residential Land Use Regulation and the US Housing Price Cycle Between 2000 and 2009." Journal of Urban Economics 71: 93-9.
Ihlanfeldt, Keith R. 2007. "The Effect of Land Use Regulation on Housing and Land Prices." Journal of Urban Economics 61: 420-35.
Ihlanfeldt, Keith R. 2004. "Exclusionary Land-Use Regulations with Suburban Communities: A Review of the Evidence and Policy Prescriptions." Urban Studies 41(2): 261-83.
Koeva, Petya. 2001. "Time-to-Build and Convex Adjustment Costs." IMF Working Paper WP/01/9. Washington, DC.
Koeva, Petya. 2000. "The Facts About Time-to-Build." IMF Working Paper WP/00/138. Washington, DC.
Krainer, Robert E. 1968. "The Time Profile of Capital Accumulation in the Automobile Industry." Journal of Political Economy 76(5): 1049-57.
Kydland, Finn E., and Edward C. Prescott. 1982. "Time to Build and Aggregate Fluctuations." Econometrica 50(6): 1345-70.
Mayer, Christopher J., and C. Tsuriel Somerville. 2000. "Land Use Regulation and New Construction." Regional Science and Urban Economics 30(6): 639-62.
Mayer, Thomas. 1960. "Plant and Equipment Lead Times." Journal of Business 33(2): 127-32.
Millar, Jonathan N. 2005a. "Gestation Lags and the Relationship Between Investment and Q in Regressions." Federal Reserve Board, Finance and Economics Discussion Series Working Paper 2005-28. Washington, DC.
Millar, Jonathan N. 2005b. "Gestation Lags for Capital, Cash Flows, and Tobin's Q." Federal Reserve Board, Finance and Economics Discussion Series Working Paper 2005-24. Washington, DC.
Montgomery, Michael R. 1995. "'Time-to-Build' Completion Patterns for Nonresidential Structures, 1961-1991." Economics Letters 48(2): 155-63.
Oliner, Stephen, Glenn Rudebusch, and Daniel Sichel. 1995. "New and Old Models of Business Investment: A Comparison of Forecasting Performance." Journal of Money, Credit, and Banking 27(3): 806-26.
Palm, Franz C., H.M.M. Peeters, and G.A. Pfann. 1993. "Adjustment Costs and Time-to-Build in Factor Demand in the U.S. Manufacturing Industry." Empirical Economics 18(2): 639-71.
Peeters, Marga. 1998. "Persistence, Asymmetries, and Interrelation in Factor Demand." Scandinavian Journal of Economics 100(4): 747-64.
Quigley, John M., and Larry A. Rosenthal. 2005. "The Effects of Land Use Regulation on the Price of Housing: What Do We Know? What Can We Learn?" Cityscape 8(1): 69-137.
Saiz, Albert. 2010. "The Geographic Determinants of Housing Supply." Quarterly Journal of Economics 125(3): 1253-96.
Saks, Raven. 2008. "Job Creation and Housing Construction: Constraints on Metropolitan Area Employment Growth." Journal of Urban Economics 64(1): 178-95.
Sivitanidou, Rena, and Petros Sivitanides. 2000. "Does the Theory of Irreversible Investments Help Explain Movements in Office-Commercial Construction?" Real Estate Economics 28(4): 623-61.
Taylor, John B. 1982. "The Swedish Investment Funds System as a Stabilization Policy Rule." Brookings Papers on Economic Activity, no. 1: 57-99
Zhou, Chunsheng. 2000. "Time-to-Build and Investment." Review of Economics and Statistics 82(2): 273-82.
A. Regression Results for Year Effects
Table A.1 presents the regression results that lie behind the year effects shown in Figures 4 through 6. These results come from a regression that includes all of the variables in the baseline regression plus interaction terms between the year dummy variables and three sets of other dummy variables: (a) dummies for the type of building to be constructed by the project, (b) dummies for MSA population size groups, and (c) dummies for the nine Census Bureau geographic divisions. We estimated this augmented regression using the same maximum likelihood procedure with bootstrapped standard errors as for the baseline regression.
Table A.1
Coefficients on Year Dummies in Augmented Regression
| Variable | 1999 | 2000 | 2001 | 2002 | 2003 | 2005 | 2006 | 2007 | 2008 | 2009 | 2010 |
|---|---|---|---|---|---|---|---|---|---|---|---|
| Uninteracted year dummies | -2.01 (.97) | -2.13 (.86) | .30 (.85) | -.41 (.68) | .40 (.73) | 2.14 (.74) | 1.11 (.69) | .92 (.68) | 2.02 (.72) | 1.77 (.92) | 2.18 (.84) |
| Interaction with: Building type (omitted: office) Retail | 1.75 | .58 | -.72 | -1.24 | -.74 | -.02 | -.75 | -.30 | .40 | -1.21 | .08 |
| Interaction with: Building type (omitted: office) Retail (Standard Error) | (.73) | (.64) | (.67) | (.58) | (.55) | (.50) | (.55) | (.53) | (.56) | (.63) | (.59) |
| Interaction with: Building type (omitted: office) Warehouse | -2.08 | -1.77 | -3.11 | -2.50 | -.63 | -1.10 | -.90 | -1.83 | -1.29 | -.81 | -2.12 |
| Interaction with: Building type (omitted: office) Warehouse (Standard Error) | (.99) | (.89) | 1 (.90) | (.87) | (.84) | (.77) | (.88) | (.75) | (.83) | (.97) | (.86) |
| Interaction with: Building type (omitted: office) Hotel | -.84 | -.16 | -1.33 | -1.82 | .62 | 1.85 | 3.40 | .02 | .37 | 2.95 | 1.84 |
| Interaction with: Building type (omitted: office) Hotel (Standard Error) | (1.46) | (1.62) | (1.54) | (1.55) | (1.55) | (1.49) | (1.35) | (1.21) | (1.19) | (1.30) | (1.50) |
| Interaction with: MSA population group (omitted: top 25 MSAs) First quartile excluding top 25 | .10 | .32 | -.19 | .53 | .09 | -.22 | -.90 | -.53 | -.94 | -.58 | .16 |
| Interaction with: MSA population group (omitted: top 25 MSAs) First quartile excluding top 25 (Standard Error) | (.78) | (.71) | (.76) | (.65) | (.62) | (.59) | (.60) | (.56) | (.58) | (.72) | (.68) |
| Interaction with: MSA population group (omitted: top 25 MSAs) Second quartile | 1.01 | 1.05 | -.17 | 2.90 | .22 | -.25 | .41 | -.74 | -1.38 | -.21 | -.09 |
| Interaction with: MSA population group (omitted: top 25 MSAs) Second quartile (Standard Error) | (1.13) | (1.09) | (.94) | (.94) | (.80) | (.81) | (1.01) | (.81) | (.84) | (.91) | (.84) |
| Interaction with: MSA population group (omitted: top 25 MSAs) Third and fourth quartiles | -1.97 | .45 | -.72 | -1.04 | .95 | -.32 | -.07 | -.27 | -1.65 | -.45 | -1.44 |
| Interaction with: MSA population group (omitted: top 25 MSAs) Third and fourth quartiles (Standard Error) | (1.14) | (1.13) | (1.25) | (1.09) | (1.01) | (1.17) | (.96) | (.89) | (1.11) | (1.21) | (1.05) |
| Interaction with: Census Division (omitted: South Atlantic) Pacific | -.73 | -.88 | -.31 | .44 | .47 | -.40 | 3.51 | 2.39 | 2.64 | 3.43. | 3.24 |
| Interaction with: Census Division (omitted: South Atlantic) Pacific (Standard Error) | (1.00) | (.96) | (.99) | (.96) | (1.00) | (.93) | (1.00) | (.88) | (1.02) | (1.28) | (1.16) |
| Interaction with: Census Division (omitted: South Atlantic) Mountain | 1.03 | .65 | .09 | .05 | -1.85 | -2.05 | .78 | 1.05 | 1.80 | 2.63 | 1.68 |
| Interaction with: Census Division (omitted: South Atlantic) Mountain (Standard Error) | (1.12) | (.93) | (1.04) | (.92) | (.85) | (.76) | (.78) | (.79) | (.84) | (.96) | (1.02) |
| Interaction with: Census Division (omitted: South Atlantic) West North Central | 3.26 | 1.25 | 1.30 | -.13 | -1.21 | -2.37 | .71 | 1.29 | 2.03 | -.00 | .58 |
| Interaction with: Census Division (omitted: South Atlantic) West North Central (Standard Error) | (1.40) | (.94) | (1.28) | (.90) | (.72) | (.73) | (1.09) | (.83) | (.97) | (1.29) | (1.03) |
| Interaction with: Census Division (omitted: South Atlantic) West South Central | 3.85 | 2.29 | 2.27 | 1.22 | -1.19 | -2.71 | -.46 | -1.31 | -1.03 | .03 | -.11 |
| Interaction with: Census Division (omitted: South Atlantic) West South Central (Standard Error) | (1.18) | (1.10) | (.98) | (.87) | (.84) | (.78) | (.76) | (.71) | (.78) | (.98) | (.79) |
| Interaction with: Census Division (omitted: South Atlantic) East North Central | 2.48 | .55 | .45 | -.55 | -2.43 | -2.38 | -1.07 | -.05 | -.09 | -1.62 | -1.55 |
| Interaction with: Census Division (omitted: South Atlantic) East North Central (Standard Error) | (1.04) | (.84) | (.85) | (.69) | (.64) | (.69) | (.61) | (.63) | (.69) | (.83) | (.77) |
| Interaction with: Census Division (omitted: South Atlantic) East South Central | 2.28 | -.75 | -1.10 | -.23 | -1.88 | -1.06 | .63 | 1.02 | .35 | -.98 | -.20 |
| Interaction with: Census Division (omitted: South Atlantic) East South Central (Standard Error) | (1.11) | (.96) | (.83) | (.82) | (.73) | (.88) | (.64) | (.70) | (.74) | (.93) | (.89) |
| Interaction with: Census Division (omitted: South Atlantic) New England | 4.37 | 1.11 | 1.57 | -.16 | -1.24 | -.98 | 1.23 | .89 | 1.01 | 2.23 | 1.88 |
| Interaction with: Census Division (omitted: South Atlantic) New England (Standard Error) | (2.30) | (1.29) | (1.25) | (1.00) | (.93) | (.98) | (.93) | (.84) | (.92) | (1.20) | (1.09) |
| Interaction with: Census Division (omitted: South Atlantic) Middle Atlantic | 2.16 | 1.49 | 1.26 | 1.49 | -.08 | 1.10 | 3.20 | 2.27 | 2.44 | 1.70 | 2.58 |
| Interaction with: Census Division (omitted: South Atlantic) Middle Atlantic (Standard Error) | (1.09) | (1.08) | (1.11) | (1.08) | (.83) | (.89) | (.87) | (.77) | (.79) | (.87) | (1.01) |
Note: Estimated by a maximum likelihood procedure that accounts for right censoring and interval reporting of the time-to-plan data.Bootstrap standard errors are shown in parentheses. A total of 500 bootstrap replications were run; 492 drew samples in which all parameters could be identified. Asterisks indicate significance at the 5 percent level. Shaded fields signify that the coefficient is significant at the 5 percent level, with blue for negative coefficients and yellow for positive coefficients. The explanatory variables omitted from this table include a constant, month-of-year dummy variables, MSA dummy variables, and the full set of project and county characteristics. Year dummies for 2004 are omitted from the regression to avoid perfect collinearity.
Figure 1: Estimated Planning Duration by Metropolitan Area: for Standardized Project, in months
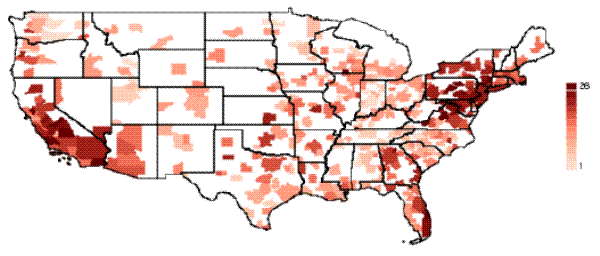 Figure 1 Data
Figure 2: Distribution of Time to Plan Across MSAs: for Project with Standardized Characteristics
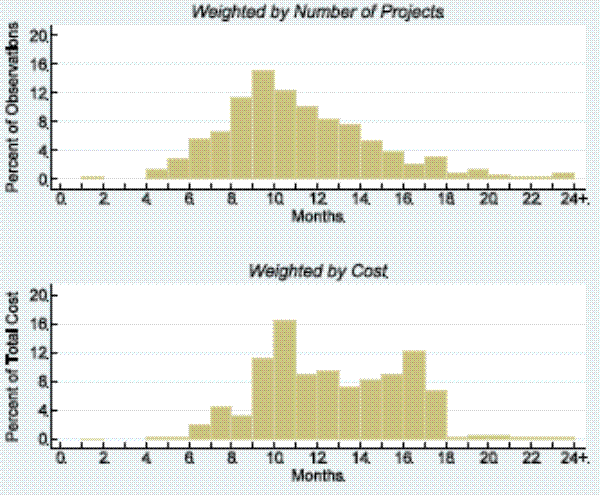 Figure 2 Data
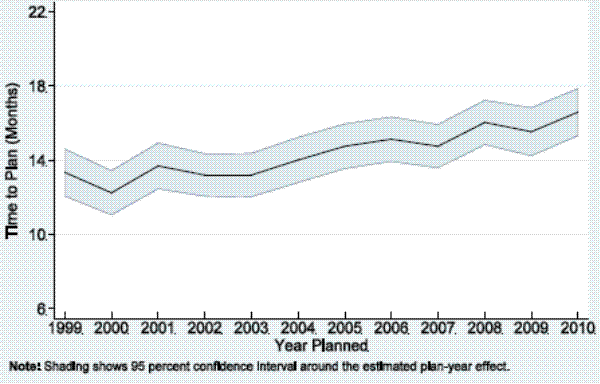
Figure 4: Estimated Plan-Year Effects: by Building Type
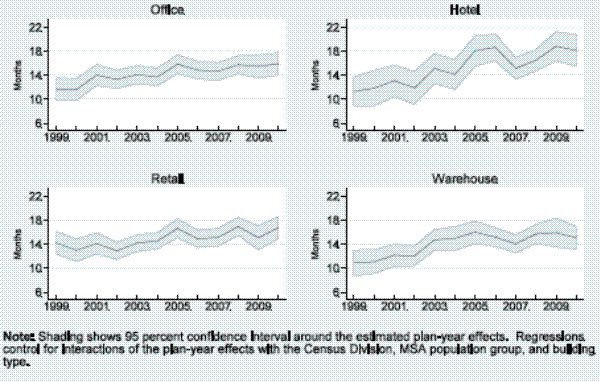 Figure 4 Data
Note: Regressions control for interactions of the plan-year effects with the Census Division, MSA population group, and building type.
Figure 5: Estimated Plan-Year Effects: by MSA Population Group
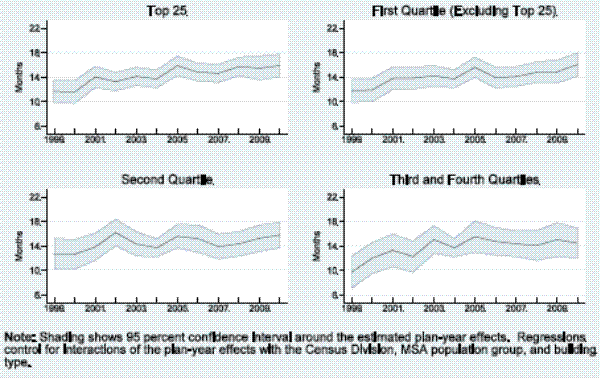 Figure 5 Data
Note: Regressions control for interactions of the plan-year effects with the Census Division, MSA population group, and building type.
Figure 6: Estimated Plan-Year Effects: by Census Division
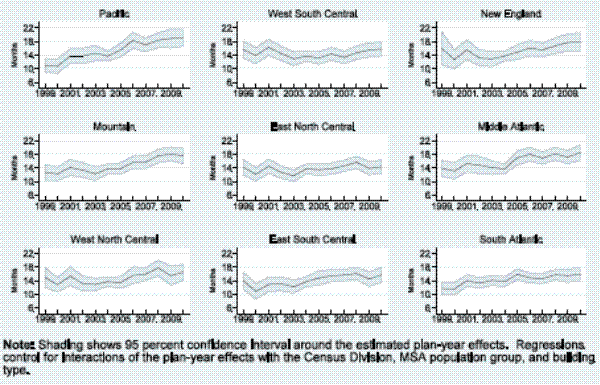 Figure 6 Data
Note: Regressions control for interactions of the plan-year effects with the Census Division, MSA population group, and building type.
Figure 7: Distribution of Time to Plan
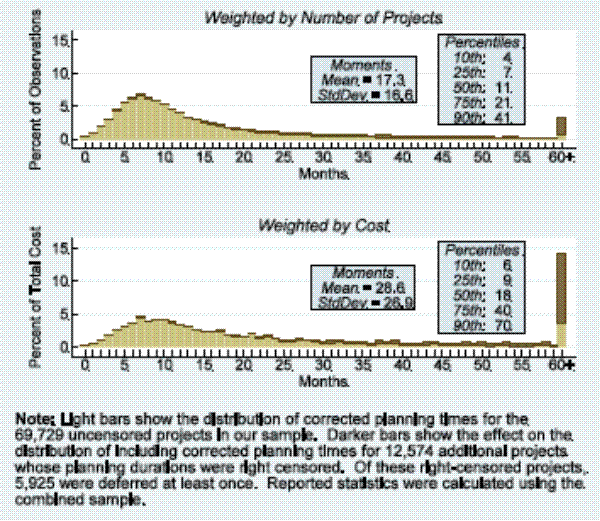 Figure 7 Data
Note: Light bars show the distribution of corrected planning times for the 69,729 uncensored projects in our sample. Darker bars show the effect on the distribution of including corrected planning times of 12,574 additional projects whose planning durations were right censored. Of these right-censored projects, 5,925 were deferred at least once. Reported statistics were calculated using the combined sample.