This paper reports on tail risk premiums in two tail risk hedging strategies: the S&P 500 puts and the VIX calls. As a new measure of tail risk, we suggest using a model-free, risk-neutral measure of the volatility of volatility implied by a cross section of the VIX options, which we call the VVIX index. The tail risk measured by the VVIX index has forecasting power for future tail risk hedge returns. Specifically, consistent with the literature on rare disasters, an increase in the VVIX index raises the current prices of tail risk hedges and thus lowers their subsequent returns over the next three to four weeks. Furthermore, we find that volatility of volatility risk and its associated risk premium both significantly contribute to the forecasting power of the VVIX index, and that the predictability largely results from the integrated volatility of volatility rather than volatility jumps.
1 Introduction
The recent financial crisis has provoked an interest in tail risk hedging strategies that are structured to generate positive payoffs in bad states of the world in which asset values plunge, market volatility soars, funding/market liquidity drops, and institutional investors are forced to deleverage their risk exposures because of higher margin and haircut rates. Despite the growing interest in tail risk hedges, little is known about their risk premiums and thus their expected returns. The financial media expresses skepticism about the efficacy of tail risk hedges because the increased demand following the 2008 financial crisis has made them more expensive.2 Against this backdrop, the objective of this paper is to propose a new measure of marketwide tail risk and examine its relation to expected returns on two popular forms of tail risk hedges: the out-of-the-money (OTM) S&P 500 (SPX) put options and the OTM VIX call options.
As a new measure of tail risk, this paper suggests using a model-free, risk-neutral measure of the volatility of volatility, which we call the VVIX index, that is obtained by applying the approach of Bakshi, Kapadia, and Madan (2003) to a cross section of the VIX options. The market's perception of tail risk can affect stock index dynamics through two stochastic channels: a jump process and a stochastic volatility process with a leverage effect, which is a negative correlation between changes of prices and volatility. Whereas most of the existing papers identify tail risk through the lens of a jump process, this paper takes the distinct perspective that tail risk information can be impounded into the volatility of stochastic volatility as even a small change in that variable can have a critical influence on left tails of return distributions. In addition, we provide evidence that the VVIX index is more relevant for measuring tail risk than the VIX index, which is commonly called the Wall Street fear index.
A central hypothesis tested in this paper is the negative relation between tail risk and expected returns on tail risk hedging strategies. When tail risk is high, investors, whether risk-averse representative agents or financially constrained intermediaries, will be willing to pay a higher price for a tail risk hedging asset. That is, a higher level of tail risk increases the current prices of tail risk hedges, and thus, lowers their subsequent returns over the next period. The negative relation is consistent with the rare disaster literature predicting a positive relation between rare disaster risk and future stock index returns (see, for example,Barro (2006); Gabaix (2008); and Chen, Joslin, and Ni (2013)). When tail risk is high, investors will charge higher tail risk premiums on stock indices because their returns are positively correlated with tail risk.
Our empirical evidence is statistically strong and economically large for each tail risk hedging strategy. Consistent with the hypothesis, a higher level of the VVIX index predicts lower tail risk hedge returns three to four weeks into the future, implying that the tail risk hedging assets become more expensive when tail risk is high. A one standard deviation increase in the current VVIX index is associated with a 1.32% to 2.19% decrease in the next day's SPX put returns and a 0.68% to 1.01% decrease in the next day's VIX call returns. This empirical result is robust to five other tail risk measures that have been developed in the literature, including the VIX index, the high-frequency jump variation (JV) of Barndorff-Nielsen and Shephard (2004), the jump/tail index (JTIX) of Du and Kapadia (2012), the fear index (FI) of Bollerslev and Todorov (2011), and the tail risk index (TAIL) of Kelly.
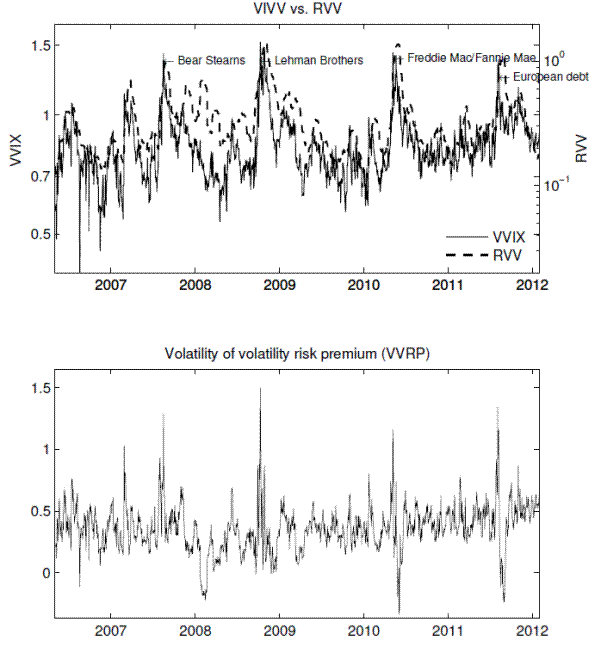
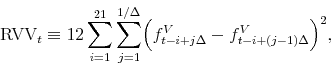
As the VVIX index compounds both information on volatility of volatility risk and its associated risk premium, the true source of the predictability of the VVIX index is not clear. To uncover the true source we introduce an approach to separating the VVIX index into a physical measure of volatility of volatility (RVV) and a volatility of volatility risk premium (VVRP). RVV is obtained by computing the realized variance of five-minute front-month VIX future returns over the past one month. VVRP is then defined as the difference between the squared VVIX index and RVV. By running bivariate regressions of future tail risk hedge returns against RVV and VVRP, we find that they both significantly contribute to the forecasting power of the VVIX index, although the former is more statistically significant than the latter.
The VVIX index is comprised of two stochastic components: the variation attributable to diffusive movements, which we refer to as the integrated volatility of volatility (IVV), and the variation attributable to volatility jumps (VJUMP). We now take a deeper examination into which of the two components is truly responsible for the predictability of the VVIX index. Following the decomposition approach of Du and Kapadia (2012), IVV is obtained by applying the approach of Demeterfi, Derman, Kamal, and Zou (1999 to the VIX options, and VJUMP is defined as the difference between the squared IVV and the squared VVIX. By running bivariate regressions of future tail risk hedge returns against IVV and VJUMP, we find that the predictability largely stems from IVV rather than VJUMP; VJUMP loses statistical significance for the SPX put returns regardless of moneyness.
Our empirical findings add to the literature showing that tail risk has a crucial impact on asset returns. For example,Rietz (1988) and Barro (2006) show that introducing a tail risk factor to the standard asset pricing model can explain the equity premium puzzle with reasonable levels of risk aversion. Gourio (2008), Gabaix (2008, 2012), and Wachter (2011) extend the literature to versions of time-varying rare disaster models to resolve the well-known asset pricing puzzles such as return predictability and high stock market volatility. Jurek (2009) and Burnside, Eichenbaum, Kleshchelski, and Rebelo (2011) argue that positive excess returns to carry trades are associated with risk compensation for a rare disaster in currency rates. Collin-Dufresne, Goldstein, and Yang (2010) emphasize the importance of catastrophic risk in the pricing of super-senior CDO (collateralized debt obligation) tranches. Kelly (2011) and Kelly and Hao (2012) find that tail risk is a priced factor in cross sectional stock and hedge fund returns, respectively.
The rest of the paper is organized as follows. In Section ![]() , we introduce the VVIX index as a tail risk indicator. Section
, we introduce the VVIX index as a tail risk indicator. Section ![]() examines tail risk premiums in tail risk hedging strategies. Further applications are presented in Section
examines tail risk premiums in tail risk hedging strategies. Further applications are presented in Section ![]() .
Finally, Section
.
Finally, Section ![]() concludes.
concludes.
2 Measuring tail risk
Measuring or predicting tail risk is challenging because a tail risk factor is latent and a tail risk event is rare by definition. The existing tail risk methodologies are based on different data sources. While Barro (2006) and Barro and Ursua (2008) compute the macroeconomic disaster risk from a cross-country data set of the consumptions and GDPs, others attempt to identify tail risk from financial market data. In particular, the option market offers a promising environment in which to measure tail risk, as options contain forward-looking information about future market returns. In light of this fact, Bollerslev and Todorov (2011) develop a new fear index from the deep OTM SPX puts, and and Du and Kapadia (2012) devise an index of jump and tail risk from a cross section of the OTM SPX options. Alternatively, Kelly (2011) proposes a measure of tail risk that is implied in extreme cross-sectional stock returns. Researchers such as Barndorff-Nielsen and Shephard (2004) introduce a model-free estimate of jump risk by using high-frequency asset returns.
Despite the substantive progress, a definitive measure of tail risk is still lacking and under debate. In this section, we will intuitively explain how tail risk information can be impounded into the dynamics of volatility of volatility, develop a methodology for backing out such information from a cross section of the VIX options, and analyze the empirical behavior of the VVIX index as a tail risk measure. Additionally, we will introduce two decomposition methods of the VVIX, with one separating it into RVV and VVRP and the other into IVV and VJUMP.
2.1 How is volatility of volatility related to tail risk?
This subsection aims to understand how volatility of volatility can be a proper measure of tail risk by using an affine stochastic volatility model, which allows for an analytic solution to skewness and kurtosis. Given a probability space
![]() and information filtration
and information filtration
![]() , the log stock index price,
, the log stock index price,
![]() , is assumed to follow the affine stochastic volatility model:
, is assumed to follow the affine stochastic volatility model:
where
We will now show that volatility of volatility is a critical determinant of both skewness and kurtosis of return distributions and thus tails of return distributions. Specifically, under the affine framework, it can be shown that the negative skewness is proportional to the volatility of
volatility (note that ![]() is negative), and that the excess kurtosis is proportional to the squared volatility of volatility:
is negative), and that the excess kurtosis is proportional to the squared volatility of volatility:
where
To further illustrate that ![]() has a significant impact on tails of return distributions, we compute volatility smirks of SPX index options for different levels of
has a significant impact on tails of return distributions, we compute volatility smirks of SPX index options for different levels of ![]() under the affine stochastic volatility framework. The relevant parameters, except for
under the affine stochastic volatility framework. The relevant parameters, except for ![]() , are obtained by taking the averages of those reported by Christoffersen. That is,
, are obtained by taking the averages of those reported by Christoffersen. That is,
![]() ,
,
![]() , and
, and
![]() . The low, mean, and high
. The low, mean, and high ![]() correspond to the lowest
(0.3796), mean (0.6151), and highest (0.8516) values of their estimates of the volatility of volatility, respectively. The initial volatility state,
correspond to the lowest
(0.3796), mean (0.6151), and highest (0.8516) values of their estimates of the volatility of volatility, respectively. The initial volatility state, ![]() , is assumed to be equal to the
long-run volatility. Lastly,
, is assumed to be equal to the
long-run volatility. Lastly,
![]() under the risk-neutral
under the risk-neutral ![]() measure where
measure where
![]() is assumed to be 2%.
is assumed to be 2%.
The four panels of Figure 4 plot the computed volatility smirks with 1, 3, 6, and 12 months to maturity where the moneyness is defined as strike prices divided by spot prices. OTM puts with moneyness of less than 1 are more expensive in times of high volatility of volatility than those of low volatility of volatility, whereas OTM calls with moneyness of greater than 1 are more expensive in times of low volatility of volatility than those of high volatility of volatility. This result implies that a higher level of volatility of volatility makes the left tail thicker, while making the right tail thinner, resulting in more left-skewed return distributions.
2.2 Constructing the VVIX index
The idea of linking volatility of volatility to tail risk sets this paper apart from other papers that introduce tail risk measures, such as Bollerslev and Todorov (2011); Backus, Chernov, and Martin (2011); and Du and Kapadia (2012). While a jump process has often been used as a tail risk modeling device, it has a critical shortcoming in practice. It is highly difficult to obtain precise estimates of jump-induced tail risk due to the limited availability of deep OTM SPX options. In other words, the precision of the jump-induced tail risk heavily relies on the existence and accuracy of often missing deep OTM SPX put options. Liu, Pan, and Wang (2005) express such a measurement, or inferential, issue about a rare jump, and develop an equilibrium model in which ambiguity over a jump process substantially affects the volatility smirk of option prices. In a related paper,Chen, Joslin, and Tran (2012) study the effect of disagreements about disaster risk on asset returns and risk sharing.
A nice feature of the VVIX index is that it is less prone to the issue of measurement errors than are other jump-induced tail risk measures. Note that the VVIX index is the second moment of VIX return distributions so its computation is heavily weighted toward the prices of slight and moderate OTM VIX options, which are more readily observable and more actively traded than deep OTM VIX options. As such, the accuracy of the VVIX index will not be affected as much by missing deep OTM options.
The computation of model-free, option-implied moments has been addressed by a number of researchers, including Bakshi, Kapadia, and Madan (2003); Carr and Wu (2009); Jiang and Tian (2005); Demeterfi, Derman, Kamal, and Zou (1999); and Britten-Jones and Neuberger (2000). Among these, we choose to use the approach of Bakshi, Kapadia, and Madan (2003) because it provides a more accurate measure of the quadratic variation when jump risk is significant than the CBOE VIX methodology (see Du and Kapadia (2012)). The procedure for computing the VVIX index follows.
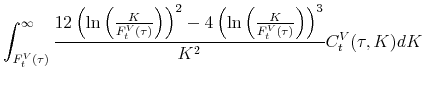
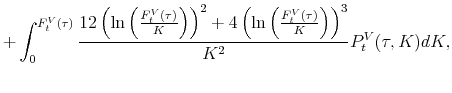
The model-free, option-implied moments are derived in terms of the prices of three hypothetical securities that pay quadratic, cubic, and quartic payoffs. The time-t prices of such hypothetical securities,
![]()
![]() and
and
![]() , are given by
, are given by
 |
(3) | ||
 |
(4) |
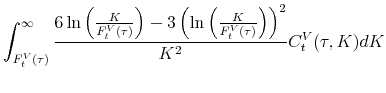 |
(5) | ||
 |
(6) |
and
 |
(7) | ||
 |
(8) |
where
VAR |
(9) |
where
 |
(10) |
Similar to the VIX index, we use the two closest times to maturity greater than eight days in order to interpolate a series of the 30-day VVIX index:
 |
(11) |
where
2.3 Empirical behavior of the VVIX index
Although VIX options trading began on February 24, 2006, it was inactive in the very first few months. The sample thus starts on May 1, 2006 and ends on January 31, 2012. Jiang and Tian (2007) report the possibility of large truncation errors in computing model-free moments because deep OTM options are often missing. To reduce such errors, we assume a wide grid of strike prices with $1 increments beyond the observed range of VIX option strike prices. Specifically, we extrapolate each of the missing implied volatilities by equating it to the nearest observed implied volatility and then convert the extrapolated volatility to the option price by using the Black-Scholes formula.
A market crash is usually accompanied by a stock market decline, a volatility increase, and a liquidity dry-up. Empirical behavior of the VVIX index is consistent with those typical characteristics of a market crash. Let us compute the SPX, VIX, VVIX, and liquidity changes as
where liquid is the stock market liquidity factor as measured by Pastor and Stam-baugh (2003) and
Table 1 presents a correlation matrix among the four market factor changes. ![]() is negatively correlated with
is negatively correlated with ![]() with a correlation of -0.45 , positively correlated with
with a correlation of -0.45 , positively correlated with ![]() with a correlation of 0.62 , and negatively correlated with
with a correlation of 0.62 , and negatively correlated with ![]() with a correlation of -0.12 . These correlations indicate that as the VVIX index rises, the stock market index tends to decline; market volatility tends
to grow; and market liquidity tends to drop.
with a correlation of -0.12 . These correlations indicate that as the VVIX index rises, the stock market index tends to decline; market volatility tends
to grow; and market liquidity tends to drop.
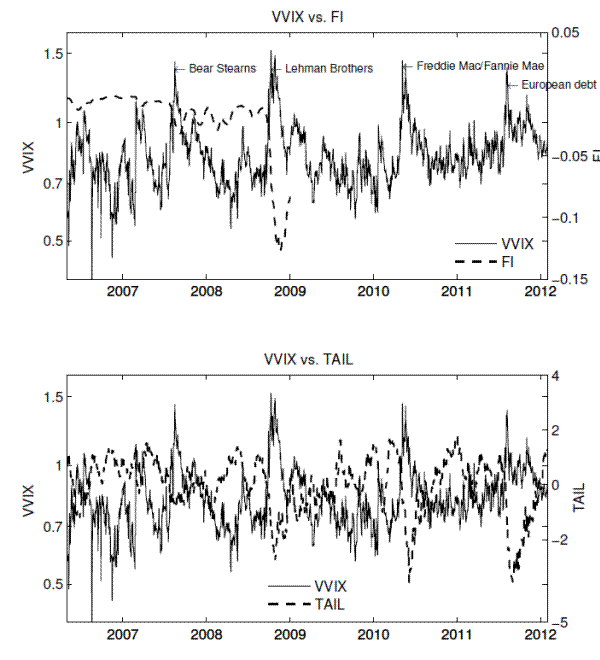
As further evidence for the potential of the VVIX index as a tail risk indicator, the spikes of the VVIX index correspond well with some of the recent crisis episodes. Panel B of Figure 2 presents the history of the VVIX index and its comparison with the VIX index. The VVIX index exhibits the four pronounced crisis periods, which are associated with Bear Stearns two hedge funds suspension, Lehman Brothers bankruptcy, Freddie Mac/Fannie Mae crisis, and European debt crisis, respectively.3 Compared with the VIX index, a distinct feature of the VVIX index is that it uncovers a high level of fear risk for the New Century Financial Corporation bankruptcy in April 2007, which is one of the precursors to the subsequent disaster.
2.4 Decomposing the VVIX index into RVV and VVRP
As the VVIX index represents a risk-neutral expectation of future volatility of volatility, it compounds both information on a physical expectation of future volatility of volatility and its associated risk premium. In this subsection, we propose an approach to separating the VVIX index into RVV and VVRP. First, we obtain RVV by computing the annualized realized variance of the five-minute front-month VIX future returns over the past 21 trading days, based on Andersen, Bollerslev, Diebold, and Ebens (2001); Andersen, Bollerslev, Diebold, and Labys (2003); and Barndorff-Nielsen and Shephard (2002)
 |
where
We now turn to defining a volatility of volatility risk premium. VVRP is defined as the difference between risk-neutral and physical quadratic variations. On one hand, Du and Kapadia (2012) show that the Bakshi, Kapadia, and Madan (2003) method approximates well the risk-neutral quadratic
variation when a stochastic drift term is negligible at short horizons. On the other hand, Andersen, Bollerslev, Diebold, and Labys (2003) show that the realized variance converges almost surely to the physical quadratic variation as ![]() decreases. Accordingly, VVRP can be computed as
decreases. Accordingly, VVRP can be computed as
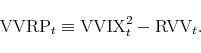
Table 2 shows the summary statistics for RVV and VVRP, and Figure 3 presents their time series plots. Similar to the VVIX index, RVV also corresponds with the four recent crisis episodes. VVRP takes positive values most of the time, with an average of 0.358, implying that volatility of volatility is negatively priced. The negative pricing of volatility of volatility is not surprising because volatility of volatility tends to increase during market downturns, playing a role of hedging against the stock market.
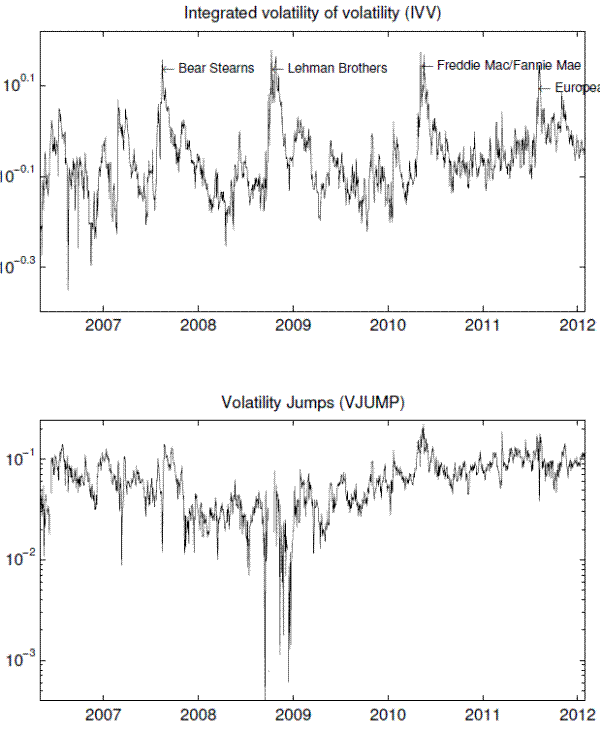
Decomposing the VVIX index into IVV and VJUMP
Provided that the VIX future price is driven by both diffusive and jump processes, the quadratic variation can be expressed as the sum of the integrated variance and jump variation:
![\begin{equation*}\begin{aligned}\text{QV}_{(t,t+\tau]} = \underbrace{\int_{t}^{t+\tau} \eta_s ds}_{\text{integrated variance}} + \underbrace{\int_{t}^{t+\tau} \int_{\R^0}x^2 \nu(dx \times ds),}_{\text{jump variation}} \end{aligned}\end{equation*}](img64.gif)
where QV
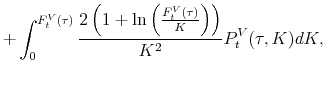
![\begin{equation*}\begin{aligned}\mvvnj_t^2 & =\frac{2e^{r_t^f\tau}}{\tau} \left [ \int_{F_t^{V}(\tau)}^{\infty} \frac{C_t^V(\tau ,K)}{K^2}dK + \int^{F_t^{V}(\tau)}_{0} \frac{P_t^V(\tau ,K)}{K^2}dK \right ] -\dfrac{2(e^{r_t^f\tau}-1-r_t^f\tau)}{\tau}. \end{aligned}\end{equation*}](img70.gif) |
VJUMP is defined as the difference between the squared IVV and the squared VVIX:
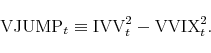 |
Notice that we subtract the squared VVIX from the squared IVV but not the other way around. Because of this way of subtraction, positive (negative) values of VJUMP imply positive (negative) volatility jumps.
Table 2 shows the summary statistics for IVV and VJUMP, and Figure 4 presents their time series plots. Similar to the VVIX index, IVV also corresponds with the four recent crisis episodes. VJUMP takes positive values most of the time, implying that volatility tends to jump in a positive direction. Interestingly, the figure exhibits low levels of volatility jump risk during the Lehman bankruptcy in 2008. A potential explanation for this would be that a strong mean reversion property of volatility may reduce the likelihood of positive volatility jumps in periods of high volatility.
3 Tail risk premiums in tail risk hedging strategies
3.1 Tail risk hedging strategies
As traditional risk management, such as diversification, reveals its limit due to increased correlations during stressful periods, traumatized investors have become more interested in strategic tail risk management that makes use of the derivatives markets.4 Strategic tail risk management varies across asset classes. For example, equity risk can be hedged by taking a long position in the stock index put options or volatility derivatives such as VIX futures and options. The CDX tranches can be used as a means to hedge credit risk. As interest rates tend to decrease during economic depressions, a fixed-income investor may enter a fixed receiver swaption.
In particular, our empirical analysis looks at the OTM SPX puts and the OTM VIX calls. Stock index put options allow investors to safeguard against their equity portfolios' losses beyond a certain threshold level with a small amount of capital. It is well recognized that index put buyers will benefit from stock index declines in times of crisis, but this understanding is not complete. In fact, there is another mechanism that makes SPX puts effective tail risk hedges. Volatility, another important driver of option values, tends to increase dramatically during market crashes. For example, the VIX index more than quadrupled from 18.8% (lowest) to 80.9% (highest) in the second half of 2008. Taken together, both a stock market decline and a volatility increase would result in higher stock index put prices in times of crisis.
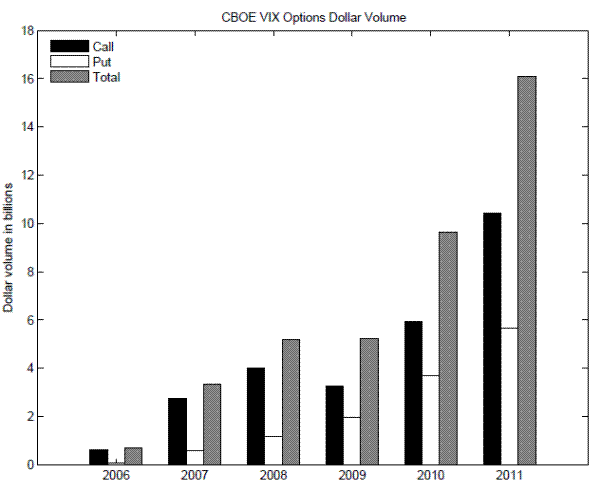
Recently, the market has seen a proliferation of the VIX derivatives, including the VIX futures, VIX options, and VIX-related exchange-traded funds and notes. For instance, the VIX option dollar volume has grown dramatically from 0.7 billion dollars in 2006 to 16 billion dollars in 2011, as seen in Figure 5. Moreover, the VIX calls are more actively traded than the VIX puts. The financial press points to the use of VIX derivatives as tail risk hedges to explain their increasing popularity.5
3.2 Computing residual option returns
Analyzing risk premiums on options poses two challenges. First, options are levered investments with nonlinear payoffs so their return distributions are far from normality. Emphasizing a statistical difficulty in analyzing option returns, Broadie, Chernov, and Johannes (2009) argue that normality-based standard statistical tools can mislead a hypothesis test of interest, and they find that the large returns to writing put options are not inconsistent with the Black-Scholes or the affine stochastic volatility models. Second, option returns are largely driven by innovations in the underlying asset price and volatility. It is therefore necessary to isolate the effect of a variable of interest--tail risk in this paper--from the effects of the two underlying risks.
To alleviate the difficulties, we obtain and analyze the so-called residual option returns that are immune to the underlying asset's price and volatility risks. In fact, this idea is borrowed from Christoffersen, Goyenko, Jacobs, and Karoui (2012) who examine illiquidity premiums in options. Let us explain how we compute residual option returns. First, we compute an option's excess delta-hedged return:
where, with an abuse of notation,
 |
(19) |
With respect to options' maturities, we focus on relatively short-term options with 8 to 90 days to expiration.7 With respect to moneyness, we define a
triple of moneyness bins for each of the SPX puts and the VIX calls. Specifically, the SPX OTM puts are classified into the slight OTM (0.95< k <1.00), the medium OTM (0.90 < k < 0.95), and the deep OTM (0.85 < k <0.90). We use wider ranges of moneyness for the VIX calls than the SPX puts because volatility of volatility is more volatile than volatility. The VIX OTM calls are classified into the slight OTM (1.0 < k < 1.1), the medium OTM (1.1 < k < 1.2), and the deep OTM (1.2 < k <1.3). The delta-hedged returns are equally averaged across all options that belong to the ith moneyness bin, which is denoted by
![]() . The weighting scheme, whether equally weighted or price weighted, does not affect our empirical findings.
. The weighting scheme, whether equally weighted or price weighted, does not affect our empirical findings.
Although delta hedging attenuates the price sensitivity in option returns, it is still not ideal for studying the effect of tail risk on option returns.
![]() is not completely free of the underlying price risk because the Black-Scholes delta used in this paper causes hedging errors, and because delta hedging by itself fails to account
for the second-order (gamma) effect of price changes. More important,
is not completely free of the underlying price risk because the Black-Scholes delta used in this paper causes hedging errors, and because delta hedging by itself fails to account
for the second-order (gamma) effect of price changes. More important,
![]() is now largely driven by changes in underlying asset volatility. For these reasons, we obtain the residual option returns by running the quadratic regressions of the delta-hedged
returns onto changes of underlying asset price and volatility for each of the SPX and VIX options. That is, to obtain the residual SPX option returns we run the following form of regression for each moneyness bin:
is now largely driven by changes in underlying asset volatility. For these reasons, we obtain the residual option returns by running the quadratic regressions of the delta-hedged
returns onto changes of underlying asset price and volatility for each of the SPX and VIX options. That is, to obtain the residual SPX option returns we run the following form of regression for each moneyness bin:
where the five variables on the right-hand side are associated with delta, vega, gamma, vomma, and vanna risks in the SPX options, respectively.
Similarly, to obtain the residual VIX option returns we run the following form of regression for each moneyness bin:
where the five variables on the right-hand side are associated with delta, vega, gamma, vomma, and vanna risks in the VIX options, respectively.
Finally, the residual option returns are defined by summing the constant term and residual error of the regressions (17) and (18):
where, with an abuse of notation,
It is important to note that the residual option returns are virtually free of the underlying price and volatility risks up to the second order, while affected by any other risk factors such as tail risk. Because of this feature, the residual option returns allow us to look at the negative relation between tail risk and tail risk hedge returns in isolation. In what follows, we will study tail risk premiums by running predictive regressions of the residual returns onto the VVIX index and other control variables.
3.3 Summary statistics for residual option returns
This subsection examines the statistical characteristics of daily residual option returns across different moneyness levels. Table 3 records the summary statistics including the means, bootstrapped p values, minimums, maximums, standard deviations, skewness, kurtosis, one-day autocorrelations, and Sharpe ratios. The residual returns are positively skewed and fat-tailed for each options market. For this reason, we use bootstrapped p values with 250,000 sample draws when testing a null hypothesis of zero mean returns.
Panel A of Table 3 shows that the SPX puts lose 3.34 to 5.47% per day. The p values of near zero indicate that the mean of residual SPX put returns is significantly different from zero at a 99% confidence level. Similarly, the VIX calls lose 2.27 to 2.44% per day, as can be seen in Panel B of Table 3. The corresponding p values of near zero mean that the mean of residual VIX call returns is significantly different from zero at a 99% confidence level. It is interesting that even though the average of the residual SPX put returns is lower than that of the residual VIX call returns, they have very similar Sharpe ratios, close to -0.4 , with the implication that there is some consistency in the pricing between the SPX puts and the VIX calls.
Given the fact that both tail risk hedges yield significantly negative returns, their prices seem to be excessive after the underlying price and volatility risks are appropriately adjusted for. The result is consistent with the well-known overpricing puzzle of the SPX options (see, for example, Bondarenko (2003) and Constantinides, Jackwerth, and Perrakis (2009)). There is, however, a caveat for this argument. Generally, tail risk hedges perform poorly most of the time but offer positive payoffs on the very few days when investors' marginal utilities are highest. Simply put, a one-dollar gain in bad times is more valuable than an equal amount of loss in good times. It could be rather premature to conclude that tail risk hedges are overpriced just because they generate negative returns on average. Besides, the efficacy or fair pricing of tail risk hedges should be judged based on a long sample period that includes a sufficiently large number of stressful moments.
3.4 Predicting option returns using the VVIX index
Papers on rare disasters--for example, Barro (2006) and Gabaix (2008)--shed light on the relation between tail risk and expected asset returns. A main prediction of the literature is that an increase in tail risk results in higher subsequent stock index returns as risk-averse investors ask for higher risk premiums for taking on tail risk when it is high. In a related paper, Chen, Joslin, and Ni (2013) show that financially constrained intermediaries charge higher disaster risk premiums as crash risk rises. The relation between tail risk and expected stock index returns is therefore positive.Drawing on the literature, we posit that the relation between tail risk and expected tail risk hedge returns is negative. When tail risk is high, risk-averse investors are willing to pay higher prices for buying tail risk hedges, resulting in lower subsequent returns over the next period. To investigate the negative relation we take the realized residual returns as a proxy for the expected residual returns, following French, Schwert, and Stambaugh (1987) and Amihud (2002), and then run predictive regressions of the residual returns onto the VVIX index and control variables for each moneyness and each tail risk hedging strategy:
Notice that we include two basic control variables: the one-day-lagged residual returns,
Table 4 presents the regression results for the SPX puts and the VIX calls. Each explanatory variable is divided by its standard deviation so each regression coefficient can be interpreted as the impact of a one standard deviation change in that variable, and statistical significance is computed by Newey and West (1987) robust t-statistics with an optimal lag.
Regression 1 is the baseline regression that only includes the VVIX index and the two basic control variables. Consistent with the hypothesis, the negative relation is statistically significant for the SPX puts, with an expected sign. Specifically, a one standard deviation increase in the VVIX index results in a 1.32% to 2.19% decrease in the next day's SPX put returns. The result is statistically significant at 99% confidence levels with t-statistics of -4.48 to -5.54 . Besides, the coefficients of the VVIX index are more negative for the deep OTM SPX puts than the slight ones, as the former are more sensitive to tail risk than the latter.
The negative relation is statistically significant for the VIX calls as well. Specifically, a one standard deviation increase in the VVIX index results in a 0.68% to 1.01% decrease in the next day's VIX call returns. The result is statistically significant at 99% confidence levels, with t-statistics of -3.55 to -4.44 . Furthermore, the coefficients are more negative for the deep OTM VIX calls than the slight ones, as the former are more sensitive to tail risk than the latter.
In fact, it is the expected VVIX index that truly matters in predicting tail risk hedge returns. For this reason, we run the predictive regressions with the expected VVIX index that is obtained by assuming that the VVIX index follows an autoregressive process of order 1, and find that the expected VVIX index yields very similar empirical results to the current VVIX index, although the results are not reported in this paper.
In sum, the tail risk measured by the VVIX index is a priced factor in tail risk hedging strategies such as the SPX puts and the VIX calls, and thus an important driver of their expected returns. In particular, when investors fear tail risk more, tail risk hedges become more costly and thus their subsequent returns are lower. This finding contributes to a large body of literature showing that tail risk has a critical influence on asset returns. In a loosely related paper, Baltussen, Van Bekkum, and Van Der Grient (2012) take individual options' implied volatility of volatility as a proxy for Knightian uncertainty, and they find that it is priced in cross-sectional stock returns.
3.5 Predicting option returns using other tail risk measures
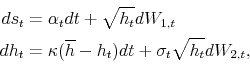
A variety of tail risk measures have been developed by using financial market data. In this subsection, we will look at whether the predictability of the VVIX index is robust to other tail risk measures and whether they have incremental information for future tail risk hedge returns beyond the
VVIX index. In particular, we cover five alternative tail risk measures: VIX, JV, JTIX, FI, and TAIL.8 The detailed procedures for computing ![]() and
and ![]() are provided in Appendix B, and the
are provided in Appendix B, and the
![]() and the
and the ![]() data were generously provided by Du and Kapadia (2012) and Bollerslev and Todorov
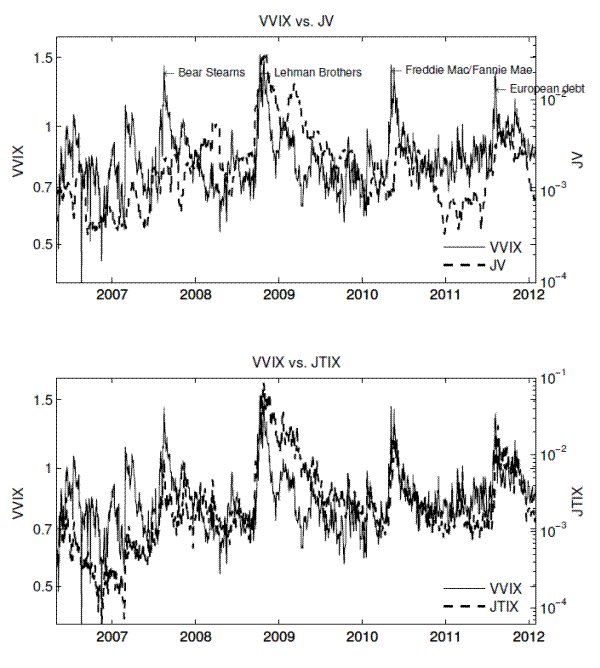
(2011), respectively. Table 2 provides the summary statistics and correlation matrix for those variables. Figures6 and 7 plot the time series of the tail risk measures and their comparisons with the VVIX index.
data were generously provided by Du and Kapadia (2012) and Bollerslev and Todorov
(2011), respectively. Table 2 provides the summary statistics and correlation matrix for those variables. Figures6 and 7 plot the time series of the tail risk measures and their comparisons with the VVIX index.
Regressions 2 through 6 in Table 4 show the regression results with each of VIX, JV, JTIX, FI, and TAIL included as a control variable on top of the VVIX index. Collectively, two empirical features are notable. First, the predictability of the VVIX index is robust to the other tail measures. The coefficients of the ![]() index are statistically significant and negative for each tail risk hedge returns, even after controlling for the other tail risk
measures.9 Second, none of the other tail risk measures show forecasting power for future tail risk hedge returns after the VVIX index is accounted
for.10
index are statistically significant and negative for each tail risk hedge returns, even after controlling for the other tail risk
measures.9 Second, none of the other tail risk measures show forecasting power for future tail risk hedge returns after the VVIX index is accounted
for.10
Note that some of the tail risk measures such as JV, JTIX, and FI are based on jump structures, and we find that these measures show little ability to forecast tail risk hedge returns compared with the VVIX index. We do not interpret this result as implying that jump risk has no impact on tail risk premiums because jump risk is known to be priced in the option literature. Rather, we interpret this evidence as implying that it is difficult to estimate jump-based tail risk measures with high precision.
3.6 Persistence of predictability
The regression results that we have looked at so far are based on one-day ahead predictive regressions. This subsection investigates how persistent predictability is over multi-week horizons. Table 5 shows the multi-week ahead predictive regression results of daily tail risk hedge returns. Each explanatory variable is divided by its standard deviation, and Newey and West (1987) robust t-statistics with an optimal lag are shown in parentheses.
Regression 1 shows that one-week ahead predictability is quite decisive for all moneyness levels, with t-statistics of -2.45 to -4.22 for the SPX puts and -3.00 to -3.29 for the VIX calls. Regression 3 suggests that the predictability for the SPX put returns can persist over the next three weeks, regardless of moneyness levels, at 95% or 99% confidence levels. Regression 4 indicates that the predictability for the medium and deep VIX call returns can persist over the next four weeks at 95% and 99% confidence levels, respectively.
In sum, the current VVIX index is capable of forecasting tail risk hedge returns three to four weeks into the future. In fact, this long-run predictability does not come as a surprise given the fact that a future VVIX index is predictable over the next few weeks. Table 2 shows that the VVIX index has a weekly autocorrelation of 0.759, which corresponds to a half-life of 2.51 weeks. Simply put, the persistence of the VVIX index is being translated into its multi-week predictability for tail risk hedge returns.
3.7 RVV versus VVRP
Table 6 presents the predictive regression results of tail risk hedge returns onto RVV and VVRP, with ewey and West (1987) robust t-statistics with an optimal lag in parentheses. Regression 1 only includes ![]() as an explanatory variable. The coefficients of
as an explanatory variable. The coefficients of ![]() are statistically significant
with t-statistics of -3.23 to -4.56 for the SPX puts
and -2.01 to -3.28 for the VIX calls. The negative signs are consistent with the
hypothesis that higher volatility of volatility is associated with higher tail risk, inducing lower subsequent returns on tail risk hedging assets.
are statistically significant
with t-statistics of -3.23 to -4.56 for the SPX puts
and -2.01 to -3.28 for the VIX calls. The negative signs are consistent with the
hypothesis that higher volatility of volatility is associated with higher tail risk, inducing lower subsequent returns on tail risk hedging assets.
Regression 2 only includes ![]() as an explanatory variable. The coefficients of
as an explanatory variable. The coefficients of ![]() are statistically significant at 99% confidence levels for the SPX puts, with t-statistics of -2.70 to -3.32 . The negative signs imply that higher levels of VVRP are associated with lower future returns on the SPX puts. In contrast, we do not find evidence that VVRP is associated with future returns on the VIX calls.
are statistically significant at 99% confidence levels for the SPX puts, with t-statistics of -2.70 to -3.32 . The negative signs imply that higher levels of VVRP are associated with lower future returns on the SPX puts. In contrast, we do not find evidence that VVRP is associated with future returns on the VIX calls.
Regression 3 shows that ![]() and
and ![]() both have forecasting power for
future tail risk hedge returns, although the coefficients of the former are more statistically significant than those of the latter, except for the deep VIX calls. Regression 3 shows more statistically significant coefficients of the VVIX index and larger adjusted
both have forecasting power for
future tail risk hedge returns, although the coefficients of the former are more statistically significant than those of the latter, except for the deep VIX calls. Regression 3 shows more statistically significant coefficients of the VVIX index and larger adjusted ![]() than each of Regressions 1 and 2. Overall, based on these empirical results, we argue that RVV and VVRP both significantly contribute to the forecasting power of the VVIX index.
than each of Regressions 1 and 2. Overall, based on these empirical results, we argue that RVV and VVRP both significantly contribute to the forecasting power of the VVIX index.
3.8 IVV versus VJUMP
Table 7 presents the predictive regression results of tail risk hedge returns onto IVV and VJUMP, with Newey and West (1987) robust t-statistics with an optimal lag in parentheses. Regression 1 shows the univariate regression results
with ![]() only included. The coefficients of
only included. The coefficients of ![]() are statistically
significant at 99% confidence levels for both SPX puts and VIX calls, regardless of moneyness. Similar to those of the VVIX index, the coefficients of IVV are all negative, implying that a higher level of IVV is associated with lower future tail risk hedge returns.
are statistically
significant at 99% confidence levels for both SPX puts and VIX calls, regardless of moneyness. Similar to those of the VVIX index, the coefficients of IVV are all negative, implying that a higher level of IVV is associated with lower future tail risk hedge returns.
Regression 2 shows the univariate regression results with ![]() only included. The coefficients of
only included. The coefficients of ![]() are statistically significant at 99% confidence levels for most of the cases except for the slight SPX puts. The coefficients of VJUMP are all negative, implying that higher volatility jump risk increases the current prices of tail risk hedges and thus lowers
their subsequent returns over the next period.
are statistically significant at 99% confidence levels for most of the cases except for the slight SPX puts. The coefficients of VJUMP are all negative, implying that higher volatility jump risk increases the current prices of tail risk hedges and thus lowers
their subsequent returns over the next period.
Regression 3 shows the bivariate regression results with both ![]() and
and ![]() included.
included. ![]() still remains statistically significant except for the medium VIX calls, whereas
still remains statistically significant except for the medium VIX calls, whereas ![]() loses statistical significance for all SPX puts and slight VIX calls. Based on these empirical results, we argue that the forecasting power of the VVIX index largely results from integrated volatility of volatility rather than volatility jumps,
especially for the SPX puts.
loses statistical significance for all SPX puts and slight VIX calls. Based on these empirical results, we argue that the forecasting power of the VVIX index largely results from integrated volatility of volatility rather than volatility jumps,
especially for the SPX puts.
3.9 Robustness to sample periods
This subsection investigates whether the negative relation between the VVIX index and tail risk hedge returns is robust to a larger sample period starting in November 1997, with an alternative measure of the volatility of volatility.11 Because there are no VIX options data prior to February 2006, we are unable to compute the VVIX index for the entire sample period. Instead, as a proxy for volatility of volatility, we use a sample standard
deviation of the log VIX returns,
![]() , with a 21-day rolling window:
, with a 21-day rolling window:
where
Table 8 presents the predictive regression results of the residual SPX put returns onto
![]() , with Newey and West (1987) robust t-statistics with an optimal lag in parentheses. Regression 1 shows that the negative relation
is still valid, regardless of moneyness. The result is statistically significant at a 99% confidence level. Regression 2 shows the full regression results with every explanatory variable included. The coefficients of the VVIX index are still statistically significant at a 99% confidence level,
regardless of moneyness levels. In contrast, according to our analysis, none of the control variables can explain future SPX put returns.
, with Newey and West (1987) robust t-statistics with an optimal lag in parentheses. Regression 1 shows that the negative relation
is still valid, regardless of moneyness. The result is statistically significant at a 99% confidence level. Regression 2 shows the full regression results with every explanatory variable included. The coefficients of the VVIX index are still statistically significant at a 99% confidence level,
regardless of moneyness levels. In contrast, according to our analysis, none of the control variables can explain future SPX put returns.
4 Further applications
This section extends our empirical analysis to three more asset classes in which tail risk may be an important priced factor: (1) the VIX futures, (2) the SPX index, and (3) the SPX calls.
4.1 VIX futures
The VIX futures are another form of tail risk hedging. This subsection examines whether there is a negative relation between the VVIX index and the expected VIX future returns. Table 9 presents the results of long-run predictive regressions of the VIX future returns for 3-, 6-, and 12-month horizons. Price-earning ratios (P/E), price-dividend ratios (P/D), default spreads (DFSP), and term spreads (TMSP) are included as control variables because these variables turned out to be significant in predicting long-run stock index returns. P/E and P/D are downloaded from Shiller's website; DFSP is defined as the difference between Moody's BAA and AAA corporate yields; and TMSP is defined as the difference between 10-year and 3-month Treasury yields. As the regressions involve overlapping data, we apply the robust t-statistics of Hodrick (1992).
Consistent with the expectation, the coefficients of the VVIX index have negative signs for every horizon, but statistical significance varies across horizons. When the control variables are included, the negative coefficient is statistically significant at a 90% confidence level for a 6-month horizon, but not for 3- and 12-month horizons.
Additionally, we look at whether variance risk premiums (VRP), as measured byBollerslev, Tauchen, and Zhou (2009), can forecast subsequent VIX future returns. Interestingly, VRP has statistically significant forecasting power for the VIX future returns for all horizons when the control variables are not included and 3- and 6-month horizons when the control variables are included. Expectedly, the coefficients of VRP take negative signs because a higher level of VRP is associated with a higher VIX future price, resulting in lower subsequent returns on the VIX futures.
4.2 SPX index
The rare disaster literature predicts a positive relation between tail risk and expected stock index returns. This subsection examines whether there is such a positive relation between the VVIX index and the expected SPX index returns. Table 10 presents the results of long-run predictive regressions of the SPX index returns for 3-, 6-, and 12-month horizons. Similar to the preceding subsection, P/E, P/D, DFSP, and TMSP are included as control variables, and the robust t-statistics of Hodrick (1992) are reported in parentheses.
Expectedly, the coefficients of the VVIX index have positive signs for all of the cases but they are not statistically significant when the control variables are included; it may be difficult to obtain statistical significance because our sample period, from May 2006 through January 2011, may be too short to run long-run predictive regressions.
Interestingly, similar to VRP, VVRP is capable of predicting future stock index returns for all horizons even after controlling for every control variable. The coefficients of VVRP are positive, implying that a higher level of the VVRP forecasts higher subsequent SPX index returns over the next period. It would be worthwhile to investigate the economic drivers of the forecasting ability of VVRP for stock index returns.
4.3 SPX calls
The SPX calls are often considered as tail risk taking assets that pay positive payoffs in good states of the world. If this is the case, one would expect a positive relation between tail risk and expected returns on such securities. A high level of tail risk reduces their current prices, resulting in higher subsequent returns over the next period.
Table 11 presents the predictive regression results of the residual SPX call returns. The table shows that the VVIX index has no significant impact on returns on the SPX calls. In fact, it is unclear whether or not the SPX calls are tail risk taking assets because their two underlying factors affect them in opposite directions in times of crisis. For example, volatility tends to increase in periods of crisis, which could drive up SPX call prices. That is, the SPX call prices can either increase or decrease during a crisis depending on the relative changes in the underlying asset price and volatility.
5 Conclusion
This paper examines the pricing of tail risk in the SPX puts and the VIX calls. As a new measure of tail risk, we propose using a model-free, risk-neutral measure of the volatility of volatility implied by the VIX options, which we call the VVIX index. The VVIX index is associated with tail risk because volatility of volatility is a critical determinant of the likelihood of occurrences of extremely low returns. Specifically, a higher level of the volatility of volatility makes the left tail thicker, while making the right tail thinner, resulting in more left-skewed return distributions.
Drawing on the literature on rare disasters, we hypothesize that there is a negative relation between tail risk and expected returns on tail risk hedges. Consistent with this hypothesis, our measure of tail risk, the VVIX index, has a statistically significant and economically large impact on expected returns on both SPX puts and VIX calls. A positive shock to tail risk increases the current prices of tail risk hedges and lowers their subsequent returns over the next three to four weeks. The economic impact is large. A one standard deviation increase in the VVIX index results in a 1.32% to 2.19% decrease in the next day's SPX put returns and a 0.68% to 1.01% decrease in the next day's VIX call returns. These findings add to a large body of literature showing that tail risk has a critical influence on asset returns.
Furthermore, this paper investigates the true source of the predictability of the VVIX index in two ways. First, separating the VVIX index into a physical measure of volatility of volatility and a volatility of volatility risk premium, we find that they both significantly contribute to the forecasting power of the VVIX index. Second, separating the VVIX index into the integrated volatility of volatility and volatility jumps, we find that the predictability largely results from the former rather than the latter.
As a final remark, the jump-based tail risk measures considered in this paper show little ability to forecast tail risk hedge returns unlike the VVIX index. We interpret this result as implying that it is difficult to estimate jump-based tail risk measures with high precision because of often missing deep OTM SPX options, rather than implying that jump risk has no impact on tail risk premiums.
References
Ait-Sahalia, Y., and A. W. Lo (1998): ''Nonparametric estimation of state-price densities implicit in financial asset prices,'' Journal of Finance, 53, 499 547.
Ait-Sahalia, Y., and A. W. Lo (2000): ''Nonparametric risk management and implied risk aversion,'' Journal of Econometrics, 94, 9 51.
Alexander, C., and D. Korovilas (2012): ''Diversification of equity with VIX futures: personal views and skewness preference,'' Working paper, University of Reading.
Amihud, Y. (2002): ''Illiquidity and stock returns: cross-section and time-series effects,'' Journal of Financial Markets, 5(1), 31-56.
Andersen, T., T. Bollerslev, F. Diebold, and H. Ebens (2001): ''The distribution of realized stock return volatility,'' Journal of Financial Economics, 61, 43-76.
Andersen, T., T. Bollerslev, F. Diebold, and P. Labys (2003): ''Modeling and forecasting realized volatility,'' Econometrica , 71, 579-625.
Backus, D., M. Chernov, and I. Martin (2011): ''Disasters implied by equity index options,'' Journal of Finance , 66(6), 1969 2012.
Bakshi, G., N. Kapadia, and D. Madan (2003): ''Stock return characteristics, skew laws, and differential pricing of individual equity options,'' Review of Financial Studies, 16, 101 143.
Baltussen, G., S. Van Bekkum, and B. Van Der Grient (2012): ''Unknown unknowns: Vol-of-vol and the cross section of stock returns,'' Working paper, Erasmus University.
Barndorff-Nielsen, O. E., and N. Shephard (2002): ''Econometric analysis of realized volatility and its use in estimating stochastic volatility models,'' Journal of Royal Statistical Society B, 64, 253-280.
Barndorff-Nielsen, O. E., and N. Shephard (2004): ''Power and bipower variation with stochastic volatility and jumps,'' Journal of Financial Econometrics, 2, 1 37.
Barro, R. (2006): ''Rare disasters and asset markets in the twentieth century,'' The Quarterly Journal of Economics, 121(3), 823 866.
Barro, R., and J. Ursua (2008): ''Consumption disasters in the twentieth cen- tury,'' American Economic Review, 98(2), 58 63.
Bollen, N., and R. Whaley (2004): ''Does net buying pressure affect the shape of implied volatility functions,'' Journal of Finance, 59, 711 753.
Bollerslev, T., G. Tauchen, and H. Zhou (2009): ''Expected stock returns and variance risk premia," Review of Financial Studies, 22(11), 4463 4492.
Bollerslev, T., and V. Todorov (2011): ''Tails, fears, and risk premia," Journal of Finance, 66(6), 2165 2211.
Bondarenko, O. (2003): ''Why are put options so expensive?," Working paper, University of Illinois at Chicago.
Britten-Jones, M., and A. Neuberger (2000): ''Option prices, implied price processes, and stochastic volatility," Journal of Finance, 55, 839-866.
Broadie, M., M. Chernov, and M. Johannes (2009): ''Understanding index option returns,'' Review of Financial Studies, 22(11), 4493 4529.
Burnside, C., M. Eichenbaum, I. Kleshchelski, and S. Rebelo (2011): ''Do peso problems explain the returns to the carry trade?," Review of Financial Studies, 24(3), 853 891.
Carr, P., and L. Wu (2009): \Variance risk premiums," Review of Financial Studies, 22, 1311 1341.
Chen, H., S. Joslin, and S. Ni (2013): ''Demand for crash insurance and stock returns," Working paper, MIT.
Chen, H., S. Joslin, and N. Tran (2012): ''Rare disasters and risk sharing with heterogeneous beliefs," Review of Financial Studies , 25(7), 2189 2224.
Chollete, L., and C. Lu (2012): ''The price of tail risk in liquidity and returns," Working paper, University of Stavanger.
Christoffersen, P., R. Goyenko, K. Jacobs, and M. Karoui (2012): ''Illiquidity premia in the equity options market,'' Working paper, University of Toronto.
Christoffersen, P., S. Heston, and K. Jacobs (2009): ''The shape and term structure of the index option smirk: why multifactor stochastic volatility models work so well," Management Science, 55, 1914 1932.
Collin-Dufresne, P., R. Goldstein, and F. Yang (2010): ''On the relative pricing of long maturity S&P 500 index options and CDX tranches," Working paper, National Bureau of Economic Research.
Constantinides, G., J. Jackwerth, and S. Perrakis (2009): ''Mispricing of S&P 500 index options," Review of Financial Studies, 22(3), 1247 1277.
Demeterfi, K., E. Derman, M. Kamal, and J. Zou (1999): ''More than you ever wanted to know about volatility swaps," Goldman sachs quantitative strategies research notes, Goldman Sachs.
Du, J., and N. Kapadia (2012): ''Tail and volatility indices from option prices," Working paper, University of Massachusetts, Amherst.
Engle, R., and S. Figlewski (2012): ''Modeling the dynamics of correlations among implied volatilities," Working paper, New York University.''
Frazzini, A., and L. Pedersen (2011): ''Embedded leverage," Working paper, AQR and New York University.
French, K., W. Schwert, and R. Stambaugh (1987): ''Expected stock returns and volatility," Journal of Financial Economics, 19, 3 29.
Gabaix, X. (2008): ''Variable rare disasters: A tractable theory of ten puzzles in macro-finance," American Economic Review, 98(2), 64 67.
Gabaix, X. (2012): ''Variable rare disasters: An exactly solved framework for ten puzzles in macro-finance,'' The Quarterly Journal of Economics, 127(2), 645700.
G^arleanu, N., L. Pedersen, and A. Poteshman (2009): ''Demand-based option pricing," Review of Financial Studies , 22(10), 4259 4299.
Gourio, F. (2008): ''Disasters and recoveries," American Economic Review, 98(2), 68 73.
Hasbrouck, J. (2003): ''Intraday price formation in U.S. equity index markets," Journal of Finance , 58(6), 2375 2400.
Hill, B. (1975): ''A simple general approach to inference about the tail of a distribution," The annals of statistics, pp. 1163 1174.
Hodrick, R. (1992): "Dividend yields and expected stock returns: Alternative procedures for inference and measurement,"Review of Financial studies, 5(3), 357 386.
Jiang, G., and Y. Tian (2005): "The model-free implied volatility and its information content," Review of Financial Studies, 18, 1305 1342.
Jiang, G., and Y. Tian (2007): "Extracting model-free volatility from option prices: An examination of the VIX index," Journal of Derivatives, 14, 35 60.
Jurek, J. (2009): "Crash-neutral currency carry trades," Working paper, Princeton University.
Kelly, B. (2011): "Tail risk and asset prices," Working paper, University of Chicago.
Kelly, B., and J. Hao (2012): "Tail risk and hedge fund returns," Working paper, University of Chicago.
Liu, J., J. Pan, and T. Wang (2005): "An equilibrium model of rare-event premia and its implication for option smirks," Review of Financial Studies, 18(1), 131 164.
Newey, W. K., and K. D. West (1987): "A simple positive semi-definite, het- eroskedasticity and autocorrelation consistent covariance matrix," Econometrica ,55, 703 708.
Pastor, L., and R. Stambaugh (2003): "Liquidity risk and expected stock re- turns," Journal of Political Economy, 111(3), 642 685.
Rietz, T. (1988): "The equity risk premium: A solution," Journal of monetary Economics, 22(1), 117 131.
Wachter, J. (2011): ''Can time-varying risk of rare disasters explain aggregate stock market volatility?," Working paper, University of Pennsylvania.
A. Futures and options data
The high-frequency SPX futures data are used to compute delta-hedged SPX option returns and high-frequency-based jump variations. In particular, we use small-denomination (E-mini) SPX future prices because Hasbrouck (2003) finds that price information is discovered in the E-mini market as opposed to the regular market or exchange-traded funds. The E-mini SPX futures data come from Thomson Reuters Tick History. Although the E-mini futures trade overnight in the electronic Globex venue, we include the five-minute interval returns for 8:30 a.m. to 3:15 p.m. only when the CBOE option market is open.
We make use of the front-month VIX futures returns when computing RVV, and match the maturities of the VIX futures to those of the VIX options when constructing delta-hedged VIX options. The high-frequency VIX futures data for 8:30 a.m. to 3:15 p.m. are obtained from Thomson Reuters Tick History.
The options data come from OptionMetrics. Option prices are taken from the bid-ask midpoint on each day's close of the option market. With respect to the SPX options, the CBOE option market closes 15 minutes later than the SPX spot market. To address the issue of nonsynchronous trading hours, we back out the spot price for each of the first three pairs of near-the-money SPX put and call options by using the put-call parity (see, for example, Ait-Sahalia and Lo (1998) and Ait-Sahalia and Lo (2000)) and take the average of the three extracted prices. Then, we eliminate options violating the usual lower bound constraints:
 |
where
In addition, when running our regression analysis, we apply a rather tight filtering scheme for inaccurate or illiquid options. Specifically, we delete the SPX options for which the mid price is less than 0.5, the implied volatility is lower than 5% or higher than 100%, or the relative bid-ask
spread is larger than 0.5, where the relative bid-ask spread is defined as
![]() . We also delete the VIX options for which the mid price is less than 0.2, the implied volatility is lower than 10% or higher than
150%, or the relative bid-ask spread is larger than 0.5.
. We also delete the VIX options for which the mid price is less than 0.2, the implied volatility is lower than 10% or higher than
150%, or the relative bid-ask spread is larger than 0.5.
B. Computation of alternative tail risk measures
This appendix details the procedures for computing ![]() and
and ![]() .
.
High-frequency jump variation
Our regression analyses use a monthly measure of jump variation. To compute this variable, we first obtain daily realized volatility by summing the squared intraday returns over each day, following Andersen, Bollerslev, Diebold, and Ebens (2001); Andersen, Bollerslev, Diebold, and Labys (2003); and Barndorff-Nielsen and Shephard (2002) :
 |
where
Next, we compute the daily bipower variation by using the approach of Barndorff-Nielsen and Shephard (2004):
 |
The daily jump variation is then defined by subtracting the daily bipower variation from the daily realized volatility, with a floor of zero,
![]() Finally, monthly jump variation is obtained by summing daily jump variations over the past 21 trading days:
Finally, monthly jump variation is obtained by summing daily jump variations over the past 21 trading days:
![]()
B.2 TAIL index
Following the approach of Kelly (2011) and Chollete and Lu (2012), stock returns exceeding a threshold level ![]() are assumed to have the following tail distribution:
are assumed to have the following tail distribution:
 |
where
Let
![]() be the sample order statistics of the stock returns over the past one month where
be the sample order statistics of the stock returns over the past one month where ![]() indicates the number of stock returns at time
indicates the number of stock returns at time ![]() .
. ![]() can be estimated by applying the Hill (1975) estimator to the order statistics on each date. The Hill (1975) estimator takes the form of
can be estimated by applying the Hill (1975) estimator to the order statistics on each date. The Hill (1975) estimator takes the form of
 |
where
As a higher level of
![]() is associated with a higher level of tail risk, Kelly (2011) introduces the following standardized index, which is increasing in tail risk, via a
sign change:
is associated with a higher level of tail risk, Kelly (2011) introduces the following standardized index, which is increasing in tail risk, via a
sign change:
 |
where "mean" and "std" refer to the mean and the standard deviation, respectively.
The returns data are obtained from the CRSP daily stock files, with share codes of 10 and 11 and exchange codes of 1, 2, and 3.
| Δ VVIX | 1.00 | -0.45*** | -0.62*** | -0.12 |
| Δ SPX | 1.00*** | -0.77*** | 0.24* | |
| ΔVIX | 1.00 | -0.19 | ||
| Δ LIQUID | 1.00 |
| VIX | TED | ||||||||||
| Panel A Summary statistics: Mean | 0.835 | 0.360 | 0.358 | 0.871 | 0.063 | 0.242 | 0.003 | 0.006 | -0.020 | -0.000 | 0.681 |
| Panel A Summary statistics: Median | 0.809 | 0.280 | 0.357 | 0.849 | 0.061 | 0.217 | 0.002 | 0.002 | -0.011 | 0.107 | 0.451 |
| Panel A Summary statistics: Min. | .390 | 0.106 | -0.337 | 0.447 | -0.110 | 0.099 | 0.000 | 0.000 | -0.127 | -3.470 | 0.088 |
| Panel A Summary statistics: Max. | 1.530 | 1.408 | 1.502 | 1.510 | 0.222 | 0.809 | 0.032 | 0.068 | -0.002 | 1.776 | 4.597 |
| Panel A Summary statistics:Std. | 0.147 | 0.237 | 0.185 | 0.148 | 0.035 | 0.113 | 0.004 | 0.010 | 0.028 | 1.000 | 0.645 |
| Panel A Summary statistics:Skew. | 1.012 | 2.167 | 0.294 | 0.886 | 0.204 | 1.750 | 4.055 | 3.859 | -2.682 | -0.999 | 2.178 |
| Panel A Summary statistics: Kurt. | 4.909 | 8.090 | 6.228 | 4.399 | 4.334 | 6.906 | 22.403 | 19.507 | 9.253 | 4.090 | 9.441 |
| Panel A Summary statistics:AR(1) | 0.924 | 0.993 | 0.834 | 0.929 | 0.893 | 0.979 | 0.991 | 0.999 | 0.995 | 0.981 | 0.992 |
| Panel A Summary statistics:AR(2) | 0.759 | 0.917 | 0.491 | 0.768 | 0.773 | 0.934 | 0.951 | 0.980 | 0.964 | 0.900 | 0.954 |
| Panel B: Correlation matrix:VVIX | 1.00 | 0.72 | 0.52 | 0.99 | 0.23 | 0.54 | 0.40 | 0.37 | -0.51 | -0.61 | 0.31 |
| Panel B: Correlation matrix:RVV | 1.00 | -0.20 | 0.69 | 0.00 | 0.64 | 0.60 | 0.56 | -0.77 | -0.69 | 0.49 | |
| Panel B: Correlation matrix:VVRP | 1.00 | 0.54 | 0.28 | -0.02 | -0.14 | -0.16 | 0.16 | 0.02 | -0.14 | ||
| Panel B: Correlation matrix: IVV | 1.00 | 0.35 | 0.48 | 0.34 | 0.33 | -0.46 | -0.58 | 0.23 | |||
| Panel B: Correlation matrix: VJUMP | 1.00 | -0.34 | -0.41 | -0.27 | 0.43 | -0.03 | -0.56 | ||||
| Panel B: Correlation matrix: VIX | 1.00 | 0.83 | 0.84 | -0.93 | -0.66 | 0.54 | |||||
| Panel B: Correlation matrix:JV | 1.00 | 0.82 | -0.88 | -0.46 | 0.64 | ||||||
| Panel B: Correlation matrix:JTIX | 1.00 | -0.96 | -0.50 | 0.44 | |||||||
| Panel B: Correlation matrix:FI | 1.00 | 0.72 | -0.67 | ||||||||
| Panel B: Correlation matrix:TAIL | 1.00 | -0.24 | |||||||||
| Panel B: Correlation matrix:TED | 1.00 |
| Mean | p-val | Min. | Max. | Std. | Skew. | Kurt. | AR(1) | Sharpe | |
| Panel A: SPX puts: deep SPX put | 5.38 | (0.00) | -77.05 | 191.62 | 13.22 | 2.36 | 41.94 | -0.13 | -0.41 |
| Panel A: SPX puts:med. SPX put | 5.47 | (0.00) | -80.77 | 235.82 | 14.66 | 4.76 | 80.92 | -0.10 | -0.37 |
| Panel A: SPX puts: slight SPX put | 3.34 | (0.00) | -54.53 | 132.86 | 9.45 | 2.33 | 38.25 | -0.17 | -0.35 |
| Panel B VIX calls: slight VIX call | 2.44 | (0.00) | -61.00 | 80.04 | 6.10 | 1.17 | 37.57 | -0.15 | -0.40 |
| Panel B VIX calls: med. VIX call | -2.40 | (0.00) | -35.41 | 33.88 | 6.18 | 0.31 | 7.87 | -0.09 | -0.39 |
| Panel B VIX calls: deep VIX call | -2.27 | (0.00) | -36.34 | 58.84 | 7.69 | 0.83 | 11.00 | -0.08 | -0.30 |
| moneyness | const | R~Olag | VVIX | VIX | JV | JTIX | FI | Tail | TED | R2 |
| Regression 1: Baseline regression: deep SPX put | 5.15** | -2.01*** | -2.03*** | 0.47 | 3.77 | |||||
| Regression 1: Baseline regression: deep SPX put: robust t-statistics | (2.45) | (-5.24) | (-5.54) | (0.83) | ||||||
| Regression 1: Baseline regression:med. SPX put | 6.05** | -1.79*** | -2.19*** | 0.47 | 2.93 | |||||
| Regression 1: Baseline regression:med. SPX put:Robust t-statistics | (2.19) | (-6.03) | (-4.48) | (0.98) | ||||||
| Regression 1: Baseline regression:slight SPX put | 3.28** | -1.79*** | -1.32*** | 0.43 | 4.67 | |||||
| Regression 1: Baseline regression: Baseline regression:slight SPX put: Robust t-statistics | (2.03) | (-7.08) | (-4.72) | (1.53) | ||||||
| Regression 1: Baseline regression:slight VIX call | 1.24 | -1.00*** | -0.69*** | 0.21 | 3.40 | |||||
| Regression 1: Baseline regression:slight VIX call: Robust t-statistics | (1.07) | (-4.17) | (-3.72) | (1.17) | ||||||
| Regression 1: Baseline regression:med. VIX call | 1.12 | -0.61*** | -0.68*** | 0.42** | 2.0 | |||||
| Regression 1: Baseline regression:med. VIX call: Robust t-statistics | (0.91) | (-2.99) | (-3.55) | (2.07) | ||||||
| Regression 1: Baseline regression: deep VIX call | 2.88** | -0.72** | -1.01*** | 0.66* | 2.41 | |||||
| Regression 1:Baseline regression: deep VIX call: Robust t-statistics | (-2.40) | (-4.44) | (1.94) | |||||||
| Regression 2 : Controlling for VIX deep SPX put | 5.08** | -2.01*** | -1.99*** | -0.12 | 0.52 | 3.71 | ||||
| Regression 2 : Controlling for VIX deep SPX put: Robust t-statistics | (2.42) | (-5.27) | (-5.10) | (-0.34) | (0.86) | |||||
| Regression 2 : Controlling for VIX med. SPX put | 6.24** | -1.79*** | -2.32*** | 0.31 | 0.34 | 2.89 | ||||
| Regression 2 : Controlling for VIX med. SPX put: Robust t-statistics | (2.26) | (-6.03) | (-4.52) | (0.86) | (0.73) | |||||
| Regression 2 : Controlling for VIX:slight SPX put | 3.21** | -1.80*** | -1.27*** | -0.11 | 0.47 | 4.61 | ||||
| Regression 2 : Controlling for VIX:slight SPX put:Robust t-statistics | (1.98) | (-7.08) | (-4.29) | (-0.45) | (1.60) | |||||
| Regression 2 : Controlling for VIX: slight VIX call | 1.28 | -1.00*** | -0.74*** | 0.13 | 0.16 | 3.36 | ||||
| Regression 2 : Controlling for VIX: slight VIX call:Robust t-statistics | (1.09) | (-4.17) | (-3.52) | (0.66) | (0.84) | |||||
| Regression 2 : Controlling for VIX: med. VIX call | 1.13 | -0.61*** | -0.69*** | 0.02 | 0.41* | 1.97 | ||||
| Regression 2 : Controlling for VIX: med. VIX call: Robust t-statistics | (0.91) | (-2.99) | (-3.35) | (0.10) | (1.93) | |||||
| Regression 2 : Controlling for VIX:deep VIX call | 2.92** | -0.71** | -1.03*** | 0.06 | 0.63* | 2.34 | ||||
| Regression 2 : Controlling for VIX:deep VIX call: Robust t-statistics | (2.12) | (-2.40) | (-4.39) | (0.20) | (1.77) | |||||
| Regression 3: Controlling for JV: deep SPX put | 5.09** | -2.01*** | -2.02*** | -0.05 | 0.50 | 3.70 | ||||
| Regression 3: Controlling for JV: deep SPX put:Robust t-statistics | (2.38) | (-5.27) | (-5.41) | (-0.14) | (0.76) | |||||
| Regression 3: Controlling for JV: med. SPX put | 6.00** | -1.79*** | -2.18*** | -0.04 | 0.49 | 2.86 | ||||
| Regression 3: Controlling for JV: med. SPX put: Robust t-statistics | (2.20) | (-6.03) | (-4.48) | (-0.09) | (0.92) | |||||
| Regression 3: Controlling for JV: slight SPX put | 3.18* | -1.79*** | -1.30*** | -0.09 | 0.48 | 4.61 | ||||
| Regression 3: Controlling for JV:slight SPX put Robust t-statistics | (1.90) | (-7.07) | (-4.50) | (-0.37) | (1.42) | |||||
| Regression 3: Controlling for JV: slight VIX call | 1.11 | -1.00*** | -0.66*** | -0.16 | 0.28 | 3.38 | ||||
| Regression 3: Controlling for JV: slight VIX call:Robust t-statistics | (1.00) | (-4.21) | (-3.65) | (-0.53) | (1.25) | |||||
| Regression 3: Controlling for JV: med. VIX call | 1.12 | -0.61*** | -0.68*** | 0.00 | 0.42** | 1.97 | ||||
| Regression 3: Controlling for JV: med. VIX call: Robust t-statistics | (0.98) | (-2.98) | (-3.78) | (0.01) | (2.06) | |||||
| Regression 3: Controlling for JV: deep VIX call | 3.13** | -0.72** | -1.06*** | 0.23 | 0.54 | 2.39 | ||||
| Regression 3: Controlling for JV: deep VIX call: Robust t-statistics | (2.46) | (-2.41) | (-5.03) | (0.60) | (1.53) | |||||
| Regression 4: Controlling for JTIX: deep SPX put | 4.73** | -2.02*** | -1.96*** | -0.29 | 0.58 | 3.74 | ||||
| Regression 4: Controlling for JTIX: med. SPX put | 6.10** | -1.79*** | -2.20*** | 0.03 | 0.45 | 2.86 | ||||
| Regression 4: Controlling for JTIX: med. SPX put: Robust t-statistics | (2.15) | (-6.03) | (-4.37) | (0.09) | (0.86) | |||||
| Regression 4: Controlling for JTIX: slight SPX put | 3.13* | -1.79*** | -1.29*** | -0.10 | 0.47 | 4.61 | ||||
| Regression 4: Controlling for JTIX: slight SPX put: Robust t-statistics | (1.79) | (-7.07) | (-4.28) | (-0.39) | (1.43) | |||||
| Regression 4: Controlling for JTIX: slight VIX call | 1.36 | -1.00*** | -0.71*** | 0.08 | 0.18 | 3.34 | ||||
| Regression 4: Controlling for JTIX: slight VIX call: Robust t-statistics | (1.10) | (-4.16) | (-3.51) | (0.37) | (0.90) | |||||
| Regression 4: Controlling for JTIX: med. VIX call | 1.08 | -0.61*** | -0.68*** | -0.03 | 0.43** | 1.97 | ||||
| Regression 4: Controlling for JTIX: med. VIX call: Robust t-statistics | (0.88) | (-2.99) | (-3.52) | (-0.13) | (2.05) | |||||
| Regression 4: Controlling for JTIX: deep VIX call | 2.86** | -0.72** | -1.01*** | -0.01 | 0.66* | 2.33 | ||||
| Regression 4: Controlling for JTIX: deep VIX call: Robust t-statistics | (2.20) | (-2.40) | (-4.73) | (-0.03) | (1.78) | |||||
| Regression 5: Controlling for FI deep SPX put | 2.23 | -1.55*** | -1.77*** | 0.48 | 0.33 | 1.96 | ||||
| Regression 5: Controlling for FI deep SPX put: Robust t-statistics | (0.85) | (-3.10) | (-3.78) | (0.62) | (0.27) | |||||
| Regression 5: Controlling for FI: med. SPX put | 6.08* | -1.57*** | -2.73*** | 0.32 | 0.74 | 2.18 | ||||
| Regression 5: Controlling for FI: med. SPX put: Robust t-statistics | (1.68) | (-2.98) | (-3.74) | (0.53) | (0.81) | |||||
| Regression 5: Controlling for FI: slight SPX put | 2.99 | -1.47*** | -1.47*** | 0.16 | 0.43 | 2.91 | ||||
| Regression 5: Controlling for FI: slight SPX put: Robust t-statistics | (1.42) | (-3.56) | (-3.53) | (0.34) | (0.66) | |||||
| Regression 5: Controlling for FI: slight VIX call | 1.04 | -0.93** | -0.82** | 0.25 | 0.25 | 2.30 | ||||
| Regression 5: Controlling for FI: slight VIX call: Robust t-statistics | (0.58) | (-2.51) | (-2.43) | (0.52) | (0.65) | |||||
| Regression 5: Controlling for FI: med. VIX call | -0.58 | -0.06 | -0.46 | 0.22 | 0.50 | 0.04 | ||||
| Regression 5: Controlling for FI: med. VIX call: Robust t-statistics | (-0.36) | (-0.20) | (-1.59) | (0.52) | (1.14) | |||||
| Regression 5: Controlling for FI: deep VIX call | 2.09 | -0.04 | -1.16*** | 0.12 | 0.94 | 1.09 | ||||
| Regression 5: Controlling for FI: deep VIX call: Robust t-statistics | (1.11) | (-0.10) | (-2.94) | (0.17) | (1.35) | |||||
| Regression 6: Controlling for TAIL deep SPX put | 6.11** | -2.01*** | -2.20*** | -0.28 | 0.45 | 3.73 | ||||
| Regression 6: Controlling for TAIL deep SPX put:Robust t-statistics | (2.36) | (-5.23) | (-4.80) | (-0.83) | (0.80) | |||||
| Regression 6: Controlling for TAIL med. SPX put | 8.00** | -1.80*** | -2.52*** | -0.57 | 0.43 | 2.96 | ||||
| Regression 6: Controlling for TAIL med. SPX put: Robust t-statistics | (2.44) | (-6.07) | (-4.35) | (-1.51) | (0.91) | |||||
| Regression 6: Controlling for TAIL slight SPX put | 4.86** | -1.80*** | -1.58*** | -0.46* | 0.39 | 4.76 | ||||
| Regression 6: Controlling for TAIL slight SPX put: Robust t-statistics | (2.43) | (-7.12) | (-4.62) | (-1.83) | (1.42) | |||||
| Regression 6: Controlling for TAIL slight VIX call | 1.41 | -1.00*** | -0.72*** | -0.05 | 0.21 | 3.33 | ||||
| Regression 6: Controlling for TAIL slight VIX call: Robust t-statistics | (0.95) | (-4.17) | (-3.03) | (-0.29) | (1.13) | |||||
| Regression 6: Controlling for TAIL med. VIX call | 0.99 | -0.61*** | -0.66*** | 0.04 | 0.42** | 1.97 | ||||
| Regression 6: Controlling for TAIL med. VIX call: Robust t-statistics | (0.66) | (-3.00) | (-2.84) | (0.18) | (2.06) | |||||
| Regression 6: Controlling for TAIL deep VIX call | 3.05* | -0.71** | -1.04*** | -0.05 | 0.65* | 2.34 | ||||
| Regression 6: Controlling for TAIL deep VIX call: Robust t-statistics | (1.78) | (-2.40) | (-3.75) | (-0.19) | (1.91) |
| moneyness | const | R~Olag | Adj. |
|||
| Regression 1: One-week ahead deep SPX put | 2.35 | -1.96*** | -1.50*** | 1.09 | -1.05 | 2.96 |
| Regression 1: One-week ahead deep SPX put: robust t-statistics<.td> | (1.09) | (-5.29) | (-4.22) | (1.24) | (-1.40) | |
| Regression 1: One-week ahead med. SPX put | 2.03 | -1.64*** | -1.43*** | 0.37 | -0.19 | |
| Regression 1: One-week ahead med. SPX put: robust t-statistics | (0.77) | (-4.95) | (-3.21) | (0.43) | (-0.24) | |
| Regression 1: One-week ahead slight SPX put | -0.36 | -1.69*** | -0.62** | 0.44 | -0.47 | 3.25 |
| Regression 1: One-week ahead slight SPX put: robust t-statistics | (-0.24) | (-6.21) | (-2.45) | (0.94) | (-1.12) | |
| Regression 1: One-week ahead slight VIX call | 1.37 | -0.70*** | 0.21 | 0.09 | 2.77 | |
| Regression 1: One-week ahead slight VIX call: robust t-statistics | (0.96) | (-4.11) | (-3.00) | (0.29) | ||
| Regression 1: One-week ahead med. VIX call | 1.22 | -0.70*** | -0.66*** | 0.52 | -0.37 | 2.08 |
| Regression 1: One-week ahead med. VIX call: robust t-statistics | (0.96) | (-3.63) | (-3.29) | (1.03) | (-0.82) | |
| Regression 1: One-week ahead deep VIX call | 2.65 | -0.72** | -0.89*** | 0.35 | -0.03 | 1.56 |
| Regression 1: One-week ahead deep VIX call: robust t-statistics | (1.58) | (-2.32) | (-3.26) | (0.43) | (-0.05) | |
| Regression 2: Two-week ahead deep SPX put | 0.77 | -1.87*** | -1.19*** | 0.40 | -0.50 | 2.38 |
| Regression 2: Two-week ahead deep SPX put: robust t-statistics | (0.43) | (-4.92) | (-4.14) | (0.69) | (-0.97) | |
| Regression 2: Two-week ahead med. SPX put | 0.89 | -1.58*** | -1.22*** | 0.21 | -0.03 | 1.40 |
| Regression 2: Two-week ahead med. SPX put: robust t-statistics | (0.39) | (-4.70) | (-3.23) | (0.26) | (-0.04) | |
| Regression 2: Two-week ahead slight SPX put | -1.32 | -1.66*** | -0.44* | 0.15 | -0.25 | 3.00 |
| Regression 2: Two-week ahead slight SPX put: robust t-statistics | (-0.99) | (-5.96) | (-1.96) | (0.41) | (-0.72) | |
| Regression 2: Two-week ahead slight VIX call | -1.60 | -0.82*** | -0.22 | 0.28 | -0.01 | 1.76 |
| Regression 2: Two-week ahead slight VIX call: robust t-statistics | (-1.62) | (-4.10) | (-1.36) | (0.93) | (-0.05) | |
| Regression 2: Two-week ahead med. VIX call | 0.06 | -0.69*** | -0.48*** | 0.34 | 0.02 | 1.60 |
| Regression 2: Two-week ahead med. VIX call: robust t-statistics | (0.05) | (-3.62) | (-2.72) | (1.13) | (0.05) | |
| Regression 2: Two-week ahead deep VIX call | 2.28 | -0.69** | -0.81*** | -0.03 | 0.31 | 1.32 |
| Regression 2: Two-week ahead deep VIX call: robust t-statistics | (1.48) | (-2.29) | (-3.33) | (-0.04) | (0.51) | |
| Regression 3: Three-week ahead deep SPX put | 0.65 | -1.87*** | -1.18*** | 0.38 | -0.46 | 2.39 |
| Regression 3: Three-week ahead deep SPX put | (0.29) | (-4.98) | (-3.31) | (0.68) | (-0.84) | |
| Regression 3: Three-week ahead med. SPX put | 0.01 | -1.57*** | -1.08*** | 0.27 | -0.09 | 1.26 |
| Regression 3: Three-week ahead med. SPX put: robust t-statistics | (0.00) | (-4.55) | (-2.59) | (0.45) | (-0.15) | |
| Regression 3: Three-week ahead slight SPX put | -0.90 | -1.67*** | -0.53** | 0.46 | -0.48 | 3.13 |
| Regression 3: Three-week ahead slight SPX put: robust t-statistics | (-0.60) | (-5.99) | (-2.19) | (1.56) | (-1.59) | |
| Regression 3: Three-week ahead slight VIX call | -1.25 | -0.83*** | -0.27* | 0.10 | 0.12 | 1.77 |
| Regression 3: Three-week ahead slight VIX call | (-1.34) | (-4.09) | (-1.77) | (0.41) | (0.41) | |
| Regression 3: Three-week ahead med. VIX call | -0.06 | -0.71*** | -0.45** | 0.33 | -0.02 | 1.58 |
| Regression 3: Three-week ahead med. VIX call: robust t-statistics | (-0.05) | (-3.72) | (-2.54) | (1.05) | (-0.06) | |
| Regression 3: Three-week ahead deep VIX call | 1.76 | -0.68** | -0.76*** | 0.28 | 0.29 | 1.35 |
| Regression 3: Three-week ahead deep VIX call | (1.12) | (-2.26) | (-2.98) | (0.39) | (0.41) | |
| Regression 4: Four-week ahead deep SPX put | -3.19* | -1.82*** | -0.47 | 0.02 | -0.37 | 1.82 |
| Regression 4: Four-week ahead deep SPX put | (-1.71) | (-4.71) | (-1.57) | (0.05) | (-0.80) | |
| Regression 4: Four-week ahead med. SPX put | -4.38** | -1.52*** | -0.28 | 0.22 | -0.31 | 0.84 |
| Regression 4: Four-week ahead med. SPX put | (-1.99) | (-4.42) | (-0.77) | (0.51) | (-0.74) | |
| Regression 4: Four-week ahead slight SPX put | -2.93** | -1.65*** | -0.16 | 0.14 | -0.30 | 2.82 |
| Regression 4: Four-week ahead slight SPX put | (-2.20) | (-5.85) | (-0.73) | (0.51) | (-0.97) | |
| Regression 4: Four-week ahead slight VIX call | -1.43 | -0.83*** | -0.24 | 0.12 | 0.11 | 1.75 |
| Regression 4: Four-week ahead slight VIX call | (-1.52) | (-4.15) | (-1.56) | (0.39) | (0.28) | |
| Regression 4: Four-week ahead med. VIX call | -0.52 | -0.69*** | -0.38** | 0.14 | 0.23 | 1.45 |
| Regression 4: Four-week ahead med. VIX call | (-0.56) | (-3.63) | (-2.50) | (0.42) | (0.67) | |
| Regression 4: Four-week ahead deep VIX call | 0.50 | -0.68** | -0.55*** | 0.61 | -0.09 | 1.06 |
| Regression 4: Four-week ahead deep VIX call | (0.40) | (-2.20) | (-2.71) | (1.16) | (-0.17) |
| moneyness | const | R~Olag | Adj. |
||||||
| Regression 1: RVV only deep SPX put | -4.04*** | -1.89*** | -1.37*** | 2.70 | |||||
| Regression 1: RVV only deep SPX put: robust t-statistics | (-6.79) | (-4.81) | (-4.56) | ||||||
| Regression 1: RVV only med. SPX put | -3.93*** | -1.65*** | -1.41*** | 1.85 | |||||
| Regression 1: RVV only med. SPX put: robust t-statistics /td> | (-5.63) | (-5.03) | (-3.69) | ||||||
| Regression 1: RVV only slight SPX put | -2.92*** | -1.69*** | -0.66*** | 3.37 | |||||
| Regression 1: RVV only slight SPX put: robust t-statistics | (-7.23) | (-6.26) | (-3.23) | ||||||
| Regression 1: RVV only slight VIX call | -1.97*** | -0.98*** | -0.53*** | 2.97 | |||||
| Regression 1: RVV only slight VIX call: robust t-statistics | (-7.06) | (-4.12) | (-3.28) | ||||||
| Regression 1: RVV only med. VIX call | -1.73*** | -0.60*** | -0.58** | 1.56 | |||||
| Regression 1: RVV only med. VIX call: robust t-statistics | (-4.45) | (-3.00) | (-2.49) | ||||||
| Regression 1: RVV only deep VIX call | -1.47*** | -0.66** | -0.63** | 1.16 | |||||
| Regression 1: RVV only deep VIX call: robust t-statistics | (-3.16) | (-2.12) | (-2.01) | ||||||
| Regression 2: VVRP only deep SPX put | -4.09*** | -1.82*** | -1.04*** | 2.25 | |||||
| Regression 2: VVRP only deep SPX put:robust t-statistics | (-4.70) | (-4.75) | (-2.70) | ||||||
| Regression 2: VVRP only med. SPX put | -3.60*** | -1.60*** | -1.26*** | 1.66 | |||||
| Regression 2: VVRP only med. SPX put: robust t-statistics | (-3.63) | (-5.13) | (-2.79) | ||||||
| Regression 2: VVRP only slight SPX put | -2.07*** | -1.72*** | -0.96*** | 3.89 | |||||
| Regression 2: VVRP only slight SPX put: robust t-statistics | (-3.35) | (-6.63) | (-3.32) | ||||||
| Regression 2: VVRP only slight VIX call | -2.31*** | -0.95*** | -0.25 | 2.38 | |||||
| Regression 2: VVRP only slight VIX call:robust t-statistics | (-6.04) | (-4.06) | (-1.27) | ||||||
| Regression 2: VVRP only med. VIX call | -2.42*** | -0.55*** | -0.10 | 0.69 | |||||
| Regression 2: VVRP only med. VIX call | (-5.60) | (-2.63) | (-0.56) | ||||||
| Regression 2: VVRP only deep VIX call | -1.63*** | -0.62** | -0.41 | 0.78 | |||||
| Regression 2: VVRP only deep VIX call: robust t-statistics | (-2.67) | (-2.03) | (-1.60) | ||||||
| Regression 3: RVV and VVRP deep SPX put | -0.69 | -2.01*** | -1.72*** | -1.45*** | 3.77 | ||||
| Regression 3: RVV and VVRP deep SPX put:robust t-statistics | (-0.62) | (-5.08) | (-5.35) | (-3.97) | |||||
| Regression 3: RVV and VVRP med. SPX put | -0.05 | -1.81*** | -1.82*** | -1.69*** | 3.03 | ||||
| Regression 3: RVV and VVRP med. SPX put | (-0.04) | (-6.06) | (-4.52) | (-3.69) | |||||
| Regression 3: RVV and VVRP slight SPX put | -0.15 | -1.80*** | -0.96*** | -1.19*** | 4.79 | ||||
| Regression 3: RVV and VVRP sslight SPX put: robust t-statistics | (-0.17) | (-7.29) | (-4.22) | (-4.12) | |||||
| Regression 3: RVV and VVRP slight VIX call | -0.83 | -1.01*** | -0.67*** | -0.45** | 3.40 | ||||
| Regression 3: RVV and VVRP slight VIX call | (-1.51) | (-4.10) | (-3.61) | (-2.22) | |||||
| Regression 3: RVV and VVRP med. VIX call | -0.94 | -0.61*** | -0.68*** | -0.31* | 1.73 | ||||
| Regression 3: RVV and VVRP med. VIX call:robust t-statistics | (-1.51) | (-3.05) | (-2.71) | (-1.75) | |||||
| Regression 3: RVV and VVRP deep VIX call | 0.09 | -0.68** | -0.82** | -0.64*** | 1.74 | ||||
| Regression 3: RVV and VVRP deep VIX call: robust t-statistics | (0.13) | (-2.19) | (-2.51) | (-2.92) |
| moneyness | const | R~Olag | Adj. |
||
| Regression 1: IVV only deep SPX put | 5.87*** | -2.02*** | -2.00*** | 3.90 | |
| Regression 1: IVV only deep SPX put: robust t-statistics | (2.70) | (-5.17) | (-5.65) | ||
| Regression 1: IVV only med. SPX put | 6.82** | -1.80*** | -2.16*** | 3.07 | |
| Regression 1: IVV only med SPX put: robust t-statistics | (2.38) | (-5.95) | (-4.65) | ||
| Regression 1: IVV only slight SPX put | 3.70** | -1.79*** | -1.27*** | 4.66 | |
| Regression 1: IVV only slight SPX put: robust standard errors | (2.21) | (-7.07) | |||
| Regression 1: IVV only slight VIX call | 1.59 | -1.00*** | -0.69*** | 3.49 | |
| Regression 1: IVV only slight VIX call: robust standard errors | (1.44) | (-4.14) | (-3.73) | ||
| Regression 1: IVV only med. VIX call | 1.61 | -0.60*** | -0.67*** | 1.85 | |
| Regression 1: IVV only med. VIX call:robust t-statistics | (1.23) | (-2.99) | (-3.25) | ||
| Regression 1: IVV only deep VIX call | 3.38** | -0.69** | -0.94*** | 1.99 | |
| Regression 1: IVV only deep VIX call: robust t-statistcs | (2.30) | (-2.23) | (-3.89) | ||
| Regression 2: VJUMP only deep SPX put | -3.74*** | -1.88*** | -1.33*** | 2.64 | |
| Regression 2: VJUMP only deep SPX put: robust t-statistics | (-3.68) | (-4.87) | (-3.01) | ||
| Regression 2: VJUMP only med. SPX put | -3.57*** | -1.63*** | -1.37*** | 1.80 | |
| Regression 2: VJUMP only med. SPX put: robust t-statistics | (-3.18) | (-4.93) | (-2.75) | ||
| Regression 2: VJUMP only slight SPX put | -2.53*** | -1.70*** | -0.77** | 3.54 | |
| Regression 2: VJUMP only slight SPX put: robust t-statistics | (-3.66) | (-6.14) | (-2.36) | ||
| Regression 2: VJUMP only slight VIX call | -1.67*** | -1.00*** | -0.59*** | 3.15 | |
| Regression 2: VJUMP only slight VIX call:robust t-statistics | (-4.43) | (-4.27) | (-3.82) | ||
| Regression 2: VJUMP only med. VIX call | -1.19*** | -0.64*** | -0.75*** | 2.17 | |
| Regression 2: VJUMP only med. VIX call: robust t-statistics | (-2.67) | (-2.99) | (-3.66) | ||
| Regression 2: VJUMP only deep VIX call | -0.79 | -0.72** | -0.87*** | 1.77 | |
| Regression 2: VJUMP only deep VIX call: robust t-statistics | (-1.42) | (-2.37) | (-3.76) | ||
| Regression 3: IVV and VJUMP deep SPX put | 5.45** | -2.04*** | -1.75*** | -0.61 | 4.01 |
| Regression 3: IVV and VJUMP deep SPX put: robust t-statistics | (2.49) | (-5.27) | (-4.25) | (-1.39) | |
| Regression 3: IVV and VJUMP med. SPX put | 6.43** | -1.82*** | -1.92*** | -0.59 | 3.13 |
| Regression 3: IVV and VJUMP med. SPX put: robust t-statistics | (2.24) | (-6.01) | (-3.79) | (-1.25) | |
| Regression 3: IVV and VJUMP slight SPX put: | 3.48** | -1.79*** | -1.15*** | -0.27 | 4.66 |
| Regression 3: IVV and VJUMP slight SPX put: robust t-statistics | (2.06) | (-7.05) | (-3.70) | (-0.84) | |
| Regression 3: IVV and VJUMP slight VIX call | 1.14 | -1.02*** | -0.53* | -0.31 | 3.60 |
| Regression 3: IVV and VJUMP slight VIX call: robust t-statistics | (0.88) | (-4.28) | (-1.95) | (-1.34) | |
| Regression 3: IVV and VJUMP med. VIX call | 0.84 | -0.65*** | -0.38 | -0.56** | 2.38 |
| Regression 3: IVV and VJUMP med. VIX call: robust t-statistics | (0.64) | (-3.10) | (-1.54) | (-2.22) | |
| Regression 3: IVV and VJUMP deep VIX call | 2.81* | -0.74** | -0.68** | -0.55* | 2.31 |
| Regression 3: IVV and VJUMP deep VIX call: robust t-statistics | (1.84) | (-2.43) | (-2.22) | (-1.84) |
| moneyness | const | R~Olag | σ∧V | VIX | JV | JTIX | TAIL | Adj. |
| Regression 1: Baseline regression deep SPX put | -3.07*** | -1.28*** | -1.11*** | 2.01 | ||||
| Regression 1: Baseline regression deep SPX put: robust t-statistics | (-5.48) | (-5.92) | (-5.12) | |||||
| Regression 1: Baseline regressionmed. SPX put | -2.72*** | -1.16*** | -1.25*** | 1.67 | ||||
| Regression 1: Baseline regression SPX put: robust t-statistics | (-4.01) | (-6.48) | (-4.64) | |||||
| Regression 1: Baseline regressions light SPX put | -1.82*** | -0.99*** | -0.66*** | 2.18 | ||||
| Regression 1: Baseline regression light SPX put:robust t-statistics | (-4.43) | (-6.05) | (-4.21) | |||||
| Regression 2: controlling for every explanatory variable deep SPX put | -1.22 | -1.38*** | -0.90*** | -1.04*** | 0.89 | -0.87 | -0.45 | 2.79 |
| Regression 2: controlling for every explanatory variable deep SPX put: robust t-statistics | (-1.06) | (-6.44) | (-3.26) | (-2.75) | (1.29) | (-1.64) | (-1.31) | |
| Regression 2: controlling for every explanatory variable med. SPX put | -1.30 | -1.22*** | -1.21*** | -0.59 | 0.59 | -0.89 | -0.61 | 2.10 |
| Regression 2: controlling for every explanatory variable med. SPX put: robust t-statistics | (-0.98) | (-6.63) | (-3.73) | (-1.47) | (0.77) | (-1.64) | (-1.54) | |
| Regression 2: controlling for every explanatory variable slight SPX put | -1.36* | -1.01*** | -0.55*** | -0.28 | 0.24 | -0.39* | -0.13 | 2.36 |
| Regression 2: controlling for every explanatory variable slight SPX put | (-1.88) | (-6.22) | (-3.06) | (-1.20) | (1.08) | (-1.72) | (-1.00) |
| moneyness | const | R~Olag | σ∧V | VIX | JV | JTIX | TAIL | Adj. |
| Regression 1: Baseline regression deep SPX put | -3.07*** | -1.28*** | -1.11*** | 2.01 | ||||
| Regression 1: Baseline regression deep SPX put: robust t-statistics | (-5.48) | (-5.92) | (-5.12) | |||||
| Regression 1: Baseline regression med. SPX put | -2.72*** | -1.16*** | -1.25*** | 1.67 | ||||
| Regression 1: Baseline regression med. SPX put: robust t-statistics | (-4.01) | (-6.48) | (-4.64) | |||||
| Regression 1: Baseline regression slight SPX put | -1.82*** | -0.99*** | -0.66*** | 2.18 | ||||
| Regression 1: Baseline regression slight SPX put: robust t-statistics | (-4.43) | (-6.05) | (-4.21) | |||||
| Regression 2: controlling for every explanatory variable deep SPX put | -1.22 | -1.38*** | -0.90*** | -1.04*** | 0.89 | -0.87 | -0.45 | 2.79 |
| Regression 2: controlling for every explanatory variable SPX put:robust t-statistics | (-1.06) | (-6.44) | (-3.26) | (-2.75) | (1.29) | (-1.64) | (-1.31) | |
| Regression 2: controlling for every explanatory variable med. SPX put | -1.30 | -1.22*** | -1.21*** | -0.59 | 0.59 | -0.89 | -0.61 | 2.10 |
| Regression 2: controlling for every explanatory variable med. SPX put: robust t-statistics | (-0.98) | (-6.63) | (-3.73) | (-1.47) | (0.77) | (-1.64) | (-1.54) | |
| Regression 2: controlling for every explanatory variable slight SPX put | -1.36* | -1.01*** | -0.55*** | -0.28 | 0.24 | -0.39* | -0.13 | 2.36 |
| Regression 2: controlling for every explanatory variable slight SPX put: robust t-statistics | (-1.88) | (-6.22) | (-3.06) | (-1.20) | (1.08) | (-1.72) | (-1.00) |
| Regression # | const | VVIX | VVRP | VRP | log(P/E) | log(P/D) | DFSP | TMSP | Adj. |
| Regression 1: Three-month horizon | 41.09 | -5.92 | 2.57 | ||||||
| Regression 1: Three-month horizon: robust t-statistics | (1.40) | (-1.28) | |||||||
| Regression 1: Three-month horizon | 6.34 | -1.77 | -1.20 | ||||||
| Regression 1: Three-month horizon: robust t-statistics | (0.70) | (-0.55) | |||||||
| Regression 1: Three-month horizon | 17.91** | -12.70*** | 17.43 | ||||||
| Regression 1: Three-month horizon: robust t-statistics | (2.31) | (-2.97) | |||||||
| Regression 1: Three-month horizon | -311.06 | -6.00 | -0.29 | 16.44 | 6.69 | 3.35 | 7.31 | ||
| Regression 1: Three-month horizon: robust t-statistics | (-0.54) | (-1.20) | (-0.03) | (0.68) | (0.40) | (0.59) | |||
| Regression 1: Three-month horizon | -456.91 | 4.62 | 20.96 | 5.72 | 3.30 | 5.91 | |||
| Regression 1: Three-month horizon: robust t-statistics | (-0.78) | (-1.47) | (0.43) | (0.84) | (0.34) | (0.58) | |||
| Regression 1: Three-month horizon | -81.42 | -11.77** | 1.22 | 4.31 | -1.14 | 4.08 | 14.52 | ||
| Regression 1: Three-month horizon: robust t-statistics | (-0.14) | (-2.42) | (0.11) | (0.17) | (-0.07) | (0.71) | |||
| Regression 2: Six-month horizon | 84.65* | -12.06* | 7.54 | ||||||
| Regression 2: Six-month horizon: robust t-statistics | (1.96) | (-1.89) | |||||||
| Regression 2: Six-month horizon | 7.27 | 0.43 | -1.63 | ||||||
| Regression 2: Six-month horizon : robust t-statistics | (0.38) | (0.07) | |||||||
| Regression 2: Six-month horizon | 32.45** | -21.79*** | 24.07 | ||||||
| Regression 2: Six-month horizon: robust t-statistics | (2.03) | (-2.74) | |||||||
| Regression 2: Six-month horizon | -1053.77 | -12.48* | 6.35 | 51.22 | 25.60 | 6.94 | 30.89 | ||
| Regression 2: Six-month horizon: robust t-statistics | (-1.14) | (-1.74) | (0.31) | (1.34) | (0.96) | (0.62) | |||
| Regression 2: Six-month horizon | -1157.23 | -6.50 | 13.00 | 52.05 | 18.61 | 6.09 | 24.14 | ||
| Regression 2: Six-month horizon: robust t-statistics | (-1.25) | (-1.10) | (0.65) | (1.35) | (0.71) | (0.55) | |||
| Regression 2: Six-month horizon | -826.49 | -14.73* | 11.29 | 36.89 | 13.69 | 7.59 | 28.82 | ||
| Regression 2: Six-month horizon: robust t-statistics | (-0.89) | (-1.78) | (0.56) | (0.96) | (0.52) | (0.68) | |||
| Regression 3: One-year horizon | 123.51** | -17.44** | 12.70 | ||||||
| Regression 3: One-year horizon: robust t-statistics | (2.02) | (-2.37) | |||||||
| Regression 3: One-year horizon | 7.21 | 3.10 | -1.44 | ||||||
| Regression 3: One-year horizon: robust t-statistics | (0.18) | (0.22) | |||||||
| Regression 3: One-year horizon | 48.98 | -31.35** | 40.25 | ||||||
| Regression 3: One-year horizon: robust t-statistics | (1.43) | (-2.24) | |||||||
| Regression 3: One-year horizon | -869.29 | -13.19 | 12.56 | 43.95 | 10.21 | -11.24 | 65.27 | ||
| Regression 3: One-year horizon: robust t-statistics | (-1.14) | (-1.54) | (0.50) | (1.31) | (0.38) | (-0.42) | |||
| Regression 3: One-year horizon | -966.47 | -7.66 | 19.67 | 44.33 | 2.46 | -12.56 | 59.95 | ||
| Regression 3: One-year horizon: robust t-statistics | (-1.21) | (-0.55) | (0.79) | (1.25) | (0.09) | (-0.47) | |||
| Regression 3: One-year horizon | -605.29 | -13.63 | 16.88 | 27.91 | -3.42 | -11.09 | 62.43 | ||
| Regression 3: One-year horizon: robust t-statistics | (-0.76) | (-1.33) | (0.69) | (0.80) | (-0.14) | (-0.42) |
| Regression # | const | VVIX | VVRP | VRP | log(P/E) | log(P/D) | DFSP | TMSP | Adj. R2 |
| Regression 1: Three-month horizon | -0.69 | 0.11 | -1.55 | ||||||
| Regression 1: Three-month horizon | (-0.08) | (0.08) | |||||||
| Regression 1: Three-month horizon | -5.41* | 2.97*** | 6.50 | ||||||
| Regression 1: Three-month horizon | (-1.74) | (2.91) | |||||||
| Regression 1: Three-month horizon | -4.21* | 3.61** | 10.51 | ||||||
| Regression 1: Three-month horizon | (-1.83) | (2.03) | |||||||
| Regression 1: Three-month horizon | 179.77 | 1.62 | 2.62 | -8.81 | -10.02 | -2.36 | 7.86 | ||
| Regression 1: Three-month horizon | (1.00) | (1.17) | (0.73) | (-1.17) | (-1.58) | (-1.53) | |||
| Regression 1: Three-month horizon | 256.55 | 3.33*** | 0.61 | -11.80 | -10.45 | -2.56 | 15.69 | ||
| Regression 1: Three-month horizon | (1.38) | (3.22) | (0.17) | (-1.51) | (-1.64) | (-1.64) | |||
| Regression 1: Three-month horizon | 72.37 | 4.99*** | 2.51 | -3.56 | -7.08 | -2.74* | 21.20 | ||
| Regression 1: Three-month horizon | (0.40) | (2.73) | (0.70) | (-0.47) | (-1.13) | (-1.74) | |||
| Regression 2: Six-month horizon | -14.45 | 2.19 | -0.03 | ||||||
| Regression 2: Six-month horizon | (-0.91) | (0.87) | |||||||
| Regression 2: Six-month horizon | -7.87 | 4.03* | 3.13 | ||||||
| Regression 2: Six-month horizon | (-1.13) | (1.83) | |||||||
| Regression 2: Six-month horizon | -8.95** | 7.52** | 14.65 | ||||||
| Regression 2: Six-month horizon | (-2.00) | (2.54) | |||||||
| Regression 2: Six-month horizon | 307.13 | 3.76 | 2.03 | -15.24 | -12.41 | -3.94 | 7.03 | ||
| Regression 2: Six-month horizon | (1.13) | (1.61) | (0.30) | (-1.36) | (-1.41) | (-1.44) | |||
| Regression 2: Six-month horizon | 403.08 | 5.52*** | -1.33 | -18.50 | -11.31 | -4.06 | 11.36 | ||
| Regression 2: Six-month horizon | (1.45) | (2.83) | (-0.19) | (-1.61) | (-1.29) | (-1.49) | |||
| Regression 2: Six-month horizon | 174.09 | 8.91*** | 0.31 | -7.98 | -7.89 | -4.81* | 16.19 | ||
| Regression 2: Six-month horizon | (0.64) | (2.90) | (0.04) | (-0.72) | (-0.92) | (-1.75) | |||
| Regression 3: One-year horizon | -26.67 | 3.99* | 0.87 | ||||||
| Regression 3: One-year horizon | (-1.43) | (1.69) | |||||||
| Regression 3: One-year horizon | -11.62 | 5.75 | 2.74 | ||||||
| Regression 3: One-year horizon | (-0.75) | (1.13) | |||||||
| Regression 3: One-year horizon | -14.30 | 11.23** | 17.28 | ||||||
| Regression 3: One-year horizon | (-1.43) | (2.57) | |||||||
| Regression 3: One-year horizon | 587.54** | 4.14 | -4.93 | -27.37** | -15.43 | -0.09 | 12.25 | ||
| Regression 3: One-year horizon | (2.38) | (1.34) | (-0.56) | (-2.66) | (-1.63) | (-0.01) | |||
| Regression 3: One-year horizon | 779.75*** | 9.83** | -10.48 | -34.88*** | -15.83* | -0.56 | 22.43 | ||
| Regression 3: One-year horizon | (2.89) | (2.10) | (-1.26) | (-2.99) | (-1.68) | (-0.08) | |||
| Regression 3: One-year horizon | 455.77* | 7.71* | -6.45 | -20.12* | -10.41 | -0.73 | 14.92 | ||
| Regression 3: One-year horizon | (1.72) | (1.87) | (-0.77) | (-1.79) | (-1.24) | (-0.11) |
| moneyness | const | R~Olag | VVIX | JV | JITX | Adj. R2 |
| Regression 1: VVIX only slight SPX call | -2.57* | -1.91*** | -0.07 | 4.11 | ||
| Regression 1: VVIX only slight SPX call: robust t-statistics | (-1.88) | (-6.65) | (-0.31) | |||
| Regression 1: VVIX only med. SPX call | -7.67*** | -1.74*** | 0.51 | 1.43 | ||
| Regression 1: VVIX only med. SPX call: robust t-statistics | (-2.87) | (-3.12) | (1.13) | |||
| Regression 1: VVIX only deep SPX call | -9.99*** | -2.69*** | 1.05* | 3.11 | ||
| Regression 1: VVIX only deep SPX call: robust t-statistics | (-3.25) | (-5.11) | (1.89) | |||
| Regression 2: JV only slight SPX call | -2.54*** | -1.94*** | -0.63** | 4.56 | ||
| Regression 2: JV only slight SPX call: robust t-statistics | (-9.10) | (-6.83) | (-2.33) | |||
| Regression 2: JV only med. SPX call | -4.45*** | -1.76*** | -0.24 | 1.33 | ||
| Regression 2: JV only med. SPX call: robust t-statistics | (-9.50) | (-3.15) | (-0.61) | |||
| Regression 2: JV only deep SPX call | -3.71*** | -2.71*** | -0.53 | 2.78 | ||
| Regression 2: JV only deep SPX call: robust t-statistics | (-5.66) | (-5.08) | (-1.15) | |||
| Regression 3: JTIX only slight SPX call | -2.46*** | -1.99*** | -0.98*** | 5.23 | ||
| Regression 3: JTIX only slight SPX call: robust t-statistics | (-9.32) | (-7.01) | (-3.41) | |||
| Regression 3: JTIX only med. SPX call | -4.14*** | -1.79*** | -0.81* | 1.62 | ||
| Regression 3: JTIX only med. SPX call: robust t-statistics | (-8.95) | (-3.19) | (-1.89) | |||
| Regression 3: JTIX only deep SPX call | -3.61*** | -2.72*** | -0.75 | 2.90 | ||
| Regression 3: JTIX only deep SPX call: robust t-statistics | (-5.43) | (-5.13) | (-1.23) |
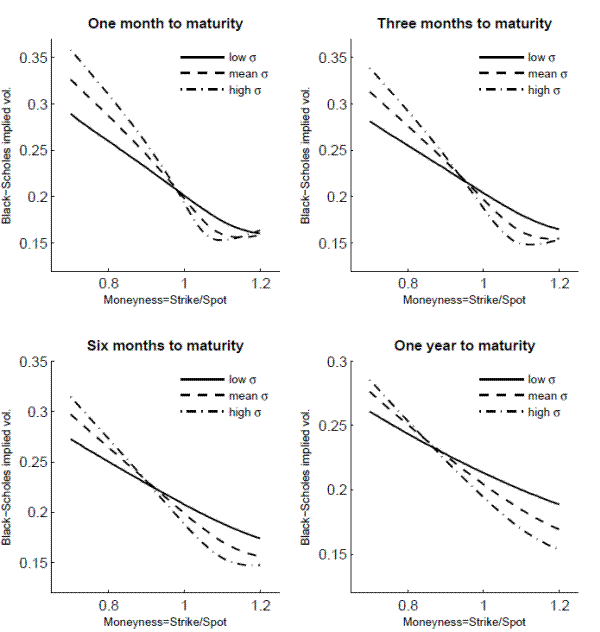
Each panel shows volatility smirks with di erent levels of volatility of volatility,σt, under the affine stochastic volatility framework. The parameters are obtained by taking the averages of those reported by Christoffersen, Heston, and Jacobs (2009) except for σt. That is, the persistence, the leverage effect, and the long-run volatility are set at 2.5971, -0.6850, and 0.0531, respectively. The low, mean, and high σt correspond to the lowest (0.3796), mean (0.6151), and highest (0.8516) values of their estimates of the volatility of volatility, respectively. The initial volatility state and the interest rate are set at the long-run volatility and 2%, respectively.
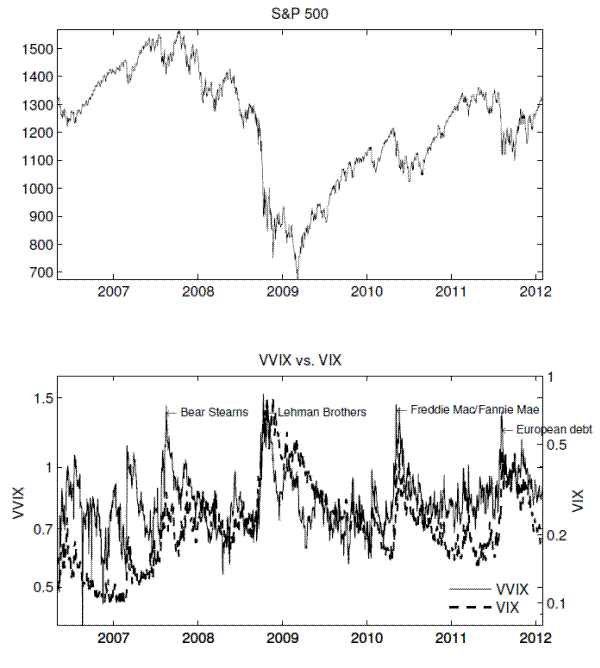
Figure 3: Realized volatility of volatility (top) and volatility of volatility risk premium (bottom).