
Release dates | Documentation
Current Monthly Release Other formats: ASCII | PDF (144 KB)
Supplemental Monthly Release Other formats: ASCII | PDF (144 KB)
Annual Revision Release Other formats: ASCII | PDF (150 KB)
Data Download Program (DDP) | Announcements | Historical data (text files)
INDUSTRIAL PRODUCTION AND CAPACITY UTILIZATION:
THE 2006 HISTORICAL AND ANNUAL REVISION
The Federal Reserve has revised the index of industrial production (IP) and the related measures of capacity and capacity utilization. Although data from January 1972 through October 2006 are affected, most of the revision occurs from 2003 onward. Measured from fourth quarter to fourth quarter, industrial production is now reported to have increased more slowly in 2003 and in 2004. The change in output was revised up for 2005 and revised down slightly for 2006. [1]
The revision to industrial production incorporates the Census Bureau�s 2004 and 2005 Annual Surveys of Manufactures (ASM), which show slightly lower annual levels of output than previously estimated. In addition to the 2004 and 2005 ASMs, other new source data for this year�s statistical revision to the IP indexes include selected 2005 Current Industrial Reports from the U.S. Census Bureau, new annual data on mineral extraction for 2004 and 2005 from the U.S. Geological Survey, and updated deflators from the Bureau of Economic Analysis. The new monthly production estimates reflect the incorporation of updated seasonal factors and monthly source data that became available (or were revised) after the closing of the regular four-month reporting window.
The revision to capacity utilization was relatively small. In the fourth quarter of 2005, the rate of capacity utilization for total industry was revised up 1/4 percentage point, to 80.7 percent. As of the third quarter of 2006, capacity utilization was only slightly less than previously estimated; at 82.3 percent, the rate was 1.3 percentage points above the 1972-2005 (long-run) average.[2] In 2004, the operating rate for manufacturing is about 1/2 percentage point lower than previously estimated. However, factory utilization rates are only a bit lower, on average, in 2005 and in 2006. For the 2003-06 period, utilization rates were revised down in a number of manufacturing industries, including computers, communications equipment, and textiles. Noticeable upward revisions occurred in the semiconductor and chemical industries. In mining, operating rates were revised up from 2003 through 2006. In electric and gas utilities, the capacity utilization rate was little changed in 2003, up a touch in 2004, and lower in 2005 and in 2006.
The revised capacity utilization rates incorporate the results from the Census Bureau�s 2005 Survey
of Plant Capacity for the fourth quarter of that year. In addition, the revisions to the capacity indexes
and capacity utilization rates incorporate the revised production indexes and newly available data on
industrial capacity from the U.S. Geological Survey, the Energy Information Agency of the U.S. Department
of Energy, and other organizations.
RESULTS OF THE REVISION
The tables show the summary statistics for the annual revision. Tables 1A and 1B show the monthly, quarterly, and annual average levels and rates of change for industrial production and for capacity for 1976 through 2006. Tables 2 and 3 show the revised rates of change from 2002 through 2006 of industrial production for market groups, industry groups, special aggregates, and selected detail. Table 4 shows revised rates of change for selected detail in industrial production, and table 5 shows the rates of change in capacity. Tables 2 through 5 also show the difference between the revised and earlier rates of change. Table 6 shows the revised capacity utilization rates for the final quarters of recent years (the third quarter was used for 2006) and the difference between the revised and previous rates. Tables 7A, 7B, 8A, 8B, 9A, and 9B report the revised production, capacity, and utilization series for manufacturing, for total industry excluding selected high-technology industries, and for manufacturing excluding selected high-technology industries. Table 10 reports the annual proportions in industrial production by market and industry groups for 1998 to 2005.
Industrial Production
The gains in total industrial production were revised down 0.4 percentage point in 2003, down 1.4 percentage points in 2004, up 0.2 percentage point in 2005, and down 0.1 percentage point in 2006.[3]
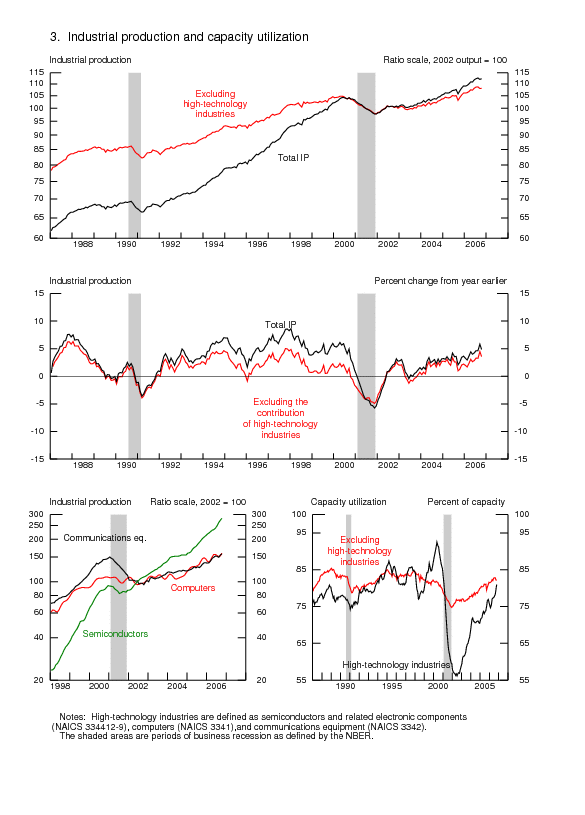
Manufacturing production has expanded in each year since 2002, albeit at a somewhat slower rate than initially reported, on balance. Increases in the output of durable goods have remained robust in recent years despite downward revisions in 2003 and in 2004. For nondurable goods, the increases for 2003 through 2005 were revised up an average of 3/4 percentage point per year. The estimate for 2006 was little changed. Across industry groups (table 2), downward revisions in the durable goods sector were widespread. Increases in the output of computer and electronic products were revised down from 2003 through 2005, and declines in the production of motor vehicles and parts over this period are now reported to have been steeper than originally estimated. The output of machinery was revised down substantially in 2004. Within the nondurable goods sector, the indexes for apparel and leather goods and for plastics and rubber products were revised down for the period since 2002. The cumulative increases since 2002 for all the other major components of nondurable goods are now higher than previously reported. Regarding a few special aggregates (table 3), the rates of growth for selected high-technology industries--computers and peripheral equipment, communications equipment, and semiconductors and related electronic components--were revised down in 2003 and in 2004 but up in 2005 and in 2006, adjustments that left the level lower overall. However, the aggregate index masks different movements in the major components: A higher level of output of computers and peripheral equipment was more than offset by lower output levels for communications equipment and for semiconductors and related equipment.
Production by Market Group
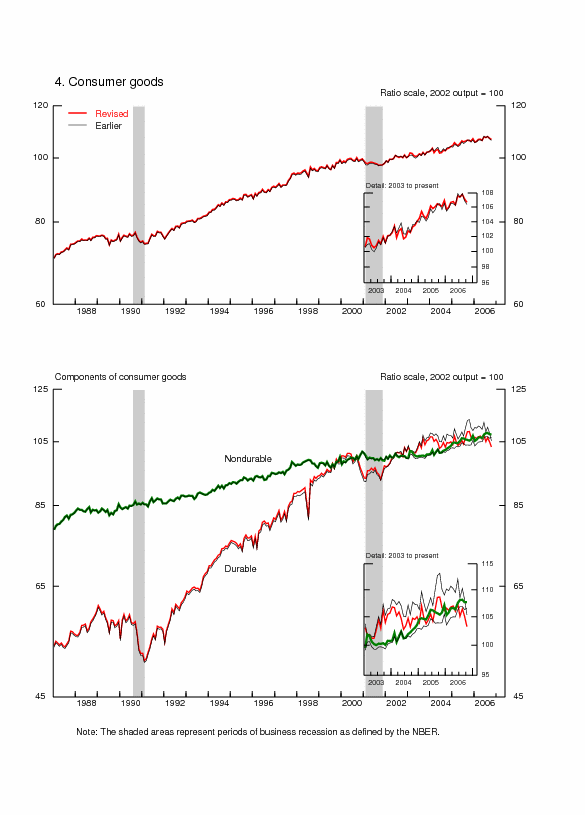
Among the major market groups, the increase in the production index for final products and nonindustrial supplies was revised down for 2004. For 2005, the growth rate in this index remains unchanged. For 2006, it was revised down 0.3 percentage point. Growth in the output of consumer goods was revised up in 2005 but down in 2006.
Within durable consumer goods, the output of automotive products was revised down for 2003 through 2006. In contrast, the production gains for home electronics in 2003, 2004, and 2006 were revised up appreciably. Among producers of consumer nondurables, the indexes for foods and tobacco, chemical products, and consumer energy products were revised up overall. The indexes for clothing and for paper products are now noticeably lower than estimated previously.
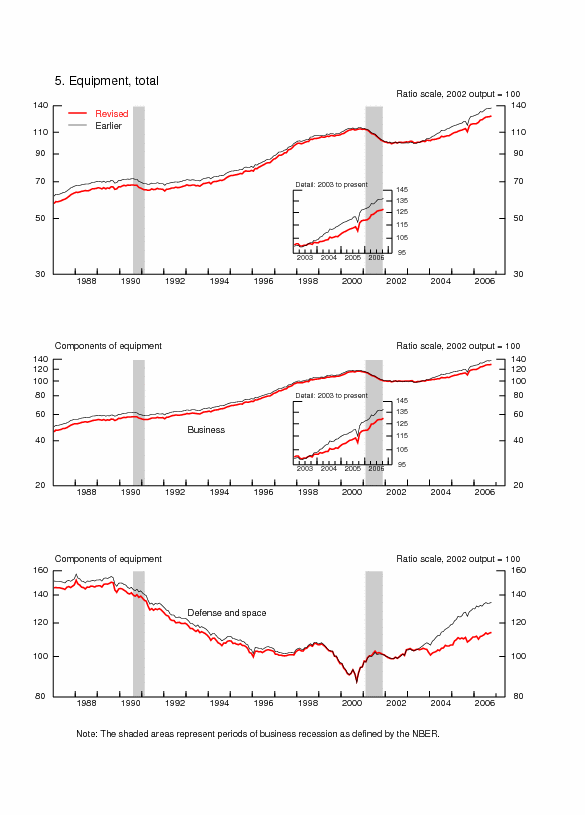
The production of business equipment is now reported to have been weaker from 2003 to 2006, largely because of downward revisions to the index for information processing equipment. In addition, the production of defense and space equipment also increased less from 2003 to 2006 than reported initially.
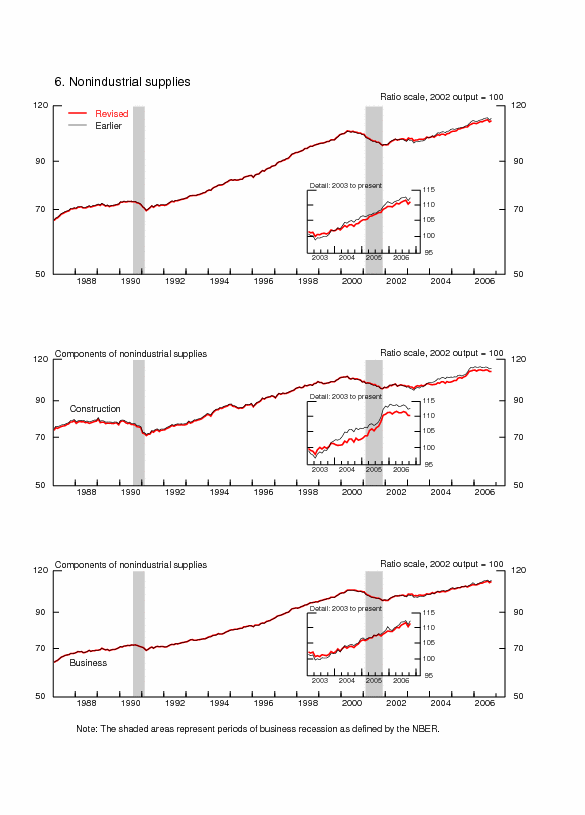
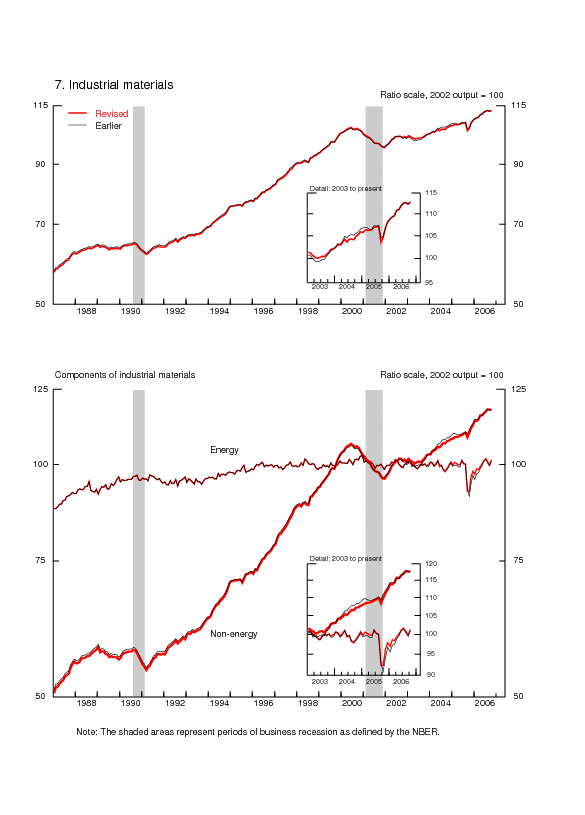
The indexes for construction supplies and for business supplies were both revised down in 2004, but the increases in 2005 are now larger. This year, the rise in the output of construction supplies has slowed noticeably, while the production of business supplies has recorded another strong gain. Despite a downward revision in 2004, the level of the output of materials is currently estimated to be a touch higher, on balance, over the entire revision period.
Capacity
Total industrial capacity is estimated to have fallen 3/4�percentage point more rapidly in 2003 than previously reported and to have risen 1/2 percentage point more slowly in both 2004 and 2005. Capacity is estimated to have increased nearly 2-1/2 percent in 2006, roughly 1/2 percentage point more quickly than initially published. The contour of manufacturing capacity and the revisions to that contour are similar to those for total industry. The revision shows that, relative to previous reports, aggregate capacity for the selected high-technology industries rose less quickly from 2003 to 2005 but increased more rapidly in 2006. Excluding high-technology industries, manufacturing capacity declined in 2003 and 2004 and expanded in 2005 and 2006; the rates of increase were marked down in each year except 2005, which was unrevised.
Capacity at mines is still estimated to have contracted from 2003 to 2005 but is now shown to have increased in 2006. Capacity at electric and gas utilities was revised upward in 2006 but was little revised in previous years.
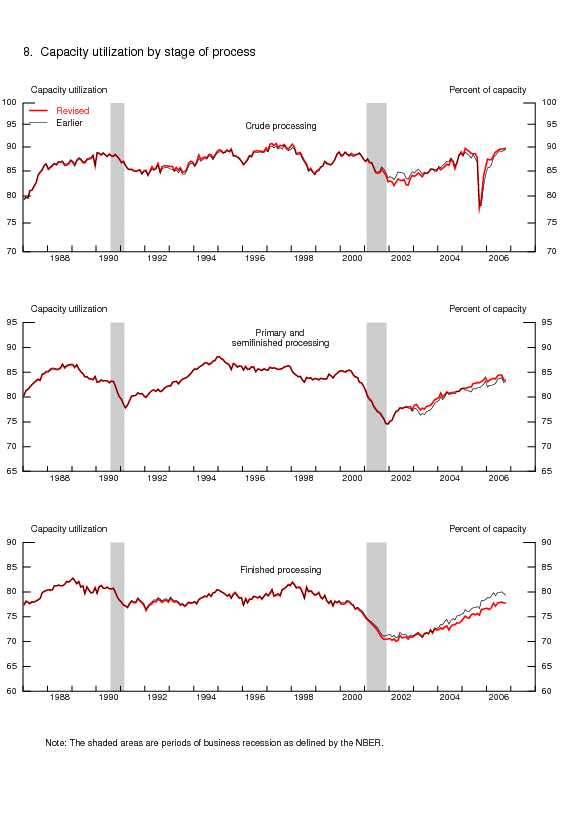
By stage of processing, capacity in the crude stage fell from 2003 to 2005 and is estimated to have edged up 0.3 percent in 2006. Capacity at the primary and semifinished stages declined in 2003 but rose from 2004 through 2006. Capacity expanded from 2003 to 2006 for finished goods.
Capacity Utilization
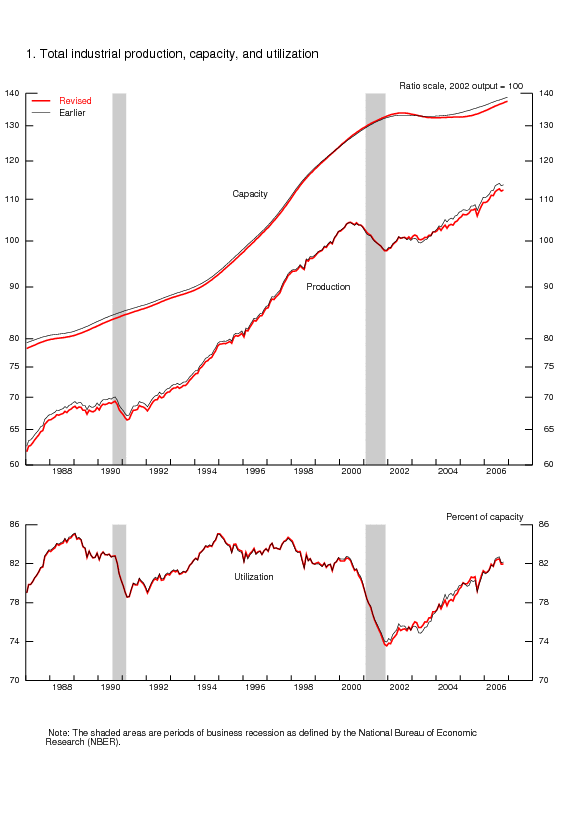
The capacity utilization rate for total industry was 82.3 percent in the third quarter of 2006, 1.3 percentage points above its 1972-2005 average and 0.2 percentage point lower than reported earlier. The utilization rate for total industry was revised up 1/4 percentage point in the fourth quarters of 2003 and 2005 and revised down 0.4 percentage point in the fourth quarter of 2004.
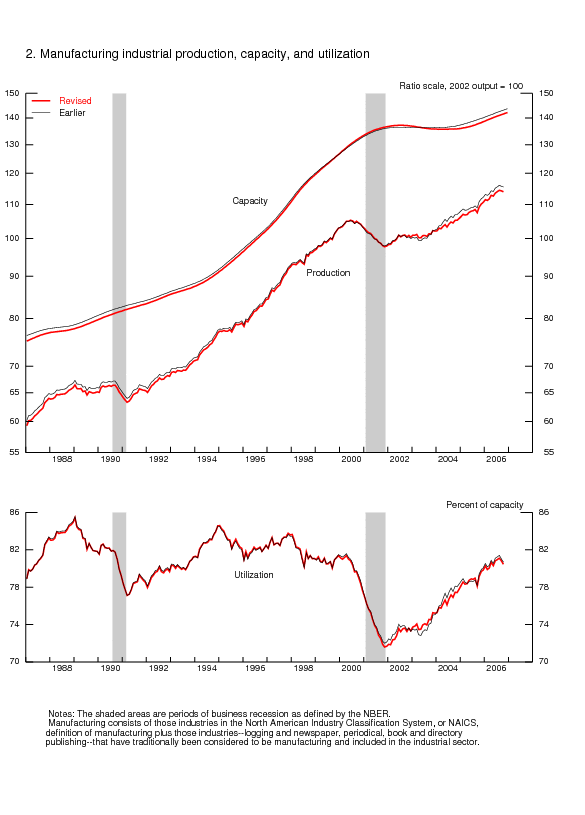
The manufacturing operating rate was 80.9 percent in the third quarter of 2006, 0.3 percentage point below the previous estimate and 1.1 percentage points above its 1972-2005 average. The rates for 2004 and 2005 were also marked down, by 0.6 percentage point and by 0.2 percentage point, respectively; the rate for 2003 was revised up 0.3 percentage point. Utilization rates for durable goods manufacturers were lower from 2004 to 2006 than previously published. Some of the largest downward revisions were in machinery and in electrical equipment, appliances, and components. Revisions generally were upward for wood products, primary metals, fabricated metal products, and furniture. Utilization rates for nondurable goods industries were revised upward; the largest revisions were in textile mills, petroleum and coal products, and chemicals. The largest downward revisions were in food, apparel and leather, and plastics and rubber products. Capacity utilization in the other (non-NAICS) manufacturing industries was revised upward in 2003 and 2004 and downward in 2005 and 2006.
The operating rates for computer and electronic products and for communications equipment were also lowered noticeably in recent years, while utilization in the semiconductor industry was revised up substantially. On balance, the aggregate of selected high-technology industries now shows that utilization was lower in 2004 and 2006 but higher in 2003 and 2005. In the third quarter of 2006, the operating rate was 78.5 percent, 2 percentage points above the fourth quarter of 2005.
Capacity utilization in mining was revised up between 2003 and 2006, mainly because of higher operating rates in the oil and gas extraction industries. As of the third quarter of 2006, the utilization rate for mining is now estimated to be 91.1 percent, up 6.1 percentage points from the fourth quarter of 2005. In electric and gas utilities, capacity utilization rates were revised down in 2005 and in 2006 but were little changed in previous years. At 86.0 percent in the third quarter of 2006, the operating rate for utilities was 0.8 percentage point below its long-run average.
TECHNICAL ASPECTS OF THE REVISION
The benchmark indexes for manufacturing--defined for each six-digit NAICS industry as nominal gross output divided by a price index--were updated to include new as well as revised information from the 2003, the 2004, and the 2005 Annual Surveys of Manufactures. This revision also incorporates the 2005 Survey of Plant Capacity, other annual industry reports, recent information on prices, and revised monthly source data on physical product and production-worker hours.
As mentioned earlier, the benchmark indexes for most industries incorporate updated price indexes from the industry output program of the Bureau of Economic Analysis. However, the price indexes for semiconductors and the price indexes for most components of communications equipment (NAICS 3342) are constructed by the Federal Reserve from alternative sources. These indexes along with others for transmission equipment (fiber-optic equipment), networking equipment (routers, switches, hubs, and wireless equipment), central office equipment, and for private branch exchange equipment were extended an additional year. In addition, new source data were introduced for the estimation of price indexes for mobile phones and related equipment and for satellites and related equipment. Gartner, a technology research firm, was the source for the data on prices and the value of sales for mobile phones, base stations, and cellular switching equipment that were used to construct an annual price index for the 1994-2005 period. For satellites and related equipment, data on satellite capacity costs from Futron Corporation and data on equipment for global positioning systems from the NPD Group were used to construct a price index for the 2001-2005 period. Price indexes for these products were extended back to 1972 using a bias adjustment to the relevant producer price indexes (PPIs) published by the U.S. Bureau of Labor Statistics. For the remaining series, PPIs were used.
The new product prices for communications equipment declined more than estimated earlier. Accordingly, the output of communications equipment is now shown to have risen about 6 percent more per year, on average, from 1972 through 2005. The yearly pattern was little changed; exceptions were 2004 and 2005, when upward revisions from faster falling prices were more than offset by downward revisions caused by benchmarking to the 2004 and the 2005 ASM. The revised level of output for communications equipment in October 2006 now stands 58 percent higher than its 2002 level compared with 95 percent before the revision.
As in 2003, the 2004 and 2005 ASMs did not provide data for all six-digit NAICS industries but combined some of them into higher-level industry aggregates. The benchmark indexes for manufacturing IP are calculated from gross output for six-digit industries and then aggregated to the IP industry level using proportions based on value added. To maintain benchmark references that were consistent over time, the Federal Reserve imputed estimates of gross output for industries no longer reported separately based on values for the aggregate industries that contained them and the gross output shares for the disaggregate industries in 2002.
Changes to Individual Production Series
With this revision, the monthly production indicators for some series have changed, and some new series have been created.
Ethanol
Data on ethanol production from the Energy Information Agency of the Department of Energy were used for a new industrial production index for ethyl alcohol (NAICS 325193) that begins in 1997. Previously, ethanol production had been included in the production index for organic chemicals (NAICS 32511, 32519), which used the output of eight basic organic chemicals as its high-frequency indicator. Those data are now used as the indicator for a new series that covers the combined output of petrochemicals (NAICS 32511) and other organic chemicals (NAICS 32519) except ethanol.[4]
Unitary air conditioners
The output of unitary air conditioners includes central air units and heat pumps and is a part of NAICS industry 333415, which covers air conditioners, nonhousehold refrigeration equipment, and warm air furnaces. The output of unitary air conditioners is now represented by separate production indexes for residential and nonresidential units for the period 1997 to the present. Previously, data on shipments adjusted by inventory change from the Air-Conditioning and Refrigeration Institute (ARI) were used to estimate the output of total unitary air conditioners. The ARI shipments data are available for seventeen size categories, each of which is now split between residential and nonresidential units. The bulk of the smaller categories is assumed to be residential, and the bulk of the larger categories is assumed to be nonresidential. Relative prices for the various size categories are derived from Current Industrial Reports from the Census Bureau for recent years; previously, the index was based on an unweighted sum of units.
Audio and video equipment
The monthly indicator for audio and video equipment (NAICS 3343) was updated to include both digital televisions and speakers for the period 2002 to the present. Previously, the index reflected shipments of analog televisions with diagonal sizes of 25 inches or larger that were adjusted for imports. New data on unit and dollar sales of digital televisions are available by technology (plasma, LCD, projection, and other) and by size from the Consumer Electronics Association (CEA). Likewise, data for speaker sales are available from the CEA. U.S. production weights are derived from Current Industrial Reports from the Census Bureau and are combined with the new data to construct a Fisher production index for the industry.
High-technology goods
Beginning in 2002, data on U.S. sales of routers and switches from Synergy Research Group, an industry research group, were introduced as the quarterly indicator for data networking equipment, which is part of telephone apparatus manufacturing (NAICS 334210). Previously, the indicator was constructed from somewhat less-comprehensive and less-timely information from Gartner and was extended by data on production-worker hours from the U.S. Bureau of Labor Statistics.
As in previous years, the index for the production of microprocessor units is based on worldwide sales data from the Semiconductor Industry Association. With this revision, the translation of worldwide sales to domestic production is based on quarterly estimates of production at U.S. manufacturing establishments provided by Instat, a technology research firm. Previously, the domestic production share of worldwide sales was based on product-level data from the Current Industrial Reports. New source data for estimating the U.S. share of microprocessor manufacturing introduced a different pattern of production in the industry; more-noticeable decelerations in 1994, 2001 and 2005 and a more-rapid acceleration in 1995. In 2006, a climbing production share and faster falling price index combine to revise microprocessor output up sharply.
Periodicals and other publishers
The index for periodicals and other publishers (NAICS 51112, 51114, and 51119) was split into separate indexes for periodicals (NAICS 51112) and other publishers (NAICS 51114, 51119). Both new indexes use production-worker hours as monthly indicators and begin in 1987. The separate indicators will allow comparisons to other industry data.
Series switched from using product data to production-worker hours
Product data used as indicators for several IP indexes were discontinued in the past few years and have been replaced by production-worker hours for 2002 to the present. The industries affected are coffee (NAICS 31192), cotton and synthetic fabrics (part of NAICS 31321), wool fabrics (part of NAICS 31321), tire cord (NAICS 314992), hosiery (NAICS 31511), pigments (NAICS 31523), synthetic rubber (NAICS 325212), and electron tubes (NAICS 334411).
Reliability of monthly estimates
The first estimate of output for a month is preliminary and is subject to revision in each of the subsequent three months as new source data become available. By the third revision (the fourth month of estimate), the product-based content of IP is 54 percent (see table below).
| Month of estimate | ||||
|---|---|---|---|---|
| Type of Data |
1st | 2nd | ||
| 3rd | 4th | |||
| Physical product | 27 | 42 | 54 | 54 |
| Production-worker hours | 43 | 43 | 43 | 43 |
| IP data received | 70 | 84 | 96 | 97 |
| IP data estimated | 30 | 16 | 4 | 3 |
Changes to Individual Capacity Series
With this revision, the organic chemicals series (NAICS 32511, 9) was split into two series--ethyl alcohol (also known as ethanol, NAICS 325193) and organic chemicals excluding ethanol (NAICS 32511, 9 except 325193)--for 1997 and onward. The capacity indicator for ethanol is gallons of ethanol capacity from the Renewable Fuels Association. The capacity indicator for organic chemicals excluding ethanol is based on utilization rates from the Survey of Plant Capacity.
Capacity for synthetic rubber is now based on utilization rates from the Survey of Plant Capacity
and begins in 2002. Capacity for previous years is still derived from physical capacity data from the
International Institute of Synthetic Rubber Producers.
| Production | Price | Value of Production (millions of dollars) |
|
|---|---|---|---|
| Annual Estimates (indexes are 2002=100) | |||
| 1998 | 58.7 | 247.5 | 20,556.4 |
| 1999 | 82.5 | 202.6 | 23,781.6 |
| 2000 | 113.8 | 180.2 | 29,160.7 |
| 2001 | 124.7 | 135.4 | 25,202.6 |
| 2002 | 100.0 | 100.0 | 15,747.5 |
| 2003 | 90.7 | 91.8 | 13,088.5 |
| 2004 | 89.1 | 79.2 | 11,151.3 |
| 2005 | 102.0 | 71.1 | 11,455.9 |
| Quarterly Estimates (indexes are 2002=100) | |||
| 1998q1 | 49.9 | 274.9 | 19,361.9 |
| 1998q2 | 59.1 | 242.6 | 21,667.2 |
| 1998q3 | 62.5 | 230.8 | 20,516.9 |
| 1998q4 | 63.3 | 240.1 | 20,806.8 |
| 1999q1 | 78.3 | 210.5 | 23,513.5 |
| 1999q2 | 82.7 | 192.7 | 23,906.1 |
| 1999q3 | 82.1 | 204.3 | 23,545.0 |
| 1999q4 | 87.0 | 202.6 | 24,224.3 |
| 2000q1 | 103.3 | 184.8 | 27,993.8 |
| 2000q2 | 113.9 | 170.9 | 28,940.9 |
| 2000q3 | 117.4 | 182.9 | 29,722.5 |
| 2000q4 | 120.6 | 182.1 | 29,970.2 |
| 2001q1 | 136.7 | 145.8 | 29,004.9 |
| 2001q2 | 124.1 | 136.5 | 25,699.2 |
| 2001q3 | 120.5 | 131.8 | 23,512.1 |
| 2001q4 | 117.4 | 128.1 | 22,504.3 |
| 2002q1 | 101.1 | 110.1 | 17,062.0 |
| 2002q2 | 102.5 | 114.5 | 16,765.8 |
| 2002q3 | 98.5 | 88.9 | 14,914.0 |
| 2002q4 | 97.9 | 88.2 | 14,158.7 |
| 2003q1 | 94.0 | 85.6 | 13,208.2 |
| 2003q2 | 86.7 | 110.9 | 13,634.8 |
| 2003q3 | 89.8 | 90.9 | 13,349.1 |
| 2003q4 | 92.3 | 81.8 | 12,057.9 |
| 2004q1 | 95.9 | 79.3 | 12,689.1 |
| 2004q2 | 89.6 | 85.6 | 10,716.9 |
| 2004q3 | 86.3 | 76.9 | 10,995.1 |
| 2004q4 | 84.5 | 75.5 | 10,241.2 |
| 2005q1 | 88.7 | 69.2 | 10,456.8 |
| 2005q2 | 109.9 | 76.2 | 11,598.7 |
| 2005q3 | 100.9 | 69.8 | 11,607.9 |
| 2005q4 | 108.4 | 69.6 | 12,090.7 |
Weights for Aggregation
The IP index is a Fisher index. This revision uses information from the Census of Manufactures to obtain updated estimates of the industry value-added weights used in the aggregation of IP indexes and capacity utilization rates. The Federal Reserve derives estimates of value added for the electric and gas utility industries from annual revenue and expense data issued by other organizations. The weights for aggregation, expressed as unit value added, were estimated using the latest data on producer prices. Table 10 shows the annual value-added proportions in the IP index from 1997 through 2005.
Revised Monthly Data
This revision incorporates product data that became available after the regular four-month reporting window for monthly IP was closed. These data are released with too great a lag to be included with monthly IP estimates; however, the data are available for inclusion in the annual revision.
Revised Seasonal Factors
Seasonal factors for all series were reestimated using data that extend into 2006. Factors for
production-worker hours--which adjust for timing, holiday, and monthly seasonal patterns--were updated with
data through September 2006 and were prorated to correspond with the seasonal factors for hours aggregated
to the three-digit NAICS level. The updated factors for the physical product series, which include
adjustments for holiday and workday patterns, used data through 2006. Seasonal factors for unit motor
vehicle assemblies have been updated, and projections through June 2007 are on the Board�s website at
www.federalreserve.gov/releases/g17/mvsf.htm.
Notice
Data Availability and Publication Changes
Files containing the revised data and the text and tables from this release are available on the Board's web site, at www.federalreserve.gov/releases/g17, and on diskettes from Publications Services (telephone number 202-452-3245). Updated data for all of the regularly issued series on industrial production, capacity, and capacity utilization are available on the website. The revised data will also be available through the STAT-USA website of the Department of Commerce (www.stat-usa.gov). Further information on these revisions is available from the Board's Industrial Output Section (telephone 202-452-3197).
A document with printed tables of the revised estimates of series shown in the G.17 release is available upon request to the Industrial Output Section, Mail Stop 82, Division of Research and Statistics, Board of Governors of the Federal Reserve System, Washington, DC 20551.
An expanded version of this release will be published in a forthcoming article in the Federal
Reserve Bulletin.
1 For 2006, the differences between the rates of change are calculated from annualized rates of change between the fourth quarter of 2005 and the third quarter of 2006.
Return to text
2 These comparisons use quarterly average data.
Return to text
3 In this section, all the rates of change are calculated from the fourth quarter of the previous year to the fourth quarter of the reference year, except for 2006, for which the rates of change are from the fourth quarter of 2005 to the third quarter of 2006 and annualized.
Return to text
4 The market assignment of ethanol was changed from non-energy chemical materials to energy materials.
Return to text
G.17 Revision Release Tables:
| Chart 1 | Total industrial production, capacity, and utilization | |
| Chart 2 | Manufacturing industrial production, capacity, and utilization | |
| Chart 3 | Industrial production and capacity utilization | |
| Chart 4 | Consumer goods | |
| Chart 5 | Equipment, total | |
| Chart 6 | Nonindustrial supplies | |
| Chart 7 | Industrial materials | |
| Chart 8 | Capacity utilization by stage of process | |
| Ascii | Screen reader | Table 1A:Industrial Production: Total |
| Ascii | Screen reader | Table 1B: Capacity and Utilization: Total |
| Ascii | Screen reader | Table 2: Rates of Change in Industrial Production, Market and Industry Group Summary: 2002-2006 |
| Ascii | Screen reader | Table 3: Rates of Change in Industrial Production, Special Aggregates and Selected Detail:2002-2006 |
| Ascii | Screen reader | Table 4: Annual Rates of Change for Industrial Production |
| Ascii | Screen reader | Table 5: Rates of Change in Capacity, By Industry Groups: 2002 to 2006 |
| Ascii | Screen reader | Table 6: Revised and Earlier Capacity Utilization Rates, By Industry Groups |
| Ascii | Screen reader | Table 7A: Industrial Production: Manufacturing |
| Ascii | Screen reader | Table 7B: Capacity and Utilization: Manufacturing |
| Ascii | Screen reader | Table 8A: Industrial Production: Total Industry Excluding Selected High-Technology Industries |
| Ascii | Screen reader | Table 8B: Capacity and Utilization: Total Industry Excluding Selected High-Technology Industries |
| Ascii | Screen reader | Table 9A: Industrial Production: Manufacturing Excluding Selected High-Technology Industries |
| Ascii | Screen reader | Table 9B: Capacity and Utilization: Manufacturing Excluding Selected High-Technology Industries |
| Ascii | Screen reader | Table 10: Annual Proportion in Industrial Production, Market and Industry Group Summary |
Release dates | Documentation
Current Monthly Release Other formats: ASCII | PDF (144 KB)
Supplemental Monthly Release Other formats: ASCII | PDF (144 KB)
Annual Revision Release Other formats: ASCII | PDF (150 KB)
Data Download Program (DDP) | Announcements | Historical data (text files)