Commercial Paper Rates and Outstanding Summary
Maturity Distribution of Commercial Paper Outstanding
RSS
Data Download
FRED
Derived from data supplied by The Depository Trust & Clearing Corporation
Data as of February 6, 2026Posted February 9, 2026
This page will be updated at the beginning of each week using the week-ending outstanding data for the previous two weeks.
Weekly totals of maturing commercial paper
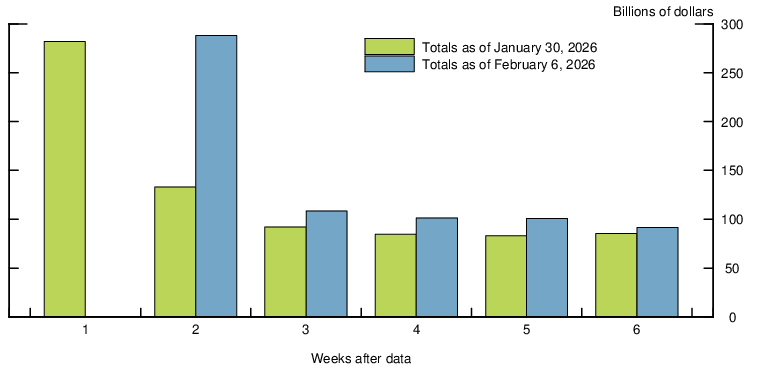
Weekly totals for outstanding commercial paper as of January 30, 2026
| Maturing Period | Total 1 | Asset-backed | Not Asset-backed | |||||
|---|---|---|---|---|---|---|---|---|
| Tier-1 | Tier-2 | |||||||
| Amount 2 | Percent 3 | Amount 2 | Percent 3 | Amount 2 | Percent 3 | Amount 2 | Percent 3 | |
| Feb. 2 - Feb. 6 | 282.0 | 20.0 | 86.6 | 19.7 | 47.5 | 17.2 | 38.8 | 32.5 |
| Feb. 9 - Feb. 13 | 133.0 | 9.4 | 30.8 | 7.0 | 24.8 | 9.0 | 24.2 | 20.2 |
| Feb. 16 - Feb. 20 | 92.1 | 6.5 | 23.5 | 5.4 | 15.2 | 5.5 | 10.5 | 8.8 |
| Feb. 23 - Feb. 27 | 84.6 | 6.0 | 25.0 | 5.7 | 15.8 | 5.7 | 8.0 | 6.7 |
| Mar. 2 - Mar. 6 | 83.0 | 5.9 | 23.7 | 5.4 | 18.0 | 6.5 | 5.3 | 4.5 |
| Mar. 9 - Mar. 13 | 85.1 | 6.0 | 20.8 | 4.7 | 20.5 | 7.4 | 10.5 | 8.8 |
Weekly totals for outstanding commercial paper as of February 06, 2026
| Maturing Period | Total 1 | Asset-backed | Not Asset-backed | |||||
|---|---|---|---|---|---|---|---|---|
| Tier-1 | Tier-2 | |||||||
| Amount 2 | Percent 4 | Amount 2 | Percent 4 | Amount 2 | Percent 4 | Amount 2 | Percent 4 | |
| Feb. 9 - Feb. 13 | 288.3 | 20.4 | 79.5 | 18.4 | 45.5 | 16.5 | 51.2 | 43.2 |
| Feb. 16 - Feb. 20 | 108.6 | 7.7 | 24.9 | 5.8 | 16.9 | 6.1 | 14.6 | 12.3 |
| Feb. 23 - Feb. 27 | 101.4 | 7.2 | 25.6 | 5.9 | 20.6 | 7.5 | 10.0 | 8.4 |
| Mar. 2 - Mar. 6 | 100.6 | 7.1 | 26.6 | 6.1 | 22.0 | 8.0 | 7.3 | 6.2 |
| Mar. 9 - Mar. 13 | 91.4 | 6.5 | 22.2 | 5.1 | 21.5 | 7.8 | 11.1 | 9.4 |
| Mar. 16 - Mar. 20 | 57.8 | 4.1 | 21.8 | 5.0 | 9.5 | 3.4 | 3.0 | 2.5 |
Average maturity for outstanding commercial paper
Days, weighted by outstanding amount| Period | Total 1 | Asset- backed |
Not asset-backed | |
|---|---|---|---|---|
| Tier-1 | Tier-2 | |||
| Jan. 30 | 58.4 | 64.6 | 64.0 | 28.9 |
| Feb. 6 | 59.2 | 66.7 | 64.5 | 26.8 |
Last Update: February 9, 2026