

 DDP
DDP Print
PrintIndustrial Production and Capacity Utilization - G.17
Current Release (250 KB PDF) (ASCII)
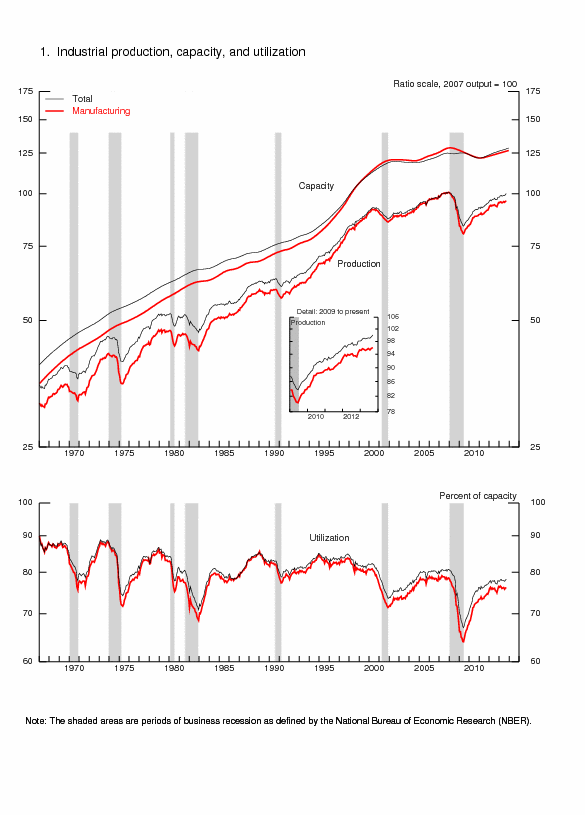
Industrial production increased 0.6 percent in September following a gain of 0.4 percent in August. For the third quarter as a whole, industrial production rose at an annual rate of 2.3 percent. Manufacturing output edged up 0.1 percent in September following a gain of 0.5 percent in August, and increased at an annual rate of 1.2 percent for the third quarter. Production at mines moved up 0.2 percent in September and advanced at an annual rate of 12.9 percent for the third quarter. The output of utilities rose 4.4 percent in September following declines in each of the previous five months. The level of the index for total industrial production in September was equal to its 2007 average and was 3.2 percent above its year-earlier level. Capacity utilization for total industry moved up 0.4 percentage point to 78.3 percent, a rate 1.9 percentage points below its long-run (1972-2012) average.
Industrial Production and Capacity Utilization: Summary
| Industrial production | 2007=100 | Percent change | |||||||||||
|---|---|---|---|---|---|---|---|---|---|---|---|---|---|
| 2013 | 2013 | Sept. '12 to Sept. '13 |
|||||||||||
| Apr.[r] | May[r] | June[r] | July[r] | Aug.[r] | Sept.[p] | Apr.[r] | May[r] | June[r] | July[r] | Aug.[r] | Sept.[p] | ||
| Total index | 98.8 | 98.9 | 99.1 | 99.1 | 99.5 | 100.0 | -.3 | .1 | .2 | -.1 | .4 | .6 | 3.2 |
| Previous estimates | 98.7 | 98.9 | 99.0 | 99.0 | 99.4 | -.3 | .1 | .1 | .0 | .4 | |||
| Major market groups | |||||||||||||
| Final Products | 96.8 | 96.6 | 97.0 | 96.3 | 96.6 | 97.5 | -.4 | -.3 | .5 | -.8 | .3 | .9 | 2.4 |
| Consumer goods | 94.2 | 93.9 | 94.3 | 93.5 | 93.7 | 94.4 | -.6 | -.3 | .3 | -.8 | .2 | .8 | 2.2 |
| Business equipment | 102.3 | 102.2 | 102.8 | 102.0 | 102.5 | 103.8 | .0 | -.2 | .6 | -.8 | .5 | 1.2 | 3.7 |
| Nonindustrial supplies | 87.9 | 88.0 | 88.1 | 88.3 | 88.5 | 89.1 | -.5 | .1 | .1 | .2 | .2 | .7 | 3.5 |
| Construction | 81.0 | 80.6 | 81.2 | 81.6 | 81.8 | 82.3 | -1.1 | -.5 | .7 | .5 | .3 | .6 | 5.6 |
| Materials | 104.5 | 105.0 | 105.0 | 105.4 | 106.0 | 106.3 | -.1 | .5 | .0 | .4 | .5 | .3 | 3.7 |
| Major industry groups | |||||||||||||
| Manufacturing (see note below) | 95.2 | 95.4 | 95.7 | 95.4 | 95.9 | 96.0 | -.3 | .3 | .3 | -.4 | .5 | .1 | 2.6 |
| Previous estimates | 95.1 | 95.4 | 95.7 | 95.3 | 96.0 | -.4 | .2 | .3 | -.4 | .7 | |||
| Mining | 116.8 | 117.6 | 119.0 | 120.9 | 121.6 | 121.9 | .8 | .7 | 1.2 | 1.6 | .6 | .2 | 6.6 |
| Utilities | 102.1 | 100.3 | 98.3 | 98.1 | 97.3 | 101.6 | -1.6 | -1.8 | -2.0 | -.2 | -.9 | 4.4 | 2.5 |
| Capacity utilization | Percent of capacity | Capacity growth |
|||||||||||
|---|---|---|---|---|---|---|---|---|---|---|---|---|---|
| Average 1972- 2012 |
1988- 89 high |
1990- 91 low |
1994- 95 high |
2009 low |
2012 Sept. |
||||||||
| 2013 | Sept. '12 to Sept. '13 |
||||||||||||
| Apr.[r] | May[r] | June[r] | July[r] | Aug.[r] | Sept.[p] | ||||||||
| Total industry | 80.2 | 85.2 | 78.8 | 85.0 | 66.9 | 77.2 | 77.9 | 77.9 | 77.9 | 77.7 | 77.9 | 78.3 | 1.8 |
| Previous estimates | 77.8 | 77.8 | 77.8 | 77.6 | 77.8 | ||||||||
| Manufacturing (see note below) | 78.7 | 85.6 | 77.3 | 84.6 | 64.0 | 75.3 | 75.9 | 76.0 | 76.2 | 75.8 | 76.1 | 76.1 | 1.6 |
| Previous estimates | 75.9 | 75.9 | 76.1 | 75.7 | 76.1 | ||||||||
| Mining | 87.3 | 86.3 | 83.9 | 88.6 | 78.3 | 88.0 | 87.8 | 88.1 | 88.9 | 89.9 | 90.1 | 90.0 | 4.2 |
| Utilities | 86.2 | 92.9 | 84.3 | 93.3 | 78.6 | 78.1 | 79.9 | 78.5 | 76.8 | 76.7 | 75.9 | 79.3 | 1.0 |
| Stage-of-process groups | |||||||||||||
| Crude | 86.3 | 87.7 | 84.4 | 89.7 | 76.4 | 86.4 | 86.2 | 86.9 | 87.2 | 87.9 | 88.1 | 87.9 | 3.3 |
| Primary and semifinished | 81.0 | 86.5 | 78.0 | 87.9 | 64.4 | 74.8 | 76.4 | 76.1 | 75.7 | 75.7 | 75.9 | 76.6 | .6 |
| Finished | 77.1 | 83.4 | 77.3 | 80.6 | 66.8 | 76.0 | 75.8 | 75.8 | 76.3 | 75.4 | 75.6 | 75.7 | 2.7 |
Market Groups
The production of consumer goods increased 0.8 percent in September but declined at an annual rate of 1.1 percent for the third quarter as a whole. The index for durable consumer goods advanced 0.7 percent in September, as a gain in the output of automotive products more than offset declines in the production of home electronics; appliances, furniture, and carpeting; and miscellaneous goods. The output of durable consumer goods increased at an annual rate of 2.1 percent for the third quarter as a whole. The production of nondurables rose 0.9 percent in September. The increase was driven by a gain in the output of energy products, which moved up 3.9 percent, while the output of non-energy nondurables decreased 0.2 percent, a third consecutive monthly decline. Within non-energy nondurables, the indexes for foods and tobacco and for chemicals both declined 0.3 percent. In contrast, the output of clothing increased 1.6 percent and was 4.5 percent above its September 2012 level. The output of nondurable consumer goods decreased at an annual rate of 2.0 percent for the third quarter as a whole.
The output of business equipment moved up 1.2 percent in September and increased at an annual rate of 1.2 percent for the third quarter as a whole. All major categories of business equipment advanced in September. The production of transit equipment increased 2.3 percent and was 5.5 percent above its year-earlier level; the output of industrial and other equipment rose 1.2 percent in September, its first monthly gain since June; and the index for information processing equipment edged up 0.1 percent in September following an increase of 1.2 percent in August. The overall index for business equipment in September was 3.7 percent above its year-earlier level.
The output of defense and space equipment rose 0.4 percent in September and was 1.8 percent above its September 2012 level. For the third quarter, the index increased at an annual rate of 4.2 percent.
Among nonindustrial supplies, the output of construction supplies moved up 0.6 percent in September, its fourth consecutive monthly increase, and advanced at an annual rate of 4.8 percent in the third quarter. The production of business supplies rose 0.7 percent in September.
The output of materials to be processed further in the industrial sector increased 0.3 percent in September and advanced at an annual rate of 4.2 percent for the third quarter. The gain in September was due to a 1.0 percent increase in the production of energy materials. For the third quarter as a whole, the index for energy materials moved up at an annual rate of 7.5 percent. The output of durable materials was unchanged in September following a gain of 1.2 percent in August. The production of equipment parts declined 0.2 percent in September, while the output of consumer parts and of other durable materials both edged up 0.1 percent. The production of nondurable materials moved down 0.4 percent in September; the indexes for textile materials and chemical materials both declined, and the index for paper materials was unchanged.
Industry Groups
Manufacturing output edged up 0.1 percent in September and moved up at an annual rate of 1.2 percent in the third quarter. At 96.0 percent of its 2007 average, manufacturing production in September was 2.6 percent above its year-earlier level. The factory operating rate was unchanged in September at 76.1 percent, a rate 2.6 percentage points below its long-run average.
The production of durable goods moved up 0.5 percent in September and advanced at an annual rate of 2.7 percent in the third quarter. The output of motor vehicles and parts increased 2.0 percent in September following a gain of 5.2 percent in August. The index for machinery rose 1.5 percent in September, and smaller increases were recorded in the production of wood products, of primary metals, of aerospace and miscellaneous transportation equipment, and of miscellaneous goods. Declines were recorded in the output of furniture and related products; computer and electronic products; electrical equipment, appliances and components; and nonmetallic mineral products. Capacity utilization for durable goods manufacturing was 76.4 percent in September, a rate 0.6 percentage point below its long-run average.
The output of nondurables decreased 0.3 percent in September, for a third consecutive monthly decline, and edged down at an annual rate of 0.3 percent for the third quarter. The indexes for several nondurable goods categories declined in September, with the largest decrease recorded in printing and support, which moved down 1.1 percent. The production of apparel and leather, of petroleum and coal products, and of plastics and rubber products all rose. Capacity utilization for nondurable manufacturing was 77.0 percent, a rate 3.7 percentage points below its long-run average.
Production in the non-NAICS manufacturing industries (logging and publishing) increased 0.8 percent in September and moved up at an annual rate of 0.8 percent for the third quarter as a whole.
Mining output increased 0.2 percent in September, its sixth consecutive monthly increase. Capacity utilization for mining edged down 0.1 percentage point in September as gains in capacity outpaced the increase in output. At 90.0 percent, the utilization rate for mines was 2.7 percentage points above its long-run average. The output of utilities advanced 4.4 percent in September, and the operating rate for utilities rose 3.4 percentage points to 79.3 percent, a rate 6.9 percentage points below its long-run average.
Capacity utilization rates in September for industries grouped by stage of process were as follows: At the crude stage, utilization decreased 0.2 percentage point to 87.9 percent, a rate 1.6 percentage points above its long-run average; at the primary and semifinished stages, utilization rose 0.7 percentage point to 76.6 percent, a rate 4.4 percentage points below its long-run average; and at the finished stage, utilization edged up 0.1 percentage point to 75.7 percent, a rate 1.4 percentage points lower than its long-run average.
Rebasing of Gross Value of Products SeriesWith this release of the G.17, the comparison base year for the data in Table 9, Gross Value of Final Products and Nonindustrial Supplies, and in Table 10, Gross-Value-Weighted Industrial Production: Stage-of-Process Groups, was advanced to 2009 to conform to the comparison base year of the national income and product accounts issued by the Bureau of Economic Analysis.
Note. The statistics in this release cover output, capacity, and capacity utilization in the U.S. industrial sector, which is defined by the Federal Reserve to comprise manufacturing, mining, and electric and gas utilities. Mining is defined as all industries in sector 21 of the North American Industry Classification System (NAICS); electric and gas utilities are those in NAICS sectors 2211 and 2212. Manufacturing comprises NAICS manufacturing industries (sector 31-33) plus the logging industry and the newspaper, periodical, book, and directory publishing industries. Logging and publishing are classified elsewhere in NAICS (under agriculture and information respectively), but historically they were considered to be manufacturing and were included in the industrial sector under the Standard Industrial Classification (SIC) system. In December 2002 the Federal Reserve reclassified all its industrial output data from the SIC system to NAICS.