
Dodd-Frank Act Stress Test 2014: Supervisory Stress Test Methodology and Results
 Print
Print- Errata
- Executive Summary
- Dodd-Frank Act Stress Testing
- Supervisory Scenarios
Supervisory Scenarios
On November 1, 2013, the Federal Reserve released three supervisory stress-test scenarios: baseline, adverse, and severely adverse.15 This section describes the adverse and severely adverse scenarios that are the basis for the projections contained in this report. These scenarios were developed in a manner consistent with the Board's Policy Statement on the Scenario Design Framework for Stress Testing.16
It is important to note that the adverse and severely adverse scenarios are not forecasts, but rather hypothetical scenarios designed to assess the strength of banking organizations and their resilience to an adverse economic environment. The severely adverse scenario is characterized by a substantial weakening in economic activity across all of the economies included in the scenario. In addition, the scenario features a significant reversal of recent improvements to the U.S. housing market and the euro area outlook. The adverse scenario is characterized by a weakening in economic activity across all of the economies included in the scenario, combined with a global aversion to long-term fixed-income assets that brings about rapid rises in long-term rates and steepening yield curves in the United States and in the four countries or country blocks (the euro area, the United Kingdom, developing Asia, and Japan) represented in the scenario.
Both scenarios include trajectories for 28 variables. These include 16 variables that capture economic activity, asset prices, and interest rates in the U.S. economy and financial markets and three variables (real gross domestic product (GDP) growth, inflation, and the U.S./foreign currency exchange rate) in each of the four countries/country blocks.
Severely Adverse Scenario
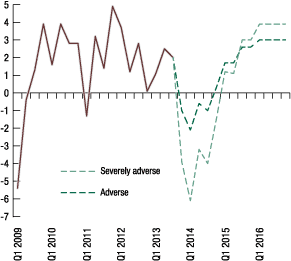
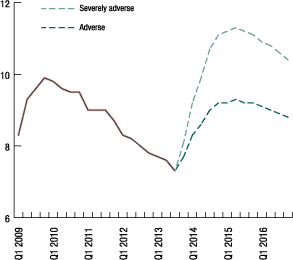
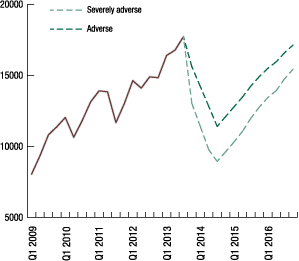
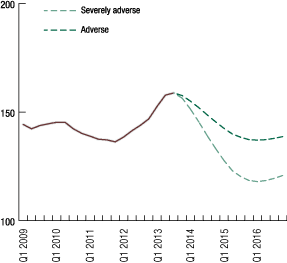
Figures 2 through 6 illustrate the hypothetical trajectories for some of the key variables describing U.S. economic activity and asset prices as well as global economic growth under the severely adverse scenario. As the figures show, real GDP declines nearly 4-3/4 percent between the third quarter of 2013 and the end of 2014; over this period, the four-quarter percent change in the consumer price index (CPI) declines to less than 1 percent before moving back up to 1-1/2 percent from the end of 2015 through 2016. The unemployment rate increases 4 percentage points from the third quarter of 2013, peaking at 11-1/4 percent in the middle of 2015. Equity prices fall nearly 50 percent over the course of the recession, and the equity market volatility index reaches a peak of 68 percent. House prices decline 25 percent during the scenario period, while commercial real estate prices decline nearly 35 percent at their trough. A slow recovery takes hold in 2015, and real GDP expands 2 percent that year and nearly 4 percent in 2016. The international component of the severely adverse scenario features recessions in the euro area, the United Kingdom, and Japan and below-trend growth in developing Asia.
The severely adverse scenario is similar to the 2013 severely adverse scenario. As compared with last year's severely adverse scenario, this year's severely adverse scenario features a larger decline in U.S. house prices, a lower peak U.S. unemployment rate, and a more substantial slowdown in developing Asia and, as a consequence, Japan.
Source: Bureau of Economic Analysis and Federal Reserve assumptions in the supervisory scenarios.
Source: Bureau of Economic Analysis and Federal Reserve assumptions in the supervisory scenarios.
Source: Dow Jones and Federal Reserve assumptions in the supervisory scenarios.
Source: CoreLogic (seasonally adjusted by Federal Reserve) and Federal Reserve assumptions in the supervisory scenarios.
Figure 6. Real GDP growth in four country/country block areas in the severely adverse scenario, Q1 2009-16
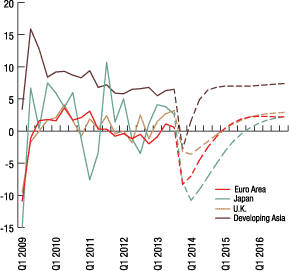
Note: 3Q 2013 data based on Federal Reserve calculations using available data as of October 25, 2013.
Source: Federal Reserve calculations based on official sector sources and Federal Reserve assumptions in the severely adverse scenario.
Adverse Scenario
Figures 2 through 5 and 7 illustrate the hypothetical trajectories for some of the key variables describing U.S. economic activity and asset prices as well as global economic growth under the adverse scenario. As the figures show, the level of real GDP declines approximately 1 percent between the third quarter of 2013 and the end of 2014; over this period, the unemployment rate rises to 9-1/4 percent. There is an initial slowing in CPI inflation before it picks up and returns to 2 percent by the middle of 2015. Equity prices fall 36 percent by the middle of 2014 and the equity market volatility index doubles from its third-quarter 2013 level to 35 percent at the start of the scenario. House prices and commercial real estate prices decline approximately 10 percent and 20 percent, respectively, before stabilizing and starting to rise in early 2016. A slow recovery begins in 2015, with GDP rising 2 percent that year and nearly 3-1/4 percent in 2016.
Reflecting the weaker economy, short-term interest rates remain near zero over the scenario period. An assumed aversion to long-term debt instruments results in a sharp increase in the yield on the long-term Treasury bond to 5-3/4 percent by the end of 2014. With short-term interest rates flat, this increase results in a steepening of the yield curve of approximately 300 basis points by the end of 2014.
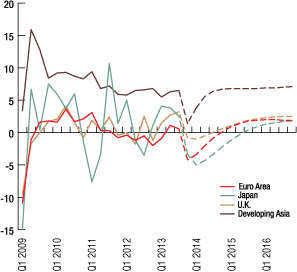
Note: 3Q 2013 data based on Federal Reserve calculations using available data as of October 25, 2013.
Source: Bureau of Economic Analysis and Federal Reserve assumptions in the adverse scenario.
Global Market Shock and Counterparty Default Component
The stress test results for six BHCs with large trading and private-equity exposures include the effect of a global market shock on the value of these positions in the adverse and severely adverse scenarios.17 In addition, the results of the same six BHCs and two other BHCs with substantial trading or custodial operations include the losses that may arise from the default of the BHC's largest counterparty (counterparty default component) in the adverse and severely adverse scenarios.18 Under the counterparty default component, the global market shock extends to BHCs' counterparty exposures to project potential losses from the default of their largest counterparty.19 The Federal Reserve published the global market shocks for the adverse and severely adverse scenarios on November 12, 2013; the as-of date for positions and exposures for the global market shock and the counterparty default was October 16, 2013.
The global market shock is a set of one-time, hypothetical shocks to a broad range of risk factors. Generally, these shocks involve large and sudden changes in asset prices, rates, and spreads, reflecting general market stress and heightened uncertainty.20
The global market shock for the severely adverse scenario is built around four key themes. First, globally, government and sovereign yield curves undergo marked shifts in level and shape. In most advanced economies, long-term rates rise sharply while short-term rates remain essentially unchanged. In emerging economies and peripheral euro economies, both short-term and long-term rates rise. Second, spreads on emerging market sovereign and corporate bonds widen, reflecting credit shocks that are more severe than those experienced during the second half of 2008. Third, the euro area experiences a credit crisis, manifested by sharp increases in government yields and various credit spreads. Finally, market moves in all other asset classes and risk factors closely mirror the experience of the second half of 2008.
The global market shock for the adverse scenario consists of market moves that are, by and large, similar in structure but not as severe as those assumed in the severely adverse scenario.
References
15. See Board of Governors of the Federal Reserve System (2013), "2014 Supervisory Scenarios for Annual Stress Tests Required under the Dodd-Frank Act Stress Testing Rules and the Capital Plan Rule" (Washington: Board of Governors, November 1), www.federalreserve.gov/newsevents/press/bcreg/20131101a.htm for additional information and for the details of the supervisory scenarios. Return to text
16. 12 CFR part 252, appendix A. Return to text
17. See 12 CFR 252.44(b); see also 12 CFR 252.54(b)(2)(i). Return to text
18. On September 30, 2013, the Federal Reserve notified eight BHCs with significant trading or custodial operations that they would be subject to a counterparty default component. Under the Dodd-Frank stress testing rule, within 14 calendar days of receipt of the notification, the BHCs may request in writing that the Board reconsider the requirement that the BHC include additional components or additional scenarios in its stress test, and the Board will respond to the BHC in writing within 14 calendar days of receipt of the BHCs request. Return to text
19. The largest counterparty is selected based on the net stressed exposures across derivative and securities financing transactions. Net stressed exposures are calculated by revaluing exposures and collateral using the global market shock. Return to text
20. See www.federalreserve.gov/bankinforeg/CCAR-2014-Severely-Adverse-Market-Shocks-data.xlsx and www.federalreserve.gov/bankinforeg/CCAR-2014-Adverse-Market-Shocks-data.xlsx. Return to text
