FEDS Notes
August 13, 2018
Are Income and Credit Scores Highly Correlated?
Rachael Beer, Felicia Ionescu, and Geng Li1
1. Introduction
Credit scores, a numerical indicator constructed to predict borrowers' credit risk, represent a crucial element of a person's financial life and are used extensively in loan underwriting and pricing. On average, consumers with higher credit scores tend to have easier access to credit and more favorable terms on the loans they take. Given their broad effects on household financial well-being, it is important to understand how consumers' credit scores are correlated with their socioeconomic characteristics, in particular income.
Notably, some recent research argued that income and credit scores are highly correlated. For example, Albanesi, De Giorgi, and Nosal (2017) argue that there is a strong positive relationship between credit scores and income and that, after controlling for age, income is the most important determinant of variations in credit scores. A high level of income–credit score correlation would suggest that most of the variabilities of consumer credit risks are income related, and income can serve as a reasonable approximation for credit scores. High correlations between income and credit scores would also imply that the rising income inequality observed in past decades will lead to widening disparities in credit access, which, in turn, may further exacerbate inequality in consumption and welfare.
In principle, income may affect credit scores in two potential ways. First, income and credit scores will be correlated if income is directly used in credit scoring models. However, previous research and disclosures of model developing agencies indicate that credit scores are estimated using information such as debt payment history, level of indebtedness, length of the credit history file, and credit limit utilizations. Income, by contrast, is not included in the scoring model algorithms. Second, income and credit scores will be correlated because the former is correlated with factors used in estimating the latter. For example, households with higher levels of income would, all else being equal, have a higher ability to repay debt.
To the best of our knowledge, statistical analysis on the relationship between income and credit scores using proper data remains scant. Using a unique proprietary data set, this note attempts to fill the gap in our understanding of this relationship. Our analysis indicates only a moderate correlation between income and credit scores. In a linear regression context, while the estimated coefficient of income in a model projecting credit scores is positive and statistically significant, income's explanatory power, as measured by changes in R-squared (R-sq.), is more modest. Furthermore, we show that the credit score distributions of high- and low-income consumers are both widely dispersed, confirming the notion that income is not a strong predictor of credit scores, or vice versa. Indeed, in most of the loan underwriting process, lenders collect income information in addition to loan applicants' credit scores.2
2. Data Description
Data that include both consumer credit scores and income information are rare. This data scarcity is partly because credit scoring models do not include income. We use the Mintel/Comperemedia data (the Mintel data henceforth) that provide a unique combination of credit scores and survey-based income data for the same consumers. The Mintel data set is a monthly proprietary survey of credit card offers, with about 2,500 consumers selected to participate in the survey each month. Participants of the Mintel survey have very similar educational attainments and income to other nationwide representative household surveys, such as the Survey of Consumer Finances. The Mintel sample, however, has a somewhat higher average age and greater share of white consumers.
Each participating consumer is given a set of envelopes and asked to put mail from an array of sectors that Mintel monitors, including credit card offers, into the envelopes and send them back to Mintel weekly during the participating month. Mintel digitizes the information in these offers and forwards it to TransUnion, one of the three major U.S. credit reporting agencies, where survey participants' credit histories, including their VantageScore 2.0 credit scores, are merged in.3 Our analysis focuses on the correlation between household income and this particular credit score product. In addition, Mintel collects demographic and socioeconomic data from the survey participants, including marital status and household income, through a separate questionnaire.4
We keep only the individuals whose credit score information is merged in by TransUnion. Our data span over 10 years, from January 2007 to December 2017, and include about 215,000 observations. While the Mintel data offer a unique opportunity to look into the relationship between income and credit scores, there are two limitations of this data set. First, the income data are collected at the household level, not at the individual level--but we observe credit scores for individual consumers. To address this concern, we run a robustness analysis using a subsample of single consumers to match the credit score and income information of the same individuals. Second, the income data in the Mintel sample are reported in discrete, categorical values. Instead of the exact dollar value of income, the respondents report their income as one of 18 brackets, ranging from "below $7,500" to "above $200,000." Typical groups are defined as "$10,000–$12,499" or "$70,000–$74,999," with lower-income groups defined over narrower ranges. We use the mean of each income group as an approximation of income levels.5 Doing so, we lose variations of income within each group as defined in the Mintel data. We quantify such within-group variations relative to overall income variations using survey data that include exact values of income, such as the Panel Study of Income Dynamics and the Survey of Consumer Finances. We find that replacing exact income values with respective bracket means lead to only a modest reduction in overall cross-sectional variations of income--about 5 percent lower standard deviations. Excluding consumers with household income over $200,000 results in a sample of about 215,000 observations from unique individuals over the 11 years of our sample.
3. Results
Correlations between Credit Scores and Income
Table 1 reports the estimated correlation coefficients between income and credit scores. As shown in column (1), we find a low correlation between credit score levels and income, with the correlation coefficient around 0.27 for income levels and 0.29 for log income. Relatedly, the R-sq. of the linear regression model Score = α + β Log(Income) + ε is about 0.08 (not shown). Further, allowing for a more flexible nonlinear specification of income in the above equation does not materially boost the R-sq. Credit scores are designed to reflect the relative position of a consumer in the credit risk distribution. Accordingly, we also estimate the correlation between income and the percentile of credit scores (column 2) and the Spearman rank correlation (column 3). These estimated correlation coefficients are slightly larger than those in column 1, but all are below 0.3.
Table 2 presents the estimated correlations between credit scores and income within various subpopulations. To begin with, we study whether the correlation differs between prime-age (65 years old and below) and older (above 65 years old) consumers. Most consumers older than 65 are retired, and their current income may not be closely associated with their financial resources, ability to repay debt, and credit risks. Indeed, as shown in column 1 of the table, the income-credit score correlation among younger consumers, though it remains moderate, is appreciably higher than that among older consumers.6
Columns 2 and 3 contrast the log income-credit score correlation between single and married consumers. As mentioned, the Mintel data collect income information for households, not for individual consumers. Therefore, it is possible that the income-credit score correlation among single consumers is different compared with that among married consumers. However, our estimates indicate that, regardless of consumer ages, the correlation among single consumers is similar to that among married consumers.
Columns 4 and 5 compare the correlations between consumers with and without college degrees. Interestingly, the correlation among consumers with college degrees is higher for the entire sample but lower for each age subsample, though none of the differences in the correlation coefficients is particularly large. Finally, columns 6 and 7 compare the estimated log income-credit score correlation in the two subsample periods--2007-12 and 2013-17. For the entire sample, the correlation in the second half of the period is somewhat higher; however, the gaps for each age group are smaller.
Table 1: Correlations of Vantage Score and Income
|
Vantage Score 2.0 (1) |
Vantage Score 2.0 Percentile (2) |
Spearman Rank Correlation (3) |
|
|---|---|---|---|
| Income | 0.269 | 0.282 | 0.291 |
| Log Income | 0.290 | 0.295 | 0.291 |
Table 2: Log Income–Credit Score Correlations in Subpopulations
| Whole Sample | Marital Status | Educational Attainment | Sample Period | ||||
|---|---|---|---|---|---|---|---|
|
(1) |
Single (2) |
Married (3) |
College degree (4) |
No college degree (5) |
2007-12 (6) |
2013-17 (7) |
|
| All ages | 0.290 | 0.273 | 0.266 | 0.279 | 0.246 | 0.276 | 0.312 |
| 65 and younger | 0.380 | 0.357 | 0.363 | 0.313 | 0.357 | 0.388 | 0.370 |
| 66 and older | 0.270 | 0.256 | 0.225 | 0.217 | 0.249 | 0.268 | 0.282 |
Additional Explanatory Power of Household Income
Credit scores are estimated exclusively using information available from one's credit history. In theory, adding income information to the true credit scoring models should not boost the model's explanatory power. However, credit scoring models are typically proprietary and use a large number of variables and interaction terms. Here we study, in a parsimonious linear model where credit scores are projected on a small number of key credit history variables, how much additional explanatory power household income may have. Specifically, we estimate the following model,
with and without including the Log(Income) term. In the equation above, Z is a vector of selected credit history variables that include the log of total debt balances; the log of total revolving credit limits and balances; revolving credit utilization ratios; age of credit history; dummies of having recent delinquent accounts, ever having delinquent accounts, and having bankruptcy or other derogatory flags; and the number of credit inquiries over the most recent 24 months.
As shown in table 3, the model that does not include household income, despite its relative parsimoniousness, has an R-sq. near 0.8. Adding log income to the model, while the coefficient is estimated to be statistically significant (not shown), does not materially increase the R-sq. of the model. Estimating the model using different subpopulations as presented in table 2 leads to similarly modest increases of R-sq.
Table 3: Explanatory Power of Household Income
| (1) | (2) | |
|---|---|---|
| Log income | No | Yes |
| Credit attributes | Yes | Yes |
| R-sq. | 0.796 | 0.800 |
Within-Income Group Dispersion of Credit Scores
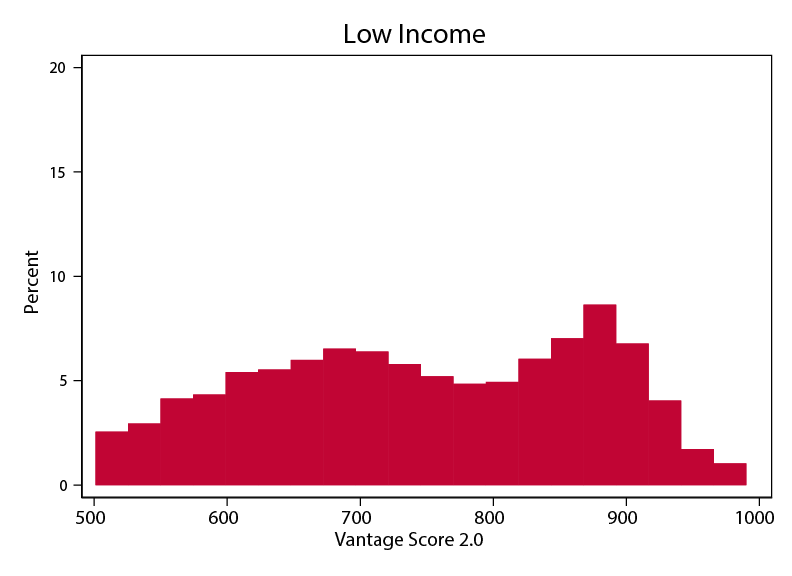
Lastly, we present credit score dispersion within the same income group to illustrate the limited power of using household income to predict credit scores. Figure 1 presents the histograms of credit scores of high-, middle-, and low-income households, each representing roughly one-third of the sample. As shown in the three panels, credit scores are distributed over the entire support for all three income groups, and, apart from the distribution of the high-income group having a larger mass at the high end of the distribution support, the shapes of the histograms of high- and middle-income groups are broadly consistent. Indeed, even among the high-income consumers, a significant mass of consumers have credit scores lower than 680, commonly known as "nonprime" or "subprime" borrowers.
Repeating the analysis using the sample of consumers younger than 65 years old, as shown in figure 2, we find that the shapes of the credit score distribution for the high- and middle-income groups are similar. However, a large mass of the credit score distribution of the low-income consumers younger than 65 years old shifts to the left relative to the distribution in figure 1, likely reflecting that many low-income consumers older than 65 have high credit scores. That said, the distribution for the low-income group remains widely dispersed.
4. Concluding Remarks
To summarize, using a unique proprietary data set that includes consumers' credit scores and self-reported household income, we find that household income is moderately correlated with consumers' credit scores, and cross-sectional variations in household income account for a modest fraction of variations of credit scores. The additional explanatory power of income becomes minimal once a small set of credit history variables are accounted for. The limited correlation suggests that the rising income inequality witnessed in recent decades does not mechanically imply rising inequality in credit access through the channel of this particular correlation. Indeed, across U.S. counties, our estimated correlation of within-county credit score dispersion and income Gini coefficients (a frequently used measure of income inequality) is about 0.15, lower than the estimated income–credit scores correlation. Furthermore, our results are in line with and provide empirical support for existing theoretical research on credit scoring. For instance, Athreya, Tam, and Young (2012) find that, in an unsecured credit market with imperfect information, income has only limited signaling power with respect to one's credit risks.
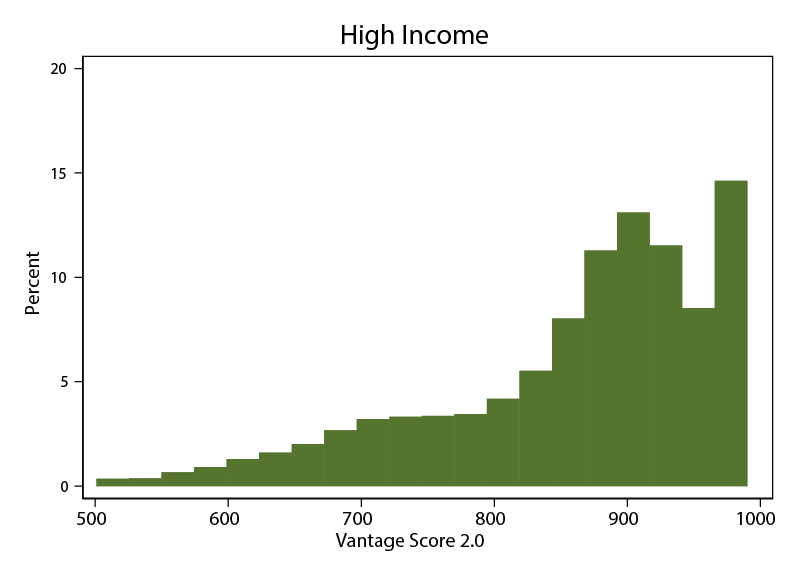
Figure 1b: Credit Score Distributions within Income Groups
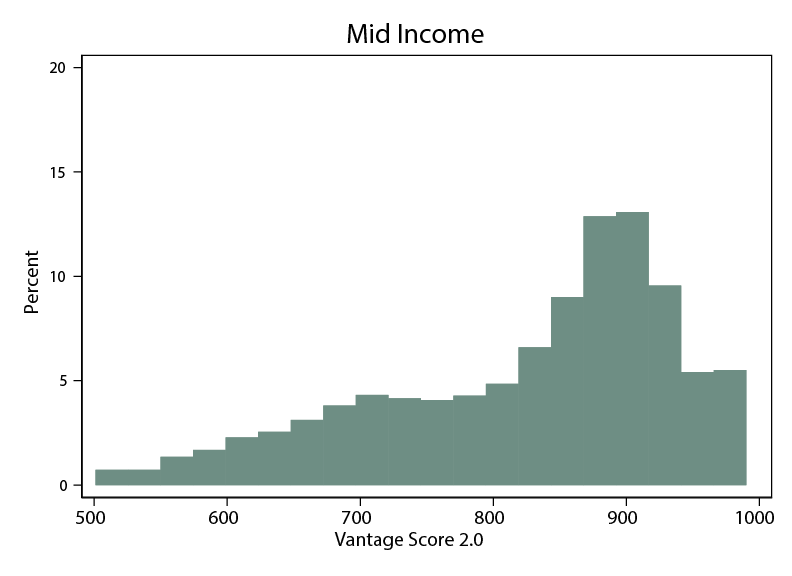
Figure 1c: Credit Score Distributions within Income Groups
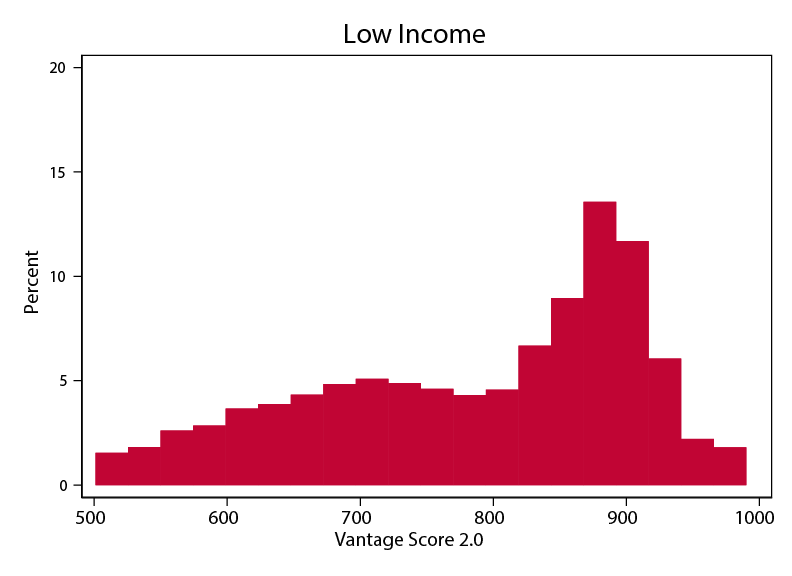
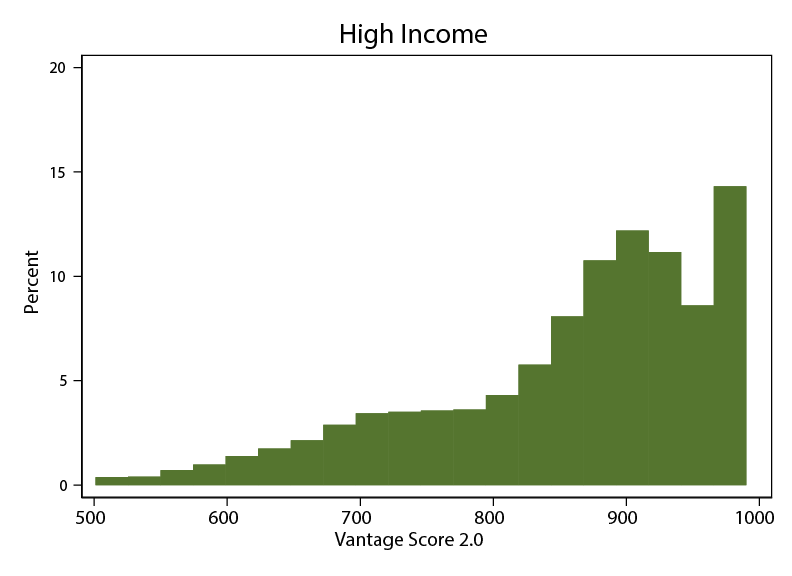
Figure 2b: Credit Score Distributions within Income Groups: Prime-Age Consumers
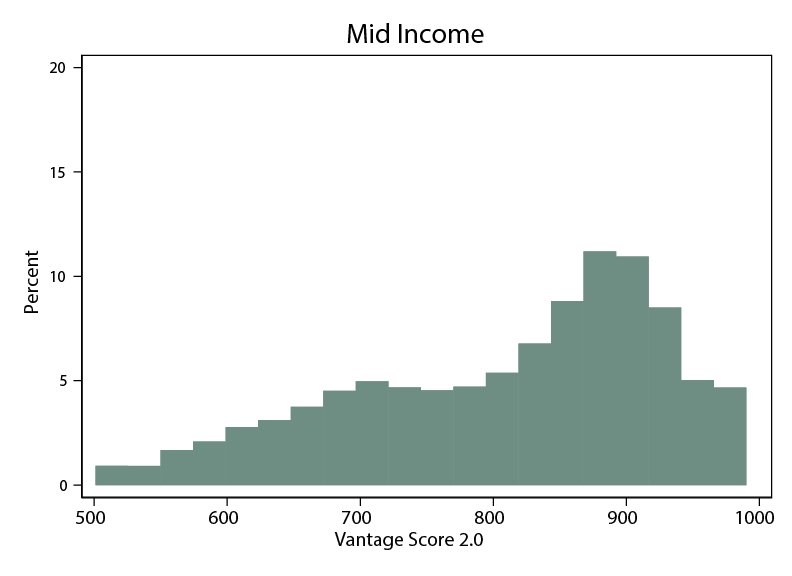
Figure 2c: Credit Score Distributions within Income Groups: Prime-Age Consumers
References
- Albanesi, Stephania, Giacomo DeGiorgi, and Jaromir Nosal (2017). "Credit Growth and the Financial Crisis: A New Narrative," Working Paper, https://www.jaromirnosal.net/uploads/6/0/7/5/60756213/newnarrative_september_2017.pdf.
- Athreya, Kartik, Xuan Tam, and Eric Young (2012). "A Quantitative Theory of Information and Unsecured Credit," American Economic Journal: Macroeconomics, vol. 4 (July), pp. 153–83.
- Han, Song, Ben Keys, and Geng Li (2018). "Unsecured Credit Supply, Credit Cycles, and Regulation," Review of Financial Studies, vol. 31 (March) pp. 1184–217.
1. The research work for this note was done when Rachael Beer was a research assistant at the Federal Reserve Board. The views presented are those of the authors and do not necessarily represent those of the Federal Reserve Board or its staff. Return to text
2. For example, documented income is a main requirement in many mortgage applications. Return to text
3. This credit score product ranges between 501 and 990 and was jointly developed by Equifax, Experian, and TransUnion. Return to text
4. For a more detailed description of the Mintel data, see, for example, Han, Keys, and Li (2018). Return to text
5. We remove consumers with reported income "above $200,000" because the mean of this category is not defined. However, using the mean derived from survey data for household income above $200,000 does not qualitatively change our results. Return to text
6. The income–credit score correlations of more narrowly defined age groups of consumers younger than 65 are similar. Return to text
Beer, Rachael, Felicia Ionescu, and Geng Li (2018). "Are Income and Credit Scores Highly Correlated?," FEDS Notes. Washington: Board of Governors of the Federal Reserve System, August 13, 2018, https://doi.org/10.17016/2380-7172.2235.
Disclaimer: FEDS Notes are articles in which Board staff offer their own views and present analysis on a range of topics in economics and finance. These articles are shorter and less technically oriented than FEDS Working Papers and IFDP papers.