FEDS Notes
November 29, 2018
Breaking Down TRACE Volumes Further
Doug Brain (Federal Reserve Bank of New York), Michiel De Pooter, Dobrislav Dobrev, Michael Fleming (Federal Reserve Bank of New York), Peter Johansson (Federal Reserve Bank of New York), Frank Keane (Federal Reserve Bank of New York), Michael Puglia, Tony Rodrigues (Federal Reserve Bank of New York), Or Shachar (Federal Reserve Bank of New York)
Note: This note was revised on January 10, 2019. The previous version of this post contained a table that incorrectly reported second off-the-run trading volumes of 0.0 for TIPS and FRNs. The table has been corrected to show that these figures are not separately calculated but are instead included in deep off-the-run volumes.
This joint FEDS Note and Liberty Street Economics blog post from staff at the Board of Governors and the Federal Reserve Bank of New York aims to share further initial insights on Treasury cash transactions reported in the Financial Industry Regulatory Authority (FINRA)'s Trace Reporting and Compliance Engine (TRACE). This analysis was conducted within the context of broader work on the Treasury TRACE data from partner agencies in the Interagency Working Group on Treasury Market Surveillance (IAWG).1 Following an earlier joint FEDS Note and Liberty Street Economics blog post that examined aggregate trading volume in the Treasury cash market across venues, this post looks at volume across security type, time since issuance, and maturity. The analysis sheds light on the perception that some Treasury securities--in particular those that are off-the-run--may not trade very actively.2 We confirm that most trading volume is made up of on-the-run securities, especially in venues where the market has become more automated. However, we also find that daily average volume in off-the-run securities is still a meaningful $157 billion (27 percent of overall volume) and also accounts for a large share (41 percent) of trading in the dealer-to-client venue of the market.
Trading Volumes by Security Type
In the earlier note we found overall daily trading volume in the Treasury cash market to average around $575 billion.3 In this note, we disaggregate this overall volume by type of marketable U.S. Treasury security: coupons (comprised of nominal notes and bonds), bills, Treasury Inflation-Protected Securities (TIPS), floating rate notes (FRNs), and Separate Trading of Registered Interest and Principal Securities (STRIPS). Treasury coupons account for the bulk of trading, with a daily average volume of $472 billion or 82 percent of overall volume (see the first column of the table below). Bills are a distant second with a daily average volume of $85 billion or 15 percent of total volume. Daily average volume in TIPS is around $14 billion, 2 percent of total volume, while daily average volumes in FRNs and STRIPS are $1.7 and $2.5 billion respectively, each less than 1 percent of total volume. The share of total daily volume for each security type is little changed over the time period used for this note--August 1, 2017 to July 31, 2018--the same timeframe as was used in the earlier note.
Daily Trading Volume by Security Type across Venues
$ billion
| Security Type | Total | Dealer-to-Client | Dealer-to-Dealer | IDB Electronic/ Automated | IDB Voice/ Manual Screen |
|---|---|---|---|---|---|
| Coupons | 472 | 194 | 30 | 190 | 57 |
| Bills | 85 | 61 | 5.1 | 0.0 | 19 |
| TIPS | 14 | 10 | 0.4 | 0.0 | 3.6 |
| FRNs | 1.7 | 1.5 | 0.0 | 0.0 | 0.2 |
| STRIPS | 2.5 | 2.3 | 0.1 | 0.0 | 0.1 |
| All | 575 | 269 | 36 | 190 | 80 |
Note: All numbers reported are daily averages for the sample of August 1, 2017 to July 31, 2018.
Source: Authors' calculations based on Trade Reporting and Compliance Engine (TRACE) data from the Financial Industry Regulatory Authority (FINRA).
The remaining columns in the table above break down security type volumes further by venue, where we split the interdealer broker (IDB) venue into electronic/automated and voice/manual screen subvenues.4 Overall, the concentration of trading in coupons is most pronounced in the IDB electronic/automated venue, where coupons make up 100 percent of volume. By contrast, bills make up 24 percent of volume in the IDB voice/manual venue and 23 percent of volume in the Dealer-to-Client (DTC) venue.
Trading Volumes for On-the-run and Off-the-run Securities
Next we report trading volumes for on-the-run, and off-the-run securities. An on-the-run security is the most recently auctioned security of a given tenor, with off-the-runs being all the previously issued securities of that tenor (off-the-runs can be broken down further into first off-the-run, second off-the-run, and so forth). As shown in the first column in the table below, daily average trading volume in on-the-run securities is $395 billion, or 69 percent of the $575 billion total. Daily average volume for off-the-run securities is $157 billion or 27 percent of total volume.
Daily Trading Volume by On-the-Run/Off-the-Run Status and Security Type across Venues
$ billion
| On-the-Run/Off-the-Run Status | Security Type | Total | Dealer-to-Client | Dealer-to-Dealer | IDB Electronic/ Automated | IDB Voice/ Manual Screen |
|---|---|---|---|---|---|---|
| On-the-Run | Coupons | 362 | 121 | 23 | 190 | 29 |
| Bills | 25 | 16 | 1.9 | 0.0 | 7.0 | |
| TIPS | 7.0 | 4.4 | 0.2 | 0.0 | 2.4 | |
| FRNs | 0.5 | 0.4 | 0.0 | 0.0 | 0.1 | |
| All On-the-Run | 395 | 142 | 25 | 190 | 39 | |
| Off-the-Run | Coupons | 102 | 69 | 7.1 | 0.0 | 26 |
| Bills | 44 | 33 | 2.7 | 0.0 | 8.1 | |
| TIPS | 6.7 | 5.3 | 0.2 | 0.0 | 1.2 | |
| FRNs | 1.1 | 1.0 | 0.0 | 0.0 | 0.1 | |
| STRIPS | 2.5 | 2.3 | 0.1 | 0.0 | 0.1 | |
| All Off-the-Run | 157 | 111 | 10 | 0.0 | 36 |
Note: Off-the-run numbers aggregate volumes for all off-the-run securities and include all cash management bills. Cash management bills (CMBs) are bills issued outside the regular bill issue and maturity schedule. Numbers do not sum to totals reported in preceding table because when-issued volumes are not reported in this table. All numbers reported are daily averages for the sample of August 1, 2017 to July 31, 2018.
Source: Authors' calculations based on Trade Reporting and Compliance Engine (TRACE) data from the Financial Industry Regulatory Authority (FINRA).
Looking at these volumes by venue across the remaining columns, total off-the-run trading makes up a notable proportion of volume in both the DTC and IDB voice/manual screen venues with 41 and 45 percent shares respectively. The share of off-the-run activity is particularly large for bills in both of these venues. In the IDB electronic/automated venue, trading activity is limited not just to coupon securities, but entirely to on-the-run securities as well.
In the second, third, and fourth rows of the table below, we further divide seasoned securities into first-off-the-run, second-off-the-run, and deep-off-the-run (all other off-the-runs), respectively. For coupons, average daily volume in deep-off-the runs as a group is $64 billion and 14 percent of total coupon volume, as shown in the first column. Deep off-the-run activity for coupons is most pronounced in the DTC and IDB voice/manual screen venues (not shown), accounting for 22 percent and 30 percent of all coupon volumes in those venues, respectively. Also notable is that deep off-the-run securities account for 33 percent of volume for bills and 40 percent of volume for TIPS.
Daily Trading Volume for On-the-Run and Seasoned Securities by Security Type
$ billion
| On-the-Run/Off-the-Run Status | Coupons | Bills | TIPS | FRNs |
|---|---|---|---|---|
| On-the-Run | 362 | 25 | 7.0 | 0.5 |
| First Off-the-Run | 31 | 8.3 | 1.2 | 0.1 |
| Second Off-the-Run | 7.7 | 7.6 | -- | -- |
| Deep Off-the-Run | 64 | 28 | 5.5 | 0.9 |
Note: First and second off-the-run are the first and second securities of a given tenor auctioned immediately before the on-the-run security. Deep off-the-run volume aggregates all other off-the-run securities as well as cash management bills. For TIPS and FRNs, second off-the-run volumes are not separately calculated but are instead included in deep off-the-run volumes. All numbers reported are daily averages for the sample of August 1, 2017 to July 31, 2018.
A previous version of this post contained a table that incorrectly reported second off-the-run trading volumes of 0.0 for TIPS and FRNs. The table has been corrected to show that these figures are not separately calculated but are instead included in deep off-the-run volumes.
Source: Authors' calculations, based on Trade Reporting and Compliance Engine (TRACE) data from the Financial Industry Regulatory Authority (FINRA).
Taken as a whole, these results suggest that trading volumes in off-the-run Treasury securities are economically meaningful and dispersed across a range of security types. The data also indicate that trading by primary dealers, other dealers, and buy-side participants (not shown) accounts for almost the entirety of daily activity in off-the-run securities, with essentially zero estimated off-the-run trading by principal trading firms (PTFs). This is consistent with our previous note, which showed that estimated PTF activity is dominant in the electronic/automated IDB venue--where there is no off-the-run trading--while dealers maintain a prominent role in the Treasury market overall.
Trading Volume by Security Maturity
Security tenor or remaining maturity is the third and final dimension along which we break down trading volume. As shown by the blue bars in the figure below, the most traded on-the-run coupon tenor is the 5-year with around $115 billion average daily volume, followed by the 10-year and 2-year tenors with $93 and $52 billion daily volume, respectively. For off-the-run coupons (the red bars), which fall into broader buckets of remaining maturity, volumes tend to be more evenly distributed across maturities.
Figure 1: Daily Trading Volume for On-the-Run (by Tenor) and Off-the-run (by Remaining Maturity) Coupon Securities
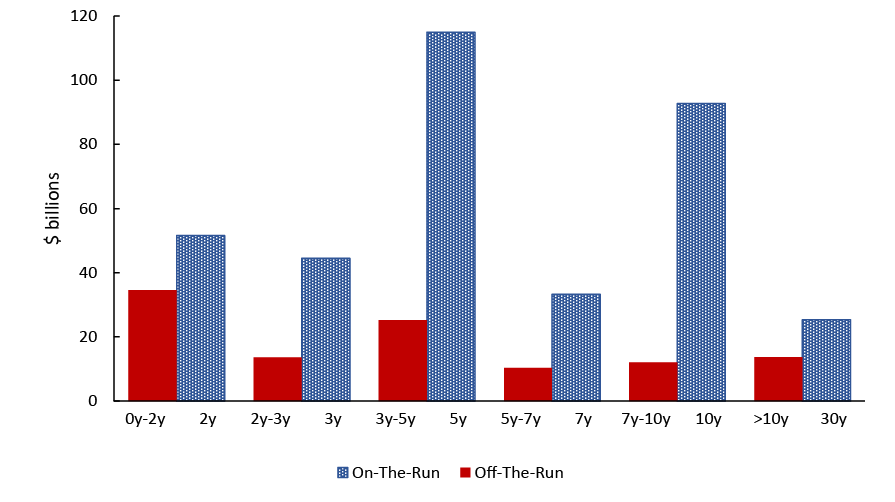
Note: On-the-run volumes are per security whereas off-the-run volumes are aggregated across all securities within a given maturity range. All numbers reported are daily averages for the sample of August 1, 2017 to July 31, 2018.
Source: Authors' calculations based on Trade Reporting and Compliance Engine (TRACE) data from the Financial Industry Regulatory Authority (FINRA).
For TIPS, on-the-run volumes are generally concentrated in the 5-year and 10-year tenors, both with an average daily volume of around $3 billion (not shown). For off-the-run TIPS, there are concentrations of volume around the 3- to-5-year and 7-to-10-year maturity buckets, with volumes of $1.1 billion and $1.6 billion respectively. There is also some concentration of volume in seasoned securities maturing within one year, with an average daily volume of around $1.5 billion. For on-the-run bills, average daily volumes for the 1-, 3- , and 6-month tenors are $9 billion, $8 billion and $6 billion, respectively. One-year on-the-run average daily volume is somewhat lower at just $2 billion.
What More Do We Learn from the TRACE Data?
These insights from the TRACE data across security type, seasoned-ness, and maturity build on earlier findings, including Liberty Street Economics posts from 2013 and 2016 that leveraged FR 2004 data. The TRACE data allow for a more granular view of trading and in particular show that trading activity in off-the-run securities, including deep off-the-run securities, may not be as little as anecdotal commentary has sometimes suggested. This is especially true for the IDB voice/manual screen and DTC venues, into which the official sector and others had only limited visibility prior to the TRACE data. Future research will further investigate the liquidity characteristics of the various securities and venues studied here.
1. Previous IAWG work on these topics includes insights presented by the U.S. Department of the Treasury on November 28, 2017 at the "Evolving Structure of the U.S. Treasury Market Third Annual Conference", see https://www.treasury.gov/press-center/press-releases/Documents/TRACE%20Deck%20Final.pdf. The IAWG's goals are to enhance official-sector monitoring of the Treasury securities market, improve understanding and transparency of this market more generally, while not impeding market functioning and liquidity. Return to text
2. This note does not purport to address the issue of liquidity and is more narrowly focused on trading volumes. Return to text
3. The previous note reported total volume of $574 billion. The number reported here is $1 billion higher due to data revisions, which are common within the data. Volume estimates may also be subject to change due to possible changes in how data are reported in TRACE. Return to text
4. The previous note showed overall volumes were roughly split between the Interdealer-broker (IDB) and Dealer-to-Client (DTC) venues, ($269 billion and $270 billion, respectively) with a relatively small amount of additional volume in the Dealer-to-Dealer (DTD) venue ($36 billion). Please see the previous blog post for further detail on the different venues in the Treasury market. Return to text
Brain, Doug, Michiel De Pooter, Dobrislav Dobrev, Michael Fleming, Peter Johansson, Frank Keane, Michael Puglia, Tony Rodrigues, and Or Shachar (2018). "Breaking Down TRACE Volumes Further," FEDS Notes. Washington: Board of Governors of the Federal Reserve System, November 29, 2018, https://doi.org/10.17016/2380-7172.2299.
Disclaimer: FEDS Notes are articles in which Board staff offer their own views and present analysis on a range of topics in economics and finance. These articles are shorter and less technically oriented than FEDS Working Papers and IFDP papers.