FEDS Notes
September 28, 2018
Unlocking the Treasury Market through TRACE
Doug Brain, Michiel De Pooter, Dobrislav Dobrev, Michael Fleming, Pete Johansson, Collin Jones, Frank Keane, Michael Puglia, Liza Reiderman, Tony Rodrigues, and Or Shachar
This joint FEDS Note and Liberty Street Economics blog post from staff at the Board of Governors and Federal Reserve Bank of New York aims to share initial insights on the Treasury cash transactions data reported to Financial Industry Regulatory Authority (FINRA)'s Trade Reporting and Compliance Engine (TRACE). The Treasury TRACE data initiative is a significant component of a broader inter-agency effort to enhance understanding and transparency of the Treasury securities market. This report focuses on trading volumes in the Treasury cash market.1 The first year of available data point to average daily trading volume in Treasury securities of around $574 billion, with single-day volumes peaking around $1 trillion. The data also confirm that primary dealers continue to play a central role in the market despite the growth of new market participants such as principal trading firms (PTFs).
Treasury TRACE Reporting
The U.S. Treasury market is widely regarded as the deepest and most liquid securities market in the world, playing a critical role in the global economy and in the Federal Reserve's implementation of monetary policy.2 Despite the Treasury market's importance, the official sector has historically had limited access to information on cash market transactions and has been unable to fully measure the market's structure and size. This data gap was most acutely demonstrated in the investigation of the October 15, 2014 flash event in the Treasury market, as highlighted in the Joint Staff Report (JSR). Following the JSR, steps were taken to improve regulators' access to information on Treasury market activity, as detailed in a previous Liberty Street Economics post, with FINRA members beginning to submit data on cash market transactions to TRACE on July 10, 2017 and with over one year's worth of data now available.
The Structure of the Treasury Market3
To inform our approach in analyzing the TRACE data, we model the Treasury market in Figure 1, dividing it into three segments: interdealer broker (IDB), dealer-to-dealer (DTD), and dealer-to-client (DTC). IDBs historically have intermediated trades between dealers. However, after IDBs introduced electronic trading platforms, they also eventually opened up to firms beyond the traditional bank and dealer community, notably PTFs which specialize in electronic and automated intermediation. The DTC space has evolved as well, with request-for-quote (RFQ) platforms enabling clients to solicit bids and offers from multiple dealers electronically. More recently, some PTFs have begun offering direct stream services to dealers, which feature live, continuous, executable prices, delivered electronically under bilaterally negotiated terms.
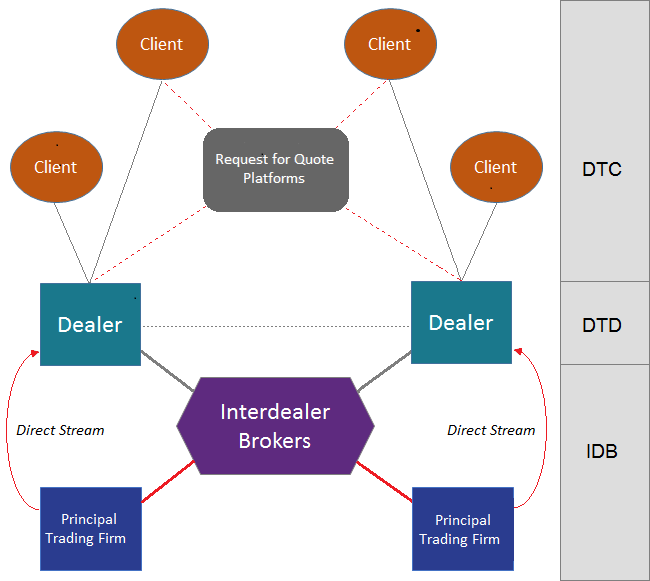
Note: This figure provides a simplified depiction of the structure of the cash Treasury market. DTC, DTD, and IDB denote the dealer-to-client, dealer-to-dealer, and interdealer broker segments of the market, respectively.
Other Treasury Cash Market Transaction Data
Prior to the availability of the TRACE data, the official sector had limited access to information on the Treasury cash market. For example, the JSR offered a brief look at the electronic IDB space but not the voice IDB or DTC segments. The FR 2004 statistical release provides aggregate data on Treasury market trading activity only for primary dealers. In contrast, FINRA's TRACE data provide the official sector with detailed information on intraday transactions on an ongoing basis, covering a very large share of trading activity.
FINRA's TRACE Data Collection
FINRA collects data on Treasury transactions from its registered broker-dealer members through TRACE. FINRA requires its members to report within one day all transactions in marketable U.S. Treasury securities, which includes bills, notes, bonds, floating rate notes (FRNs), inflation-protected securities (TIPS) and Separate Trading of Registered Interest and Principal Securities (STRIPS).4
The reporting obligation applies only to FINRA member firms and since most major broker-dealers and IDBs are members, most domestic Treasury market activity is likely reported into TRACE. Firms that are not FINRA members and that do not report through TRACE include banks, bank branches of dealers, PTFs, and buy-side institutions.
FINRA members report the identity of the counterparty to a trade when the counterparty is also a FINRA member.5 When the counterparty is not a FINRA member, however, the transaction is reported as taking place with an anonymous counterparty. Thus, PTFs, banks, and buy-side clients are mostly anonymous in the data.6
Treasury Market Trading Volume
Over the first year of reporting, daily average Treasury trading volume in TRACE data has been around $574 billion. This volume is roughly split between the IDB and dealer-to-client segments, with relatively little dealer-to-dealer volume (Figure 2).
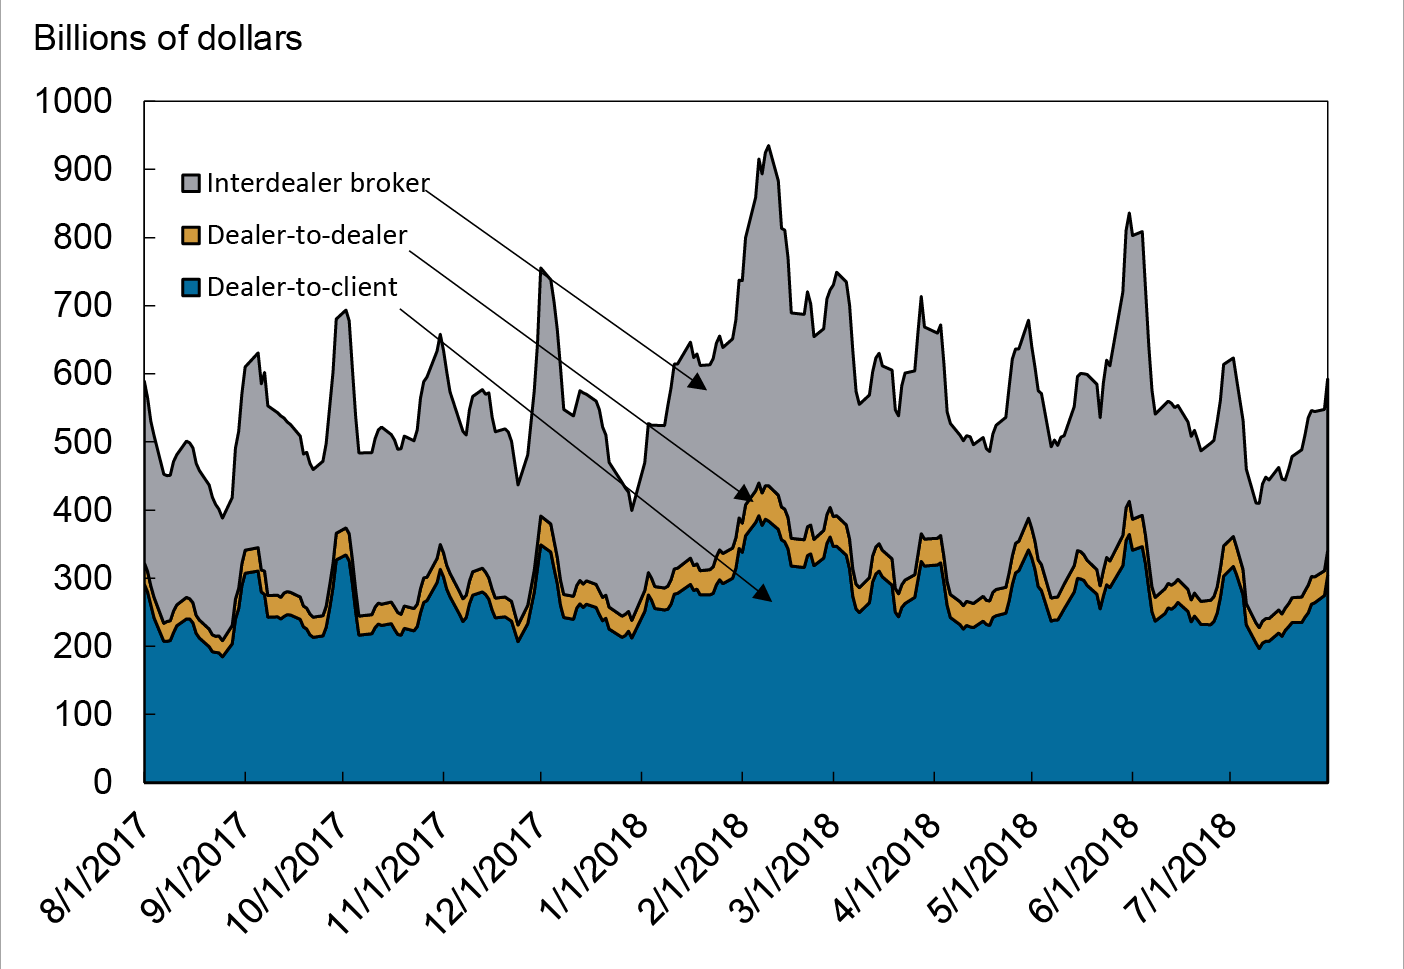
Note: This is a stacked area chart plotting 5-day moving averages of daily trading volume by market segment from August 1, 2017 to July 31, 2018. The calculations require some adjustment of the raw data because trades between FINRA members are reported by both sides and because interdealer brokers, as FINRA members, report both sides of the trades that they intermediate.
Source: Authors' calculations, based on Trade Reporting and Compliance Engine (TRACE) data from the Financial Industry Regulatory Authority (FINRA).
Interdealer-Broker Market Segment
Average daily trading volume in the IDB market segment is about $269 billion, according to the TRACE data. Roughly 70 percent of IDB volume occurs on electronic and automated platforms and 30 percent on voice and manual screen platforms.7 Most PTFs do not submit TRACE reports, yet using assumptions based on the JSR we can approximate PTF activity from reported non-dealer activity in TRACE for the time being.8 We estimate that PTFs account for about 62 percent of electronic/automated IDB trading volume, while primary dealers and other dealers account for about 78 percent of voice/manual screen IDB volume (Table 1). Taking the voice and electronic markets together, primary dealers and other dealers account for about 46 percent of total IDB volume while PTFs account for about 44 percent.9
Table 1: Participant Trading Volume Shares on Interdealer Brokers
| Participant | Electronic/Automated | Voice/Manual Screen | Total |
|---|---|---|---|
| Principal Trading Firm (estimated) | 62% | 1% | 44% |
| Primary Dealers and Other Dealers | 33% | 78% | 46% |
| Buy-side (estimated) | 5% | 21% | 10% |
| Total | 100% | 100% | 100% |
Note: The table reports trading volume shares of the different participant types in the various parts of the interdealer broker market for the August 1, 2017 to July 31, 2018 period. In calculating the shares, principal trading firms (PTFs) are assumed to account for 92 percent of non-dealer trading volume on the electronic/automated interdealer brokers, which is the share of non-dealer activity accounted for by PTFs on BrokerTec reported in the Joint Staff Report from 2014. Buy-side institutions are assumed to account for the remaining 8 percent share. This buy side share is assumed to capture institutions such as hedge funds and investment firms but may also include other financial institutions such as banks. Estimated buy-side activity in the Voice/Manual Screen segment includes any non-FINRA registered PTF activity.
Source: Authors' calculations, based on Trade Reporting and Compliance Engine (TRACE) data from the Financial Industry Regulatory Authority (FINRA).
Dealer-to-Client Market Segment
In the DTC segment, dealers make markets in Treasuries upon request from clients, which include foreign central banks, mutual funds, hedge funds, pension funds, insurance companies and corporations.10 The average daily volume in the dealer-to-client segment is about $269 billion. Primary dealers and other dealers play a more significant role in the DTC segment than in the IDB segment, participating on one side of essentially all trades. It is unclear exactly how much of DTC activity is electronic as it is not identified as such in the data.
Dealer-to-Dealer Market Segment
The DTD market segment is the smallest, with an average daily volume of $36 billion. The DTD segment includes trades in which dealers trade with each other directly, without intermediation from interdealer brokers. Historically, the DTD market has been used by dealers to facilitate large block trades from clients while minimizing information leakage, as well as by smaller dealers to engage with larger dealers for acquiring or divesting inventory or managing risk.
Total Volume by Participant Type
Figure 3 shows trading activity shares across participant types for the Treasury cash market as a whole alongside total trading volume. Primary dealers and other dealers are the largest participant in the market, with about 51 percent share of overall trading activity. PTFs' share is estimated around 21 percent and buy-side firms' share is estimated to be around 28 percent. In general, this distribution of shares has varied little since July 2017, despite fluctuations in daily trading volume.
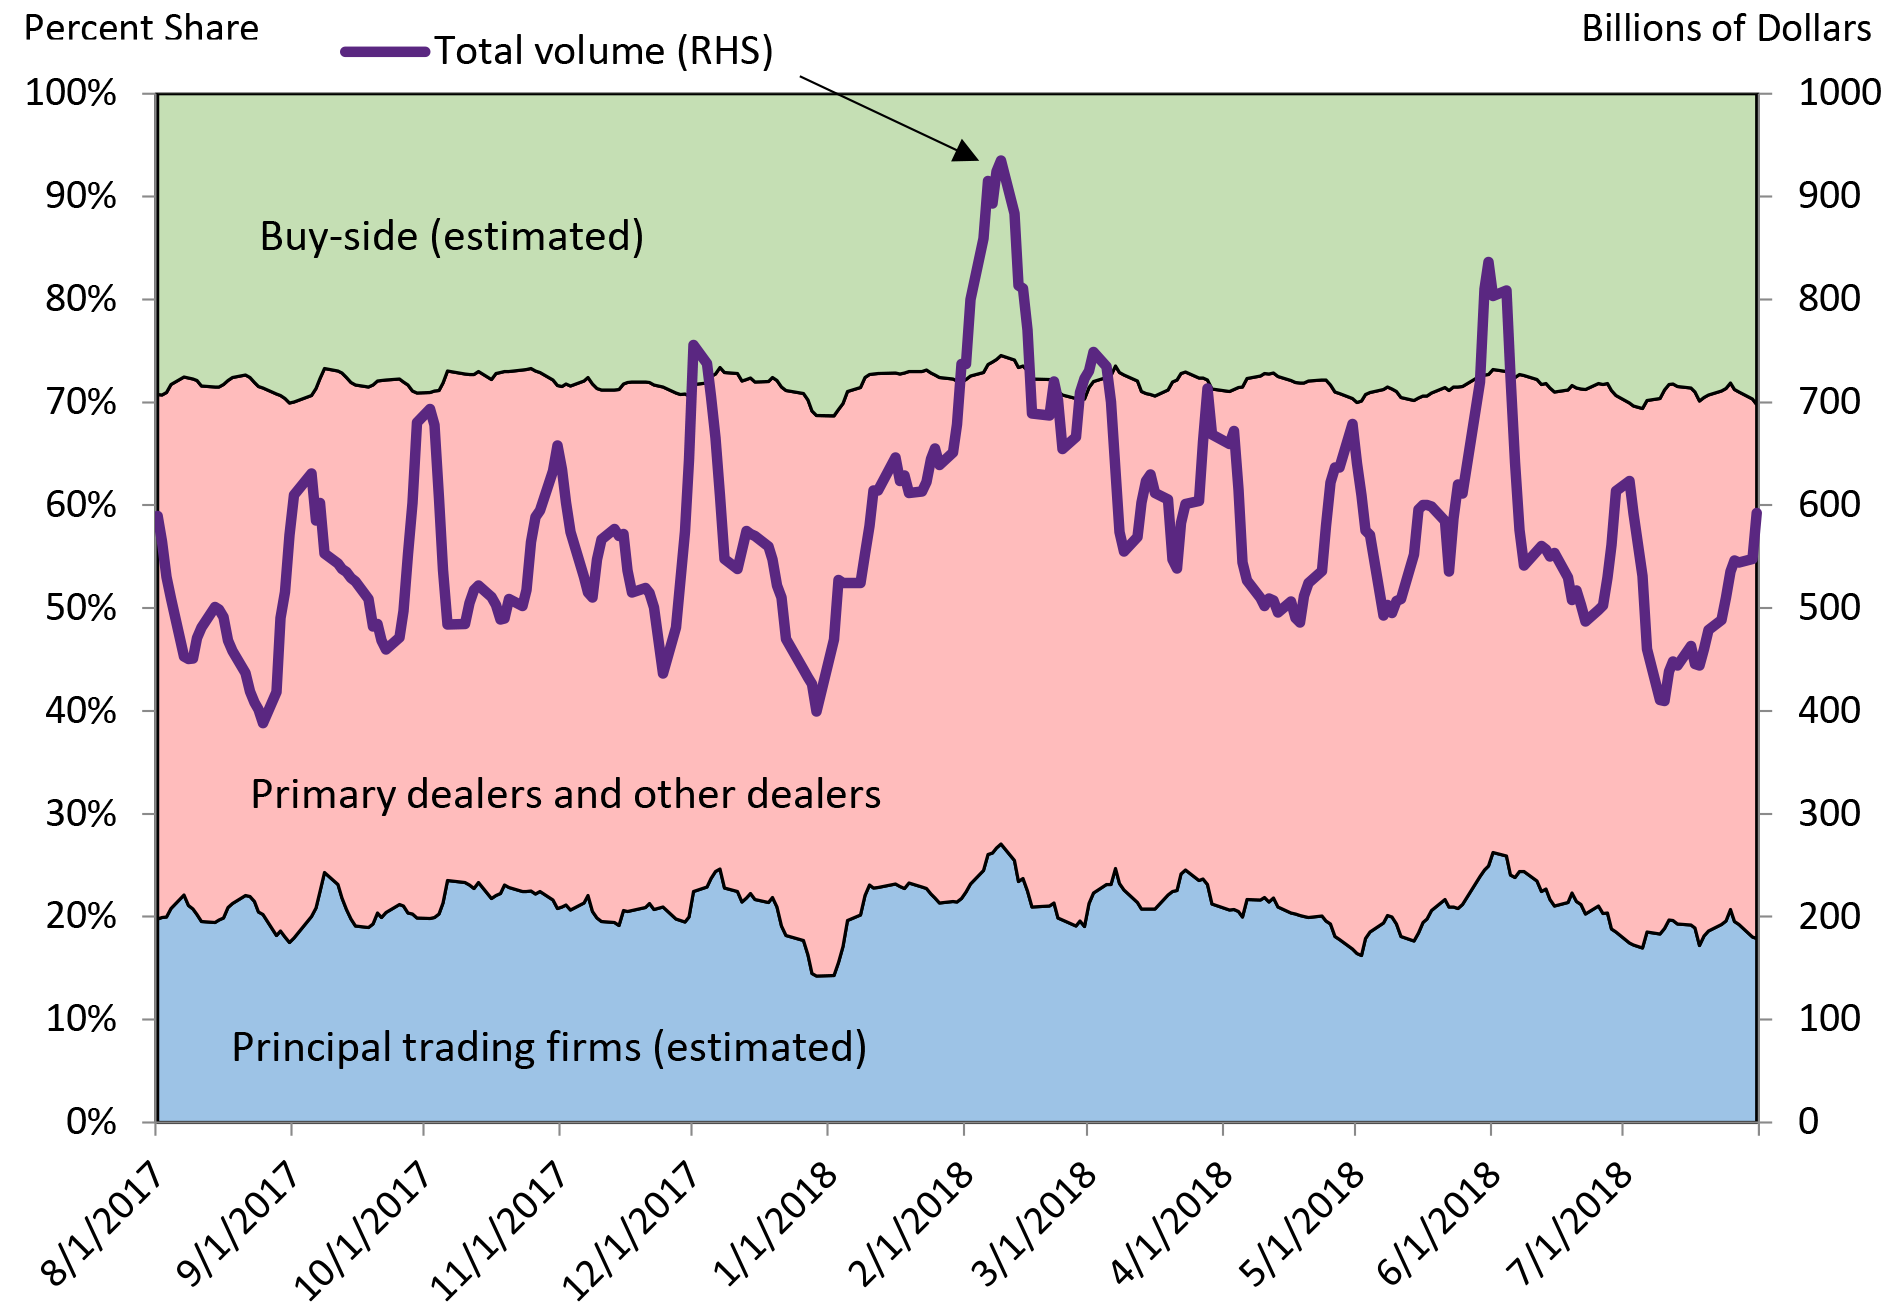
Note: The chart plots 5-day moving averages of daily trading volume shares by participant type and total daily trading volume from August 1, 2017 to July 31, 2018.
Source: Authors' calculations, based on Trade Reporting and Compliance Engine (TRACE) data from the Financial Industry Regulatory Authority (FINRA).
Conclusion
For the official sector, the TRACE data offer new insights into the previously-opaque IDB voice, DTD, and DTC segments of the Treasury cash market. The data confirm the predominant role of primary dealers in the Treasury market, consistent with findings from an earlier Liberty Street Economics post based on FR 2004 data. Although PTFs have established a very large presence in the electronic IDB market, as previously identified in the JSR, their share of the overall Treasury market appears to be smaller than their share of just the electronic IDB market. Voice and manual screen activity continues to be a meaningful part of the IDB segment, and the DTC segment accounts for roughly half the market.
The collection, scope, and analysis of the Treasury transaction data in TRACE is still in its very early stages, and staff at the Board and the New York Fed will continue to conduct analysis and aim to provide insights to the public. Topics for future study may include analysis on volumes across security types, market liquidity, trading activities around notable events, and linkages between Treasury cash market and related markets such as Treasury futures and other interest rate derivatives.
1. This analysis was conducted within the context of other work on the Treasury TRACE data from partner agencies in the Interagency Working Group on Treasury Market Surveillance (IAWG), including insights presented by the U.S. Department of the Treasury on November 28, 2017 at the "Evolving Structure of the U.S. Treasury Market Third Annual Conference", see https://www.treasury.gov/press-center/press-releases/Documents/TRACE%20Deck%20Final.pdf The IAWG's aims are to enhance official-sector monitoring of the Treasury securities market, improve understanding and transparency of this market more generally, while not impeding market functioning and liquidity. Return to text
2. For a more detailed overview, see: https://www.federalreserve.gov/pubs/bulletin/1999/1299lead.pdf Return to text
3. Our focus is the market's structure since roughly 2000. The pre-2000 structure of the market is described here: https://www.federalreserve.gov/pubs/bulletin/1999/1299lead.pdf. The recent evolution of the structure is also discussed in the JSR. Return to text
4. The Treasury leg of a U.S. dollar interest rate swap is reportable to TRACE, whereas auction purchases and repo transactions are not reportable. For more information on TRACE data see: http://www.finra.org/industry/trace/trace-faq#TS Return to text
5. For more detailed information on the TRACE trade reports see: http://www.finra.org/sites/default/files/TRAQS_TS_User_Guide_1_2.pdf Return to text
6. Some PTFs are registered FINRA members and therefore are identified. For a list of FINRA member firms see: https://www.finra.org/about/firms-we-regulate Return to text
7. The voice and manual segment incorporates a variety of types of platforms that incorporate electronic aspects but generally involve manual entry of trades and are in some cases voice assisted. For simplification we use the label "voice" to incorporate these varieties of more manual trade-entry platforms. Return to text
8. Note that the SEC recently approved a rule change proposed by FINRA to require some reporters in TRACE to identify non-FINRA member activity. Once in effect, this will enhance regulators' ability to identify trades with PTFs on IDBs and to more accurately identify the share of overall trading activity attributable to PTFs. Additional information can be found here: https://www.sec.gov/rules/sro/finra/2018/34-83815.pdf. Return to text
9. The higher share of PTF activity reported in the JSR is explained by the report's focus on activity on a single electronic IDB, whereas here we also account for activity on voice IDBs as well as other electronic IDBs. Return to text
10. Activity reported with affiliates is also currently included in DTC volumes. Return to text
Brain, Doug, Michiel De Pooter, Dobrislav Dobrev, Michael Fleming, Pete Johansson, Collin Jones, Michael Puglia, Frank Keane, Liza Reiderman, Tony Rodrigues, and Or Shachar (2018). "Unlocking the Treasury Market through TRACE ," FEDS Notes. Washington: Board of Governors of the Federal Reserve System, September 28, 2018, https://doi.org/10.17016/2380-7172.2251.
Disclaimer: FEDS Notes are articles in which Board staff offer their own views and present analysis on a range of topics in economics and finance. These articles are shorter and less technically oriented than FEDS Working Papers and IFDP papers.