The Federal Reserve Payments Study (FRPS) is an ongoing effort to estimate aggregate trends in noncash payments in the United States, offering a periodic benchmark of developments in the U.S. payments system to policymakers, the industry, and the public.
Latest Data
Released July 2026
National Payment Volumes, Top-Line Data (CY 2015–24)
National Estimates, Latest Figures
Figure 1. Trends in noncash payments, by value, 2000–24
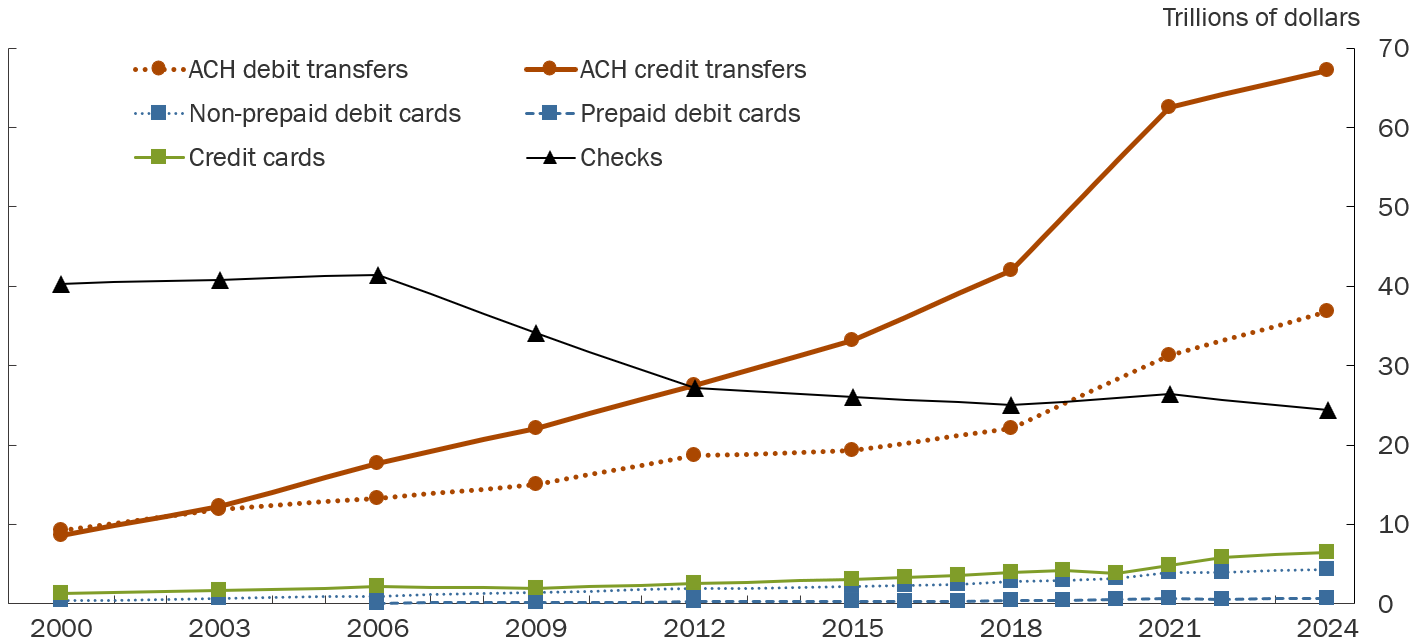
Note: Markers indicate years for which data were collected and estimates were produced; lines connecting markers are linear interpolations. Credit cards include general-purpose and private-label cards. Prepaid debit cards include general-purpose, private-label, and electronic benefits transfer (EBT) cards.
Source: Depository and Financial Institutions Payments Survey (DFIPS), Networks, Processors, and Issuers Payments Surveys (NPIPS).
Figure 2. Trends in noncash payments, by number, 2000–24
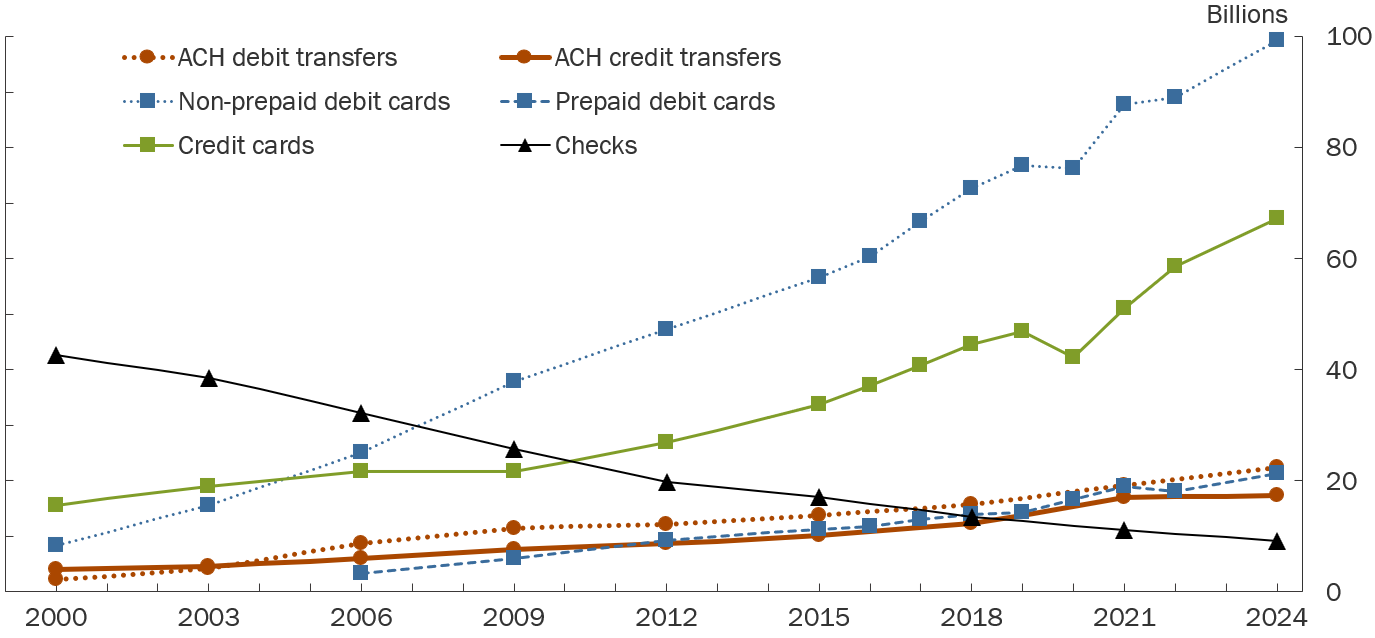
Note: Markers indicate years for which data were collected and estimates were produced; lines connecting markers are linear interpolations. Credit cards include general-purpose and private-label cards. Prepaid debit cards include general-purpose, private-label, and electronic benefits transfer (EBT) cards.
Source: Depository and Financial Institutions Payments Survey (DFIPS), Networks, Processors, and Issuers Payments Surveys (NPIPS).
Contact
For questions, comments, or to be added to the FRPS mailing list, please contact: [email protected].