FEDS Notes
December 22, 2023
Elevated Option-Implied Interest Rate Volatility and Downside Risks to Economic Activity
Measures of uncertainty about U.S. short maturity interest rates derived from options have risen sharply since October 2021, reaching their highest levels in more than a decade. This note first uses survey-based measures of economic uncertainty to argue that this increase in option-implied measures likely reflect higher uncertainty about inflation, the associated monetary policy response, and the perceived resulting downside risks to economic activity. It further shows that increases in implied volatility over the past twenty years have generally been associated with lower future economic activity and larger downside risks.
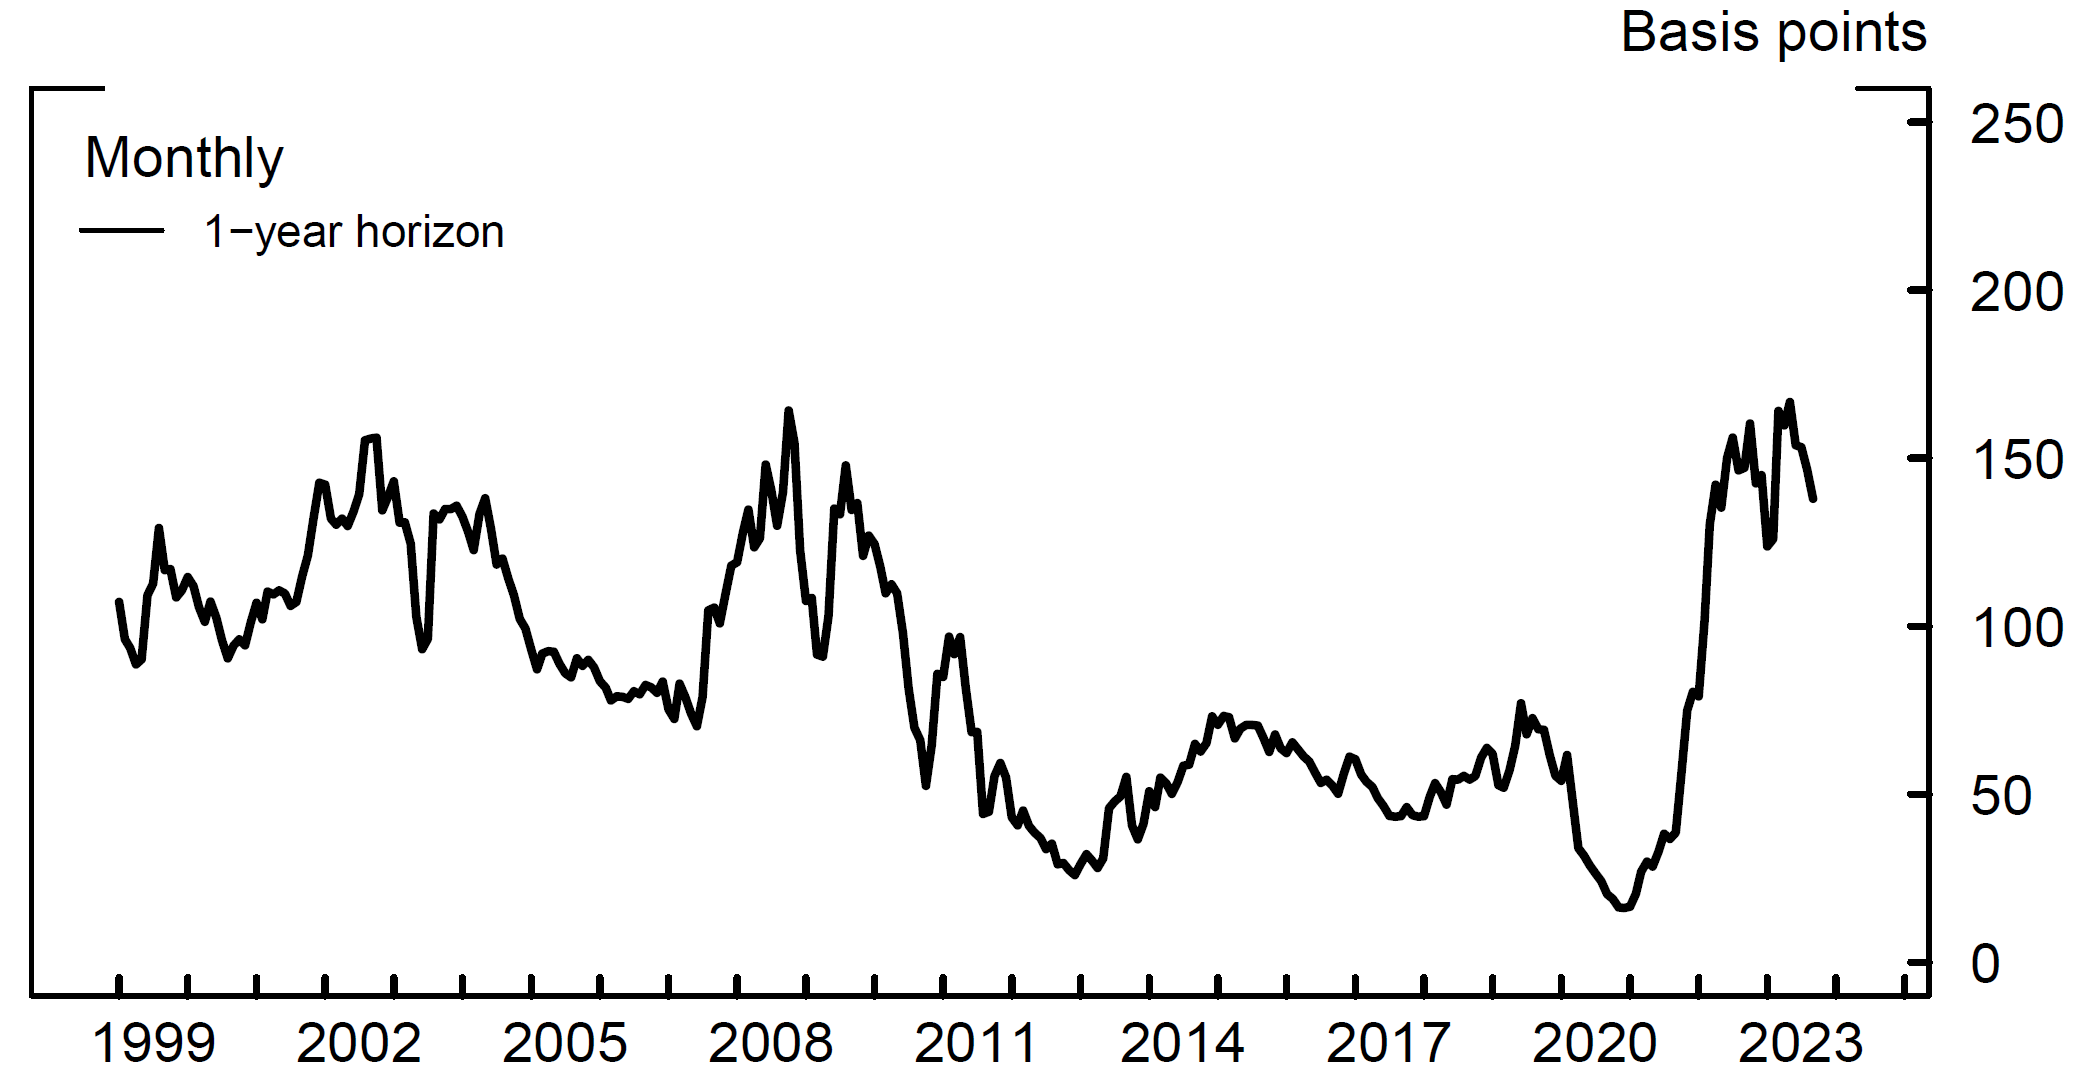
Option-Implied volatilities of interest rates reflect market participants' perceptions of the volatility of an underlying interest rate at a specified horizon. At a horizon of one year ahead, the option-implied volatility of a one-year interest rate (black line in figure 1) rose sharply between late 2021 and late 2022 to the highest levels since the Global Financial Crisis.2 While it has fallen back modestly in recent months, this measure remains around its highest level in more than a decade.
The implied volatility of a one-year interest rate should be closely related to uncertainty about the path of the federal funds rate over the next year. Uncertainty about the federal funds rate should in turn reflect uncertainty about the outlook for the real economy and inflation, as well as the associated monetary policy response. The solid black lines in both the right and left figures of figure 2 show the one-year-ahead implied volatility measure from figure 1 alongside measures of probabilities of negative GDP growth over the next four quarters (dashed blue lines), inflation being lower than 1 percent (dash-dotted purple line on the left), and inflation being higher than 4 percent (dash-dotted red line on the right) over the next year from the quarterly Survey of Professional Forecasters conducted by the Federal Reserve Bank of Philadelphia. Broadly speaking, over the past couple of decades, elevated implied interest rate volatility has tended to occur when the probabilities of low growth and low inflation have both been elevated, such as during the Global Financial Crisis. In contrast, the increase in implied volatility since 2021 has been associated with elevated probabilities of low growth and high inflation. As can be seen on the right in figure 2, the initial spike in implied interest rate volatilities since late 2021 occurred alongside the increase in the perceived probability of inflation being above 4 percent. More recently, it is likely that downside risks to real activity have increasingly contributed to high interest rate implied volatility. Indeed, the survey measure of the probability of inflation being above 4 percent has fallen notably since late 2022, but the implied interest rate volatility has remained elevated. This may reflect the probability of negative growth remaining notably elevated despite some modest lessening in this probability in recent quarters (dashed blue lines).
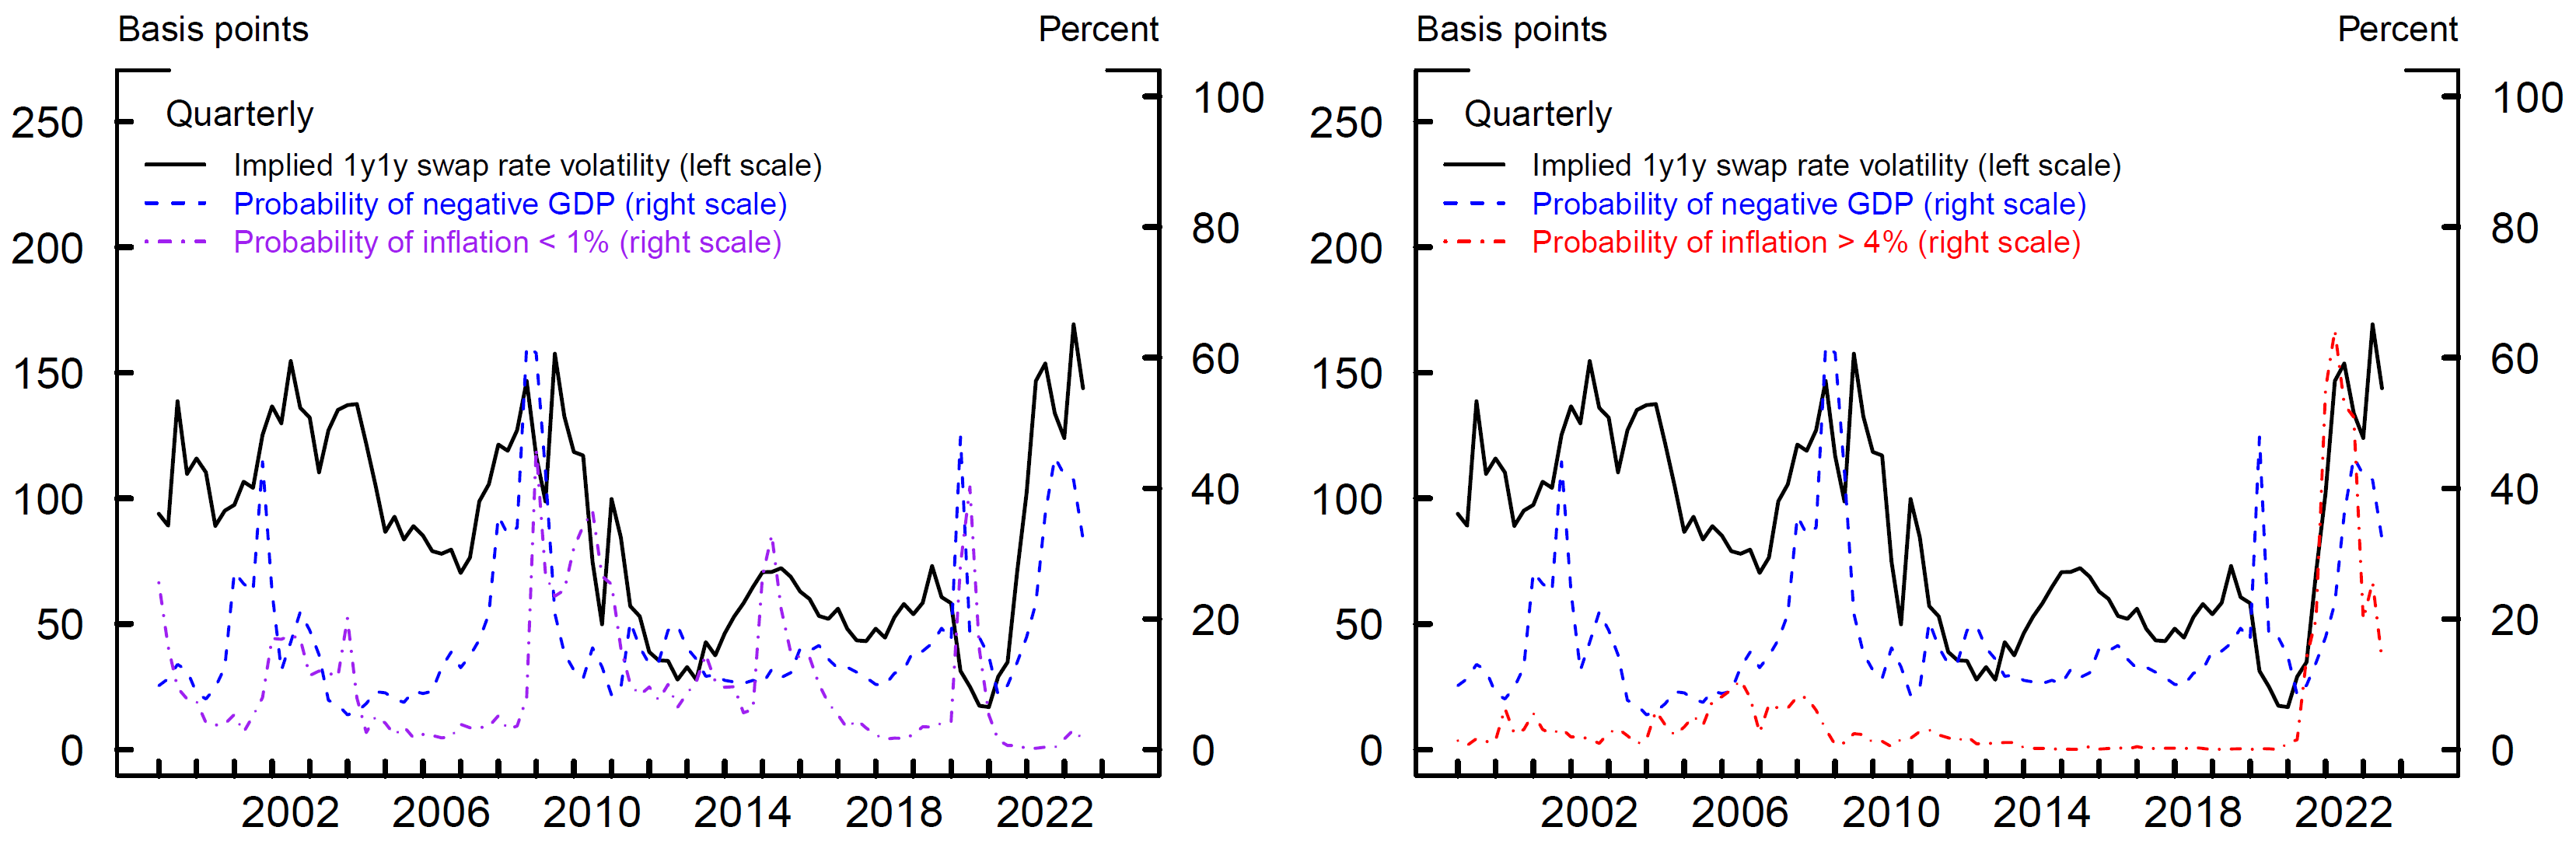
Note: Implied volatilities are the average of the sixth week of each quarter. Data extend through Q3:2023.
Source: Barclays; ICAP; Federal Reserve Bank of Philadelphia, Survey of Professional Forecasters.
Another way to gauge the size of the downside risks to real activity associated with high volatility is to use quantile regressions estimated using historical data. Specifically, I estimate regressions relating the 25th, 50th, and 75th percentiles of the distributions of monthly housing starts one year ahead, expressed as an annual rate; industrial production (IP) growth over the next year; and the one-year-ahead unemployment rate to the implied volatility measure. In the regressions, I also control for various other factors: lags of the variable being modeled; the slope of the yield curve, as measured by the near-term forward spread;3 the level of short-term interest rates, as measured by the 1-to-2-year forward rate;4 and the VIX index of option-implied equity volatility.5 All of the regressions are estimated using monthly data from January 1995 to August 2023.6
Table 1 reports the estimated effects of a 100-basis-point increase in implied interest rate volatility from the regressions on the distributions of the considered variables. Looking first at the results for the 50th percentiles of the distributions, a 100-basis-point increase in implied volatility is associated with a subsequent 256,000 decline in the median annual number of new housing starts, a 3.5 percentage point decline in the year-ahead median IP growth, and a 1.8 percentage point increase in the year-ahead median unemployment rate; all estimates are strongly statistically significant based on bootstrapped standard errors. Some of these estimates seem fairly large; for example, all else being equal, they imply that the 100-basis-point increase in implied volatility since late 2021 would be associated with an increase in the median unemployment rate from 3.6 percent to 5.4 percent.
Table 1: Effects of a 100 Basis Point Increase in Implied Interest Rate Volatility on the Distributions of Various Macroeconomic Variables
| 25th percentile | 50th percentile | 75th percentile | |
|---|---|---|---|
| Housing starts | -593,000*** | -256,000*** | -85,000 |
| IP growth (percentage points) | -9.0*** | -3.5** | -2.2 |
| Unemployment rate (percentage points) | 1.2*** | 1.8*** | 2.8*** |
Note: New privately owned housing starts are expressed as a seasonally adjusted annual rate. Industrial production (IP) growth refers to 12-month percentage changes. */**/*** denotes significance at the 10 percent, 5 percent, and 1 percent levels, respectively.
The regression results also suggest that higher implied volatility is also clearly associated with a wider distribution of future outcomes and higher downside risks to real activity. For housing starts and IP growth, the coefficients for the 25th percentile are significantly negative, whereas the coefficients for their 75th percentiles are closer to zero and insignificant. These results imply that as implied volatility increases the distributions become wider and more skewed to the downside.7 For unemployment, the 75th percentile of its distribution increases by more than the 25th percentile as implied volatility increases, meaning that the distribution of outcomes becomes wider and more skewed toward higher unemployment.
In conclusion, the elevated level of implied volatility since late 2021 likely reflects uncertainty about inflation and the consequences for monetary policy and economic activity. Based on past relationships, increases in implied volatility have been associated with a wider distribution of future outcomes and increased downside risks to economic activity. That said, the fact that current circumstances are different from those seen during most of the previous couple of decades means that one should not overweight the regression estimates when interpreting the current elevated level of implied volatility.
References
Bekaert, Geert, and Eric Engstrom. "Asset return dynamics under habits and bad environment–good environment fundamentals." Journal of Political Economy 125.3 (2017): 713-760.
Berger, David, Ian Dew-Becker, and Stefano Giglio. "Uncertainty Shocks as Second-Moment News Shocks." Review of Economic Studies 87.1 (2020): 40–76
Bloom, Nicholas. "The impact of uncertainty shocks." Econometrica 77.3 (2009): 623-685.
Engstrom, Eric C., and Steven A. Sharpe. "The near-term forward yield spread as a leading indicator: A less distorted mirror." Financial Analysts Journal 75.4 (2019): 37-49.
Giglio, Stefano, Bryan Kelly, and Seth Pruitt. "Systemic risk and the macroeconomy: An empirical evaluation." Journal of Financial Economics 119.3 (2016): 457-471.
1. I thank Colin Campbell and Jared Katz for excellent research assistance, and Dan Covitz, Rochelle Edge, Eric Engstrom, Edith Liu, and Andrew Meldrum for helpful comments and suggestions. Return to text
2. The implied volatilities from LIBOR swaps used in this note closely track those based on SOFR swaps. Return to text
3. The near-term forward spread was proposed by Engstrom and Sharpe (2019) and has been shown to be successful in recession prediction models. Return to text
4. Including the 1-to-2-year forward rate controls for the fact that interest rate volatility tends to fall as short-term interest rates approach the effective lower bound; the increase in interest rates away from the lower bound has likely contributed to the increase in implied volatility since 2021. Return to text
5. See, for example, Bloom (2009), and Berger, Dew-Becker, and Giglio (2020) who analyze macroeconomic effects of equity volatility. Bekaert and Engstrom (2017) develop a model generating realistic properties of equity index option prices and their comovements with the macroeconomic outlook. Return to text
6. The sample start is chosen based on the availability of the implied volatility series. Return to text
7. The results that higher financial volatility is associated with larger downside risks to the real economy is consistent with the findings of Giglio, Kelly, and Pruitt (2016). Return to text
Sarisoy, Cisil (2023). "Elevated Option-Implied Interest Rate Volatility and Downside Risks to Economic Activity," FEDS Notes. Washington: Board of Governors of the Federal Reserve System, December 22, 2023, https://doi.org/10.17016/2380-7172.3404.
Disclaimer: FEDS Notes are articles in which Board staff offer their own views and present analysis on a range of topics in economics and finance. These articles are shorter and less technically oriented than FEDS Working Papers and IFDP papers.