FEDS Notes
August 07, 2023
Europe: Well-positioned to get through next winter without major gas shortages
Following Russia's invasion of Ukraine in early 2022 and resulting international sanctions, natural gas imports from Russia to Europe declined drastically to well below their historical averages (Figure 1). This reduction raised concerns about Europe's energy supply, given its dependence on Russian gas. One question that was prominent last year was whether Europe would be able to get through the winter without significant gas shortages. In the event, Europe weathered the past winter reasonably well, and the energy-related economic costs appear to have been more muted than initially feared. Given this development, the key questions now are: (1) What factors helped Europe manage the last winter without major shortages? and (2) Is Europe now well-positioned to get through next winter as well?
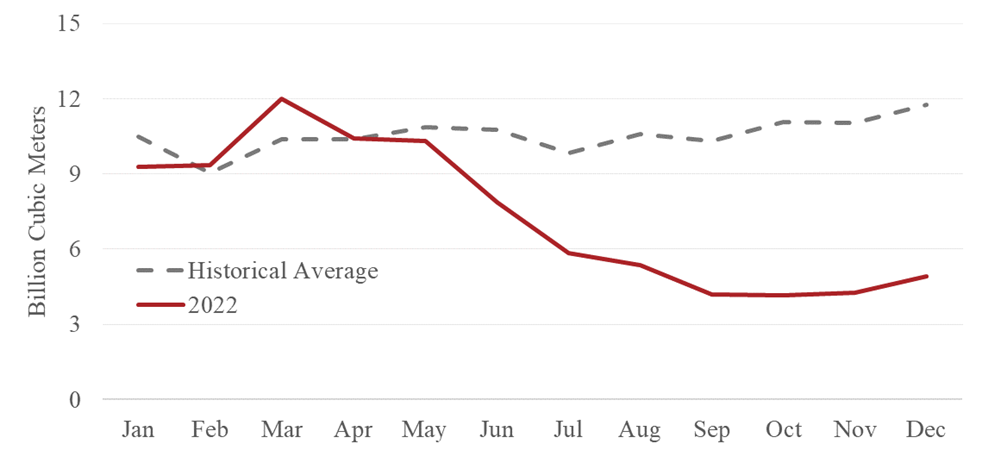
Note: Historical averages for each month are the average values of those months over the period 2015–2021.
Source: European Union, Eurostat, https://ec.europa.eu/eurostat (2023).
To answer these questions, we analyze Europe's natural gas flows starting in 2015 using data from Eurostat on monthly natural gas production, imports, exports, stock changes, and consumption and data from the Aggregate Gas Storage Inventory (AGSI) website of Gas Infrastructure Europe (GIE) on Europe's gas inventories. In this analysis, the Eurostat data end in December 2022, while the AGSI/GIE data are available through June 2023.
Figure 2 compares natural gas flows in the EU in the second half of 2022 with average second-half flows over the years 2015 to 2021. This figure reveals three salient facts about the second half of 2022: First, Europe was able to fully replace lost Russian gas imports with gas imports from other countries. Relative to earlier years, Russian imports declined by about 39 billion cubic meters (bcm) in 2022:H2, and net imports ex-Russia increased by about 44 bcm over the same period. Second, consumption of natural gas declined to below-average levels. Third, as a result of these two features, Europe was able to accumulate natural gas inventories over the second half of 2022, in contrast to the average pattern of seasonal declines in gas inventories typically observed in the second halves of past years.
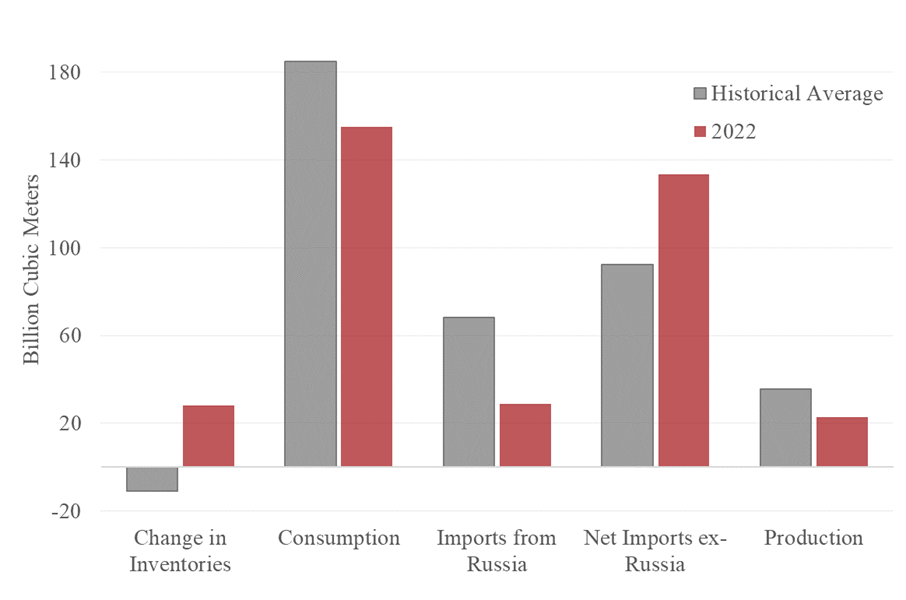
Note: Historical average is calculated using flows from the second half of each year, over the period 2015–2021. The key identifies bars in order from left to right.
Source: European Union, Eurostat, https://ec.europa.eu/eurostat (2023).
European countries were able to successfully replace Russian natural gas by sourcing gas from other countries, both via pipeline and via seaborne imports in the form of liquified natural gas (LNG). Since existing infrastructure was not sufficient to import all the gas needed to replace Russian imports—particularly since existing LNG terminals in Europe were already operating near capacity—several European countries built new infrastructure to increase their import and storage capacity, including LNG plants and floating storage and regasification units. These unprecedentedly fast building efforts appear to have paid off, with Europe fully replacing the decline in Russian gas imports with imports from other countries.
The reduction in gas consumption over the second half of 2022 was, in part, the result of mild winter temperatures. However, gas demand also declined in response to high gas prices and gas-saving efforts, such as substitution toward alternative energy sources, increased energy efficiency, and behavioral changes. These efforts were, at least in part, supported by government policies targeting firms and households—for example, financial incentives to support the purchase and installation of heat pumps to replace gas boilers, subsidies to promote increases in energy efficiency standards for new buildings, and regulation and public education campaigns encouraging consumers and the public sector to implement energy-saving measures such as thermostat adjustments.
How much was the reduction in gas consumption due to the mild temperatures in the 2022-2023 winter? The short answer is "some but not all." By recent historical standards, the second half of 2022 was indeed mild: 2022:H2 had 1,114 heating degree days, which was close to the lower end of the range seen over the period from 2015 to 2021.2,3 To calculate how much the mild winter temperatures helped alleviate the gas constraints in Europe, we ask how much gas Europe would have consumed if temperatures had been at average levels, rather than the actual milder ones. To answer this question, we use 2015 as a benchmark, as it was a similarly mild year—with 1,108 heating degree days in its second half. We then construct a counterfactual, in which we raise monthly gas consumption in 2022:H2 by the difference between 2015–2021 average consumption in each month and consumption in the same month in 2015.
Figure 3 compares natural gas consumption in the EU in the second half of 2022 (red bar) with its historical average (gray bar) and the counterfactual described above (blue bar). We estimate that about half of the reduction in natural gas consumption in the second half of 2022, relative to its 2015–2021 average, can be attributed to luck with the weather. Natural gas consumption was about 30 billion cubic meters lower than average in the second half of 2022 (the difference between the red and gray bars), but if the winter had been average instead of mild, natural gas consumption would have been about 13 billion cubic meters higher than observed (the difference between the blue and the red bars).
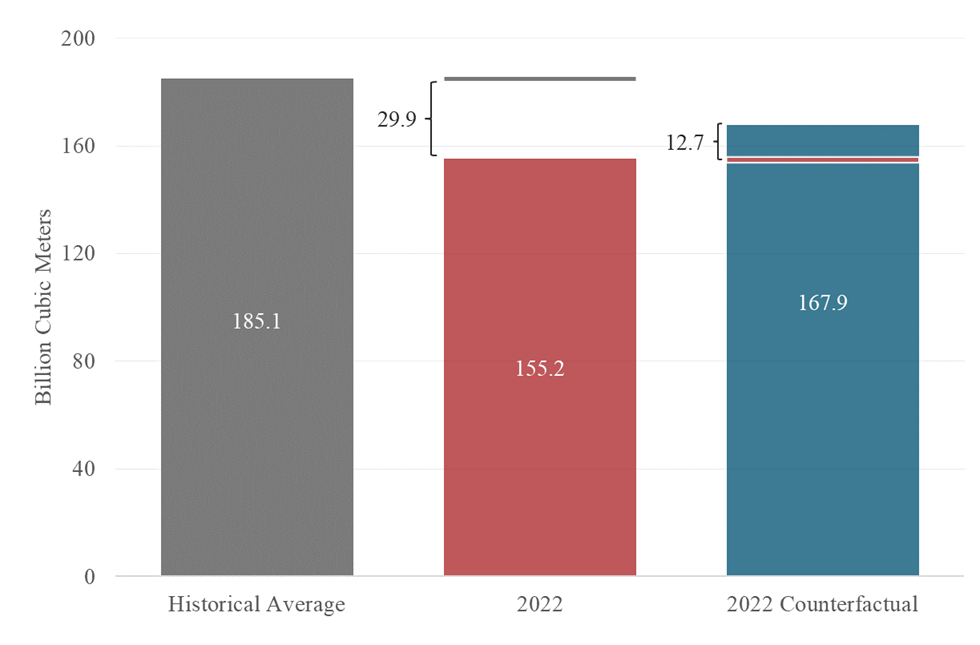
Note: Historical average is calculated using flows from the second half of each year, over the period 2015–2021. The gray solid line represents average second-half consumption over the years 2015 to 2021 ("Historical Average"), and the red solid line represents gas consumption in the second half of 2022 ("2022").
Source: European Union, Eurostat, https://ec.europa.eu/eurostat (2023).
The question now is whether Europe is in a good position to get through next winter without major gas shortages. To answer this question, we consider three scenarios for the one-year period spanning 2023:H2 and 2024:H1. The first scenario ("Baseline") assumes that Europe maintains gas imports from Russia and all other sources at the same average level as in 2022:H2 and that gas consumption in each month is the same as its 2015–2021 average level.4 The second scenario ("Harsh Winter") is the same as the baseline, except that it assumes that next winter will be historically cold and, as a result, gas consumption in each month reaches its maximum 2015–2021 level. The third scenario ("Adverse Scenario") is the same as the baseline, except that it assumes that Europe's imports from non-Russian sources fall back to their 2015–2021 average in each month, while natural gas imports from Russia are the same as in the baseline.
Figure 4 presents end-of-period natural gas inventories in the EU for each of the three scenarios, as well as their 2015–2021 average and an estimate of storage capacity.5 As discussed above, with less than average consumption in 2022:H2, gas imports near their historical average (with gas from other countries replacing lost Russian gas), and additional storage capacity, Europe ended the first half of 2023 with above-average inventories (as can be seen by the solid black line being above the dashed black line over this period). In June 2023, inventory levels were about 40 percent above their 2015–2021 average June level. This puts the region in a good starting position for the year ahead. Indeed, as shown by the solid black and green lines over the period 2023:H2-2024:H1, inventory levels over the next twelve months remain above or very near their historical averages under both the baseline and the harsh winter scenarios. Furthermore, historically EU countries have allowed gas stocks to move all the way down to 20 percent of storage capacity, and gas stocks would remain above this minimum level under both these scenarios.
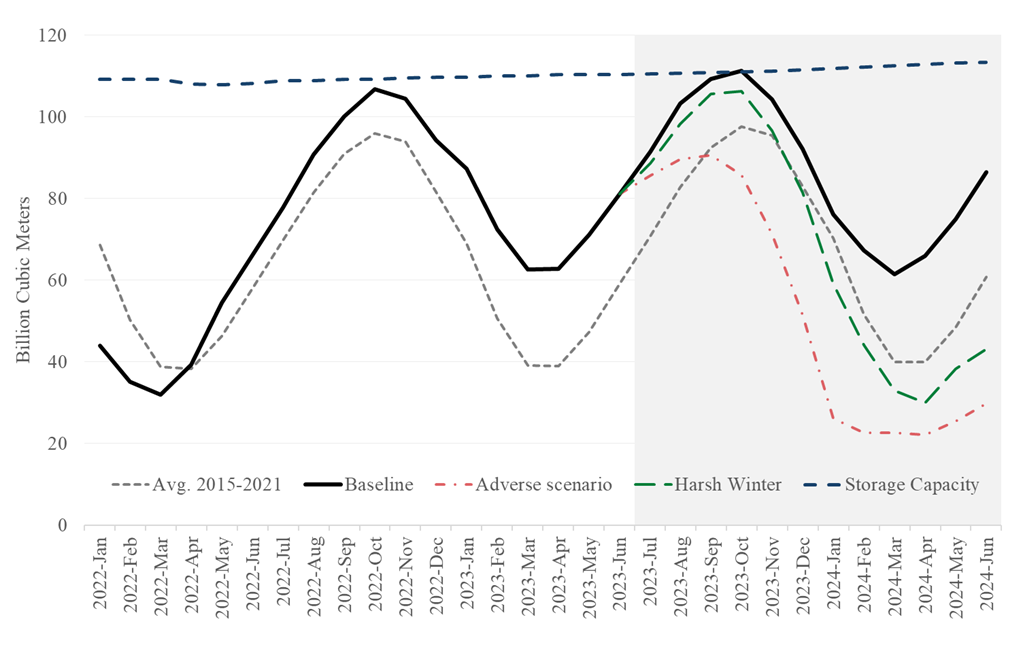
Note: Baseline assumes imports ex-Russia remain at average level of past 6 months and gas consumption at its historical average for each month. Harsh Winter scenario is the same as baseline, but gas consumption is at its maximum historical level in each month. Adverse scenario assumes that some global supply of natural gas is diverted away from Europe (e.g., toward China), reducing Europe's imports ex-Russia back to their historical average in each month.
Source: European Union, Eurostat, https://ec.europa.eu/eurostat (2023) and Gas Infrastructure Europe, Aggregated Gas Storage Inventory, https://agsi.gie.eu/ (2023).
The adverse scenario considers the possibility of Europe being unable to import as much natural gas as in recent months. We assume that an increase in global demand for natural gas causes some of its global supply to be diverted away from Europe—for example, toward China—reducing Europe's gas imports ex-Russia back to their historical average. As a result, Europe is unable to replace the gas that it used to buy from Russia. This is an unfavorable scenario that, as shown by the red line, would imply significantly greater reductions in inventories over the coming winter than the other two scenarios. These low gas inventories would lead to gas shortages and require reductions in gas consumption that could be economically costly.
To conclude, this analysis shows that, while Europe is in a good position to get through next winter without major disruptions, it remains quite dependent on natural gas imports. Consequently, risks remain and an adverse scenario in which it loses some of its alternative-to-Russia import sourcing could impose substantial economic costs. These risks can be reduced though, for example, by securing long-term import contracts, continuing to build import and storage infrastructure, and lowering gas consumption through energy efficiency and energy substitution.
1. I would like to thank Deepa Datta for helpful suggestions and encouragement throughout this project. This work also benefited from comments and discussions with Harun Alp, Johannes Fleck, and Nils Goernemann. The analysis presented here builds on preliminary work by David Lowe and Nils Goernemann on the German natural gas situation. The views in this note are solely the responsibility of the author and should not be interpreted as reflecting the views of the Board of Governors of the Federal Reserve System or any other person associated with the Federal Reserve System. Return to text
2. The heating-degree-day index is a weather-based technical index designed to describe the need for the heating energy requirements of buildings. These data are originally published by the Joint Research Centre's AGRI4CAST Resources Portal and then re-published by the Eurostat. Return to text
3. Over the period from 2015 to 2021, heating degree days in the second half of the year averaged 1,164 and ranged between 1,108 and 1,245. Return to text
4. We do not discern a monthly seasonal pattern in the gas import data that would suggest that a month-by-month assumption for imports would be preferable. Also, by setting gas consumption in each month at its 2015–2021 average level, we are implicitly assuming that the gas-saving efforts implemented over the past year had only temporary effects. This is likely not the case, so gas consumption may turn out to be lower than in our baseline. Return to text
5. We estimate storage capacity using AGSI/GIE data on working gas volumes, converted to billion cubic meters. To estimate future storage capacity, we use information collected by Bruegel on Europe's ongoing and planned gas infrastructure projects, available at https://www.bruegel.org/dataset/national-energy-policy-responses-energy-crisis. Return to text
Rua, Gisela (2023). "Europe: Well-positioned to get through next winter without major gas shortages," FEDS Notes. Washington: Board of Governors of the Federal Reserve System, August, 07, 2023, https://doi.org/10.17016/2380-7172.3365.
Disclaimer: FEDS Notes are articles in which Board staff offer their own views and present analysis on a range of topics in economics and finance. These articles are shorter and less technically oriented than FEDS Working Papers and IFDP papers.