FEDS Notes
October 09, 2019
Expectations about the Federal Funds Rate in the Long Run
Kasper Joergensen and Andrew Meldrum1
Introduction
Over the past several years, the federal funds rate has remained well below the levels typically seen prior to the financial crisis that began in 2007. That raises an important question: to what extent does the persistent relatively low level of the federal funds rate reflect a decline in its long-run equilibrium or "natural" level that will prevail once the effects of transitory shocks to the economy have died away and the stance of monetary policy is neutral? In this Note, we examine how views have evolved on that question among professional forecasters, Federal Open Market Committee (FOMC) participants, and investors in bond markets. We also compare those views with estimates from various macroeconomic models.
Estimates of the expected federal funds rate in the long run are highly uncertain. On balance, however, a range of estimates has declined from the region of 4 to 5 percent prior to the crisis to the region of 2 to 4 percent more recently. This apparent decline is broadly consistent with changes in estimates of natural rates of interest derived from various macroeconomic models; indeed, falls in model-based estimates of natural rates may have been one of the factors that prompted long-run federal funds rate expectations to fall.
Professional Forecasters' Expectations
We start by examining the long-horizon expectations of professional forecasters, as expressed in surveys. These long-horizon surveys should provide a measure of the expected equilibrium federal funds rate if we assume that transitory shocks to the economy are expected to have died away and the stance of monetary policy is expected to be neutral. The yellow diamonds on Figure 1 shows the long-horizon expected federal funds rate reported by the average respondent to the Blue Chip Financial Forecasts survey of business economists.2 The average respondent's long-horizon expectation was 4.8 percent in June 2007, around the start of the financial crisis. By June 2012, it had fallen by more than a percentage point, to 3.6 percent. The downward trend resumed in 2014 before levelling off at around 3 percent in 2016. In the June 2019 survey it stood at 2.8 percent.
A similar picture for the period since June 2012 emerges from the Federal Reserve Bank of New York's Survey of Primary Dealers (the "Desk survey"). The red diamonds on Figure 1 show the median respondent's expectations for the federal funds rate in the longer run and the pink shaded area shows the interquartile range of responses. The median respondent's expectation was 4 percent until early 2014, when it started to fall, broadly in line with the Blue Chip survey. In the July 2019 Desk survey the median respondent's expectation was 2.5 percent. The interquartile range has fallen by a similar amount as the median and covered a range between about 2.3 percent and 2.8 percent in July 2019.
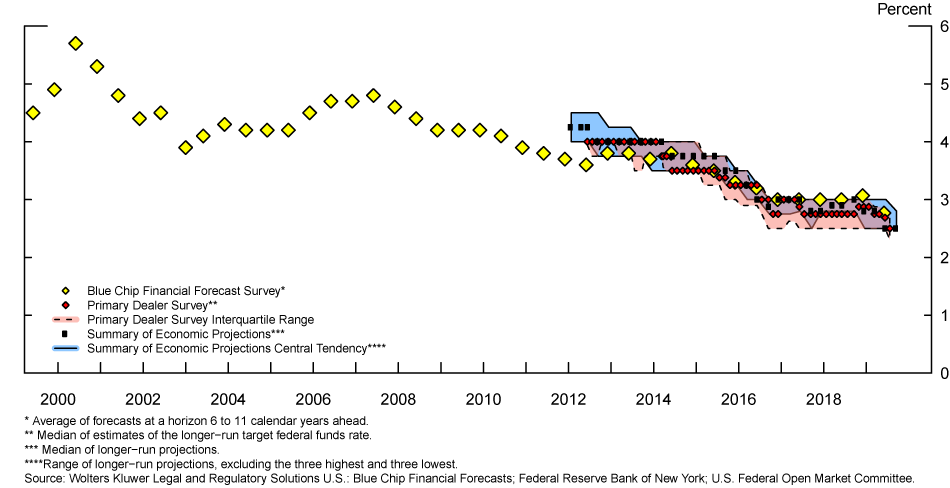
Source: Wolters Kluwer Legal and Regulatory Solutions U.S.: Blue Chip Financial Forecasts; Federal Reserve Bank of New York; U.S. Federal Open Market Committee.
While surveys provide direct reads on long-run federal funds rate expectations, they are not without potential drawbacks. Perhaps most importantly, it seems plausible to us that surveys reflect respondents' views about the single most likely outcome for the federal funds rate at a long forecast horizon (that is, the modal expectation), rather than the outcome that is expected to prevail on average (that is, the mean expectation), which is how economists typically proxy for equilibrium interest rates.3
While the surveys do not allow us to estimate the difference between the most likely and average outcomes for the long-run federal funds rate, results from questions in recent Desk surveys that refer to expectations at shorter horizons suggest that the difference might be substantial. As well as asking respondents for the most likely outcome for the federal funds rate at the ends of 2020 and 2021, the July 2019 Desk surveys asked respondents to provide two conditional probability distributions for the federal funds rate at each horizon. The conditioning scenarios were that the federal funds rate returns to the zero lower bound at any point before the end of 2021, and that it does not return to the zero lower bound.4 Because the surveys also asked respondents for their estimates of the probability of returning to the lower bound, we can combine the information in the two conditional distributions to estimate the (unconditional) average expected federal funds rate at horizons up to the end of 2021.5
The red diamonds on Figure 2 show that the median respondent to the July 2019 survey thought that the most likely outcome was that the federal funds rate would fall from about 2.4 percent to about 1.9 percent by the end of 2019 and remain unchanged at that level until the end of 2021.6 However, respondents appear to believe there are substantial downside risks to the federal funds rate. In particular, the median respondent assigned a probability of 35 percent to returning to the lower bound at any point before the end of 2021. This perceived downside risk lowered the average expected outcomes at the ends of 2020 and 2021, shown by the black squares, substantially below the most likely outcomes. For example, the average expected outcome at the end of 2021 was about 1.4 percent.
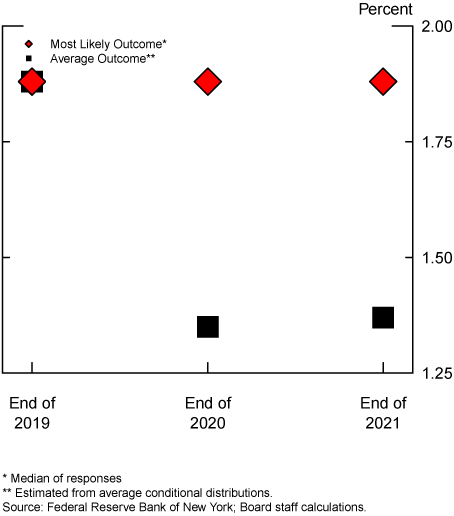
Source: Federal Reserve Bank of New York; Board staff calculations.
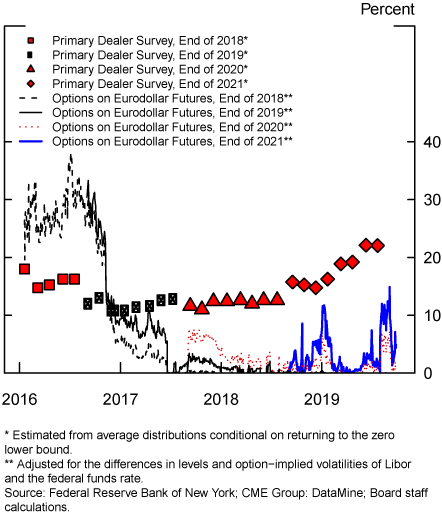
Source: Federal Reserve Bank of New York; CME Group: DataMine; Board staff calculations.
To illustrate how the perceived downside risk to the federal funds rate has evolved over recent years, the various red markers on Figure 3 show the probabilities of the federal funds rate being below 0.25 percent at the ends of 2018 through 2021 (the forecast horizon covered by the survey has extended by one calendar year each September).7 These probabilities have ranged between about 10 and a little above 20 percent since January 2016, when the relevant questions were first asked.8 While we do not have similar survey responses for earlier periods, it is possible that the experience of the financial crisis caused forecasters to attach persistently higher probabilities to being at the lower bound. So responses to survey questions about the longer-run federal funds rate may understate the decline in the average federal funds rate in the long run.
On the other hand, interest rate options quotes have generally implied substantially lower probabilities of the federal funds rate falling below 0.25 percent since mid-2017. The various lines on Figure 3 shows the probabilities of the federal funds rate being below 0.25 percent at the ends of 2018 through 2021, estimated from eurodollar futures options quotes. Unlike the surveys, option prices will be affected by risk premiums, which cause option-implied "risk-neutral" probabilities to differ from the "real-world" probabilities that investors truly assign to different outcomes. However, because risk averse investors will tend to attach a higher risk-neutral probability to outcomes that are associated with unfavorable economic outcomes, it seems most plausible to us that the option-based probabilities will over-estimate the true probability of returning to the lower bound.9 Indeed, during most of 2016 these option-implied probabilities were generally well above their survey counterparts, at about 30 percent. However, during late 2016 the option-implied probabilities fell sharply and have typically been well below 15 percent since then. It is therefore possible that financial market investors perceive the distribution of future federal funds rate outcomes to be more symmetric than the survey suggests. It is also plausible that the federal funds rate distribution at longer horizons is more symmetric than at the shorter horizons considered here. So responses to survey questions about the longer-run federal funds rate may still provide a reasonable estimate of the average expected federal funds rate in the long run.
FOMC Participants' Projections
We next examine the views of FOMC participants since projections for the level of the federal funds rate over the "longer run" were included in the FOMC's Summary of Economic Projections (SEP) for the first time in January 2012. The blue dots on the left panel of Figure 1 show the median participant's projection, while the blue shaded area shows the "central tendency" range, defined as the range of participants' projections excluding the three highest and three lowest. In January 2012, the median projection was 4.25 percent, about 1/2 percentage point higher than the average December 2011 Blue Chip survey response. However, by September 2019 the median FOMC participant's projection had fallen to 2.5 percent, about 1/4 percentage point below the average June 2019 Blue Chip survey response. In September 2019, the majority of participants projected the longer-run federal funds rate to be modestly above the current federal funds rate: the central tendency covered a range from 2.5 percent to 2.8 percent. In summary, FOMC participants' projections since 2012 appear broadly consistent with the surveys of professional forecasters discussed above.
Bond Market Investors' Expectations
We next turn to the views of investors in bond markets. The obvious starting point is to look at long-horizon forward rates. The black line on Figure 4 shows the 5-to-10-year forward rate, the interest rate referring to a period between 5 and 10 years ahead.10 If we assume that the risk or "term" premium in the forward rate is zero, then this forward rate provides a measure of investors' expectations about the average federal funds rate in 5 to 10 years' time. During 2007, the forward rate was generally around 5 percent but has since declined on net, to below 2 percent recently (late September 2019).
However, it is well known that term premiums in long-term forward rates can be substantial and can vary over time (see, for example, Kim and Wright (2005)). One approach for adjusting for term premiums is to use a "dynamic term structure model" (DTSM), an econometric time-series model of interest rates at different maturities.11 The red line on Figure 4 shows an estimate of the expected average federal funds rate from 5 to 10 years ahead taken from a "shadow rate model;" several studies have used similar models to analyze U.S. Treasury yields over recent years (see, for example, Christensen and Rudebusch (2015), Bauer and Rudebusch (2016), Wu and Xia (2016), and Andreasen and Meldrum (2019)).12 Second, the blue line shows the estimate from an extension of the shadow rate model that allows the dynamics of the variables that affect bond yields to change at the lower bound. Andreasen, Joergensen, and Meldrum (2019) show that this modification allows the model to better match recent evidence about returns on Treasury securities, which suggests that it should do a better job of adjusting market interest rates for term premiums.
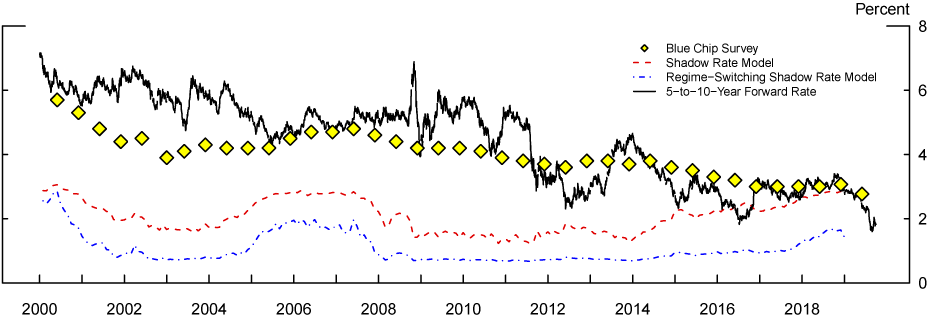
Source: Wolters Kluwer Legal and Regulatory Solutions U.S.: Blue Chip Financial Forecasts; Federal Reserve Bank of New York; Andreasen, Jorgensen, and Meldrum (2019); Board staff estimates.
It is striking that the estimated long-horizon expectations implied by the two models are not only quite different from one another but also bear little resemblance to expectations from the Blue Chip surveys, which are again shown in yellow diamonds. Despite the limitations of surveys, it seems reasonable to think that any plausible estimate of long-horizon federal funds rate expectations would at least be somewhat similar to the surveys. These results highlight some general concerns about using econometric models for estimating neutral rates: past interest rates may not be a good guide to the future and the short samples of historical interest rates mean that estimates of expected future interest rates are generally imprecise.
Several studies have attempted to address some of these short-sample problems in DTSMs by incorporating additional information on expected future interest rates from the kinds of surveys discussed above (following Kim and Orphanides (2012)), in order to produce more plausible and precise estimates of federal funds rate expectations. We can think of these survey-augmented DTSMs as a mechanical way of combining the information in market interest rates and surveys.
The red and blue lines in Figure 5 shows results from versions of the models shown in Figure 4 that have been augmented with Blue Chip survey data. The survey-augmented models generally track the surveys fairly closely. However, one period when the models do appear to take a somewhat different view from the surveys is between 2017 and 2018, when the sample for the models ends. Since 2017, nominal interest rates have risen substantially on net, as the FOMC has raised the federal funds rate. The models interpret those increases as reflecting, to some extent, a higher neutral rate and therefore discount the signal from recent surveys. Thus, the models suggest that Treasury market investors believe that the equilibrium federal funds rate is actually somewhat higher than suggested by recent surveys, perhaps closer to 3 1/2 to 4 percent.13 However, other term structure models may provide different interpretations of the period since 2017. For example, the model of Kim and Wright (2005)--another survey-augmented term structure model--produces estimates of long-horizon expectations that have been closer to the Blue Chip surveys recently, as shown by the black line in Figure 5.
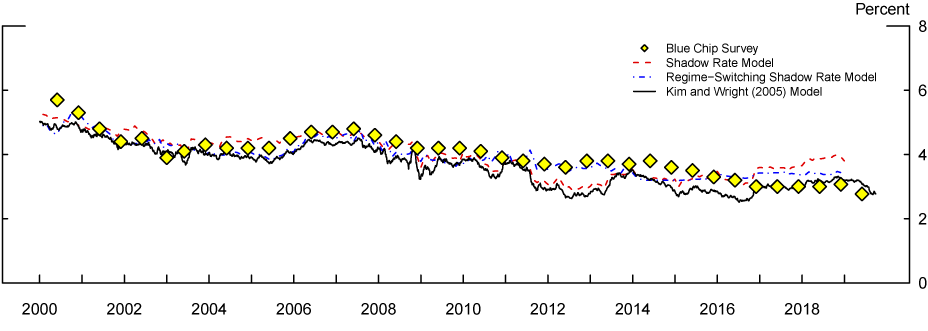
Source: Wolters Kluwer Legal and Regulatory Solutions U.S.: Blue Chip Financial Forecasts; Andreasen, Jorgensen, and Meldrum (2019), Kim and Wright (2005).
Comparison with Estimates of the Natural Rate
In this section, we examine whether expectations about the long-run federal funds rate are consistent with estimates of the natural rate implied by macroeconomic models. Figure 6 shows four such estimates--derived from the models of Laubach and Williams (2003, 2016), Kiley (2015), Holsten et al (2017), and Johannsen and Mertens (2018)--alongside the Blue Chip survey-based measure of long-horizon federal funds rate expectations shown previously. Because these four studies estimate the natural real rate, we follow Bauer and Rudebusch (2019) and add a measure of long-horizon inflation expectations to each of the model-based estimates to convert them into estimates of the natural federal funds rate.14 The various estimates have all generally declined, from about 4 to 4 1/2 percent in 2007 to below 3 percent in late 2018 (although the models do not fully agree on the timing of the declines). Thus, the macroeconomic model-based natural rate estimates have evolved similarly to the measures of long-run expectations discussed above.
Figure 6: Measures of the Natural Federal Funds Rate and Long-Horizon Federal Funds Rate Expectations
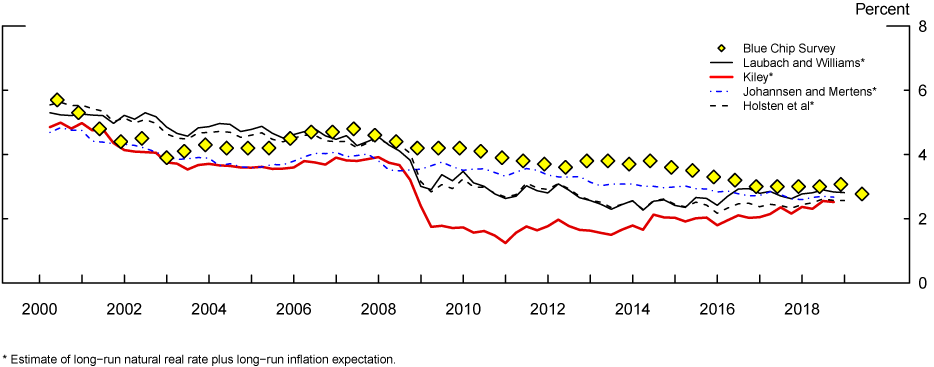
Source: Wolters Kluwer Legal and Regulatory Solutions U.S.: Blue Chip Financial Forecasts, Laubach and Williams (2003, 2016), Kiley (2015), Johannsen and Mertens (2019), Holsten, Laubach, and Williams (2017); FRB/US Model Data Files; Board staff calculations.
However, there are two important caveats to bear in mind. First, although the macroeconomic models produce broadly similar point estimates of equilibrium rates, the uncertainty around each estimate is likely to be very large, due in part to the weak correlation between output growth and real interest rates, which most of the models rely on to identify the natural real rate. Second, while the surveys and macroeconomic models appear to be broadly consistent, they may not be entirely independent sources of information about the long-run average federal funds rate; the substantial attention that some models have received among policymakers and economic commentators over recent years may be part of the reason why forecasters have revised down their estimates of the long-run federal funds rate.15
Conclusion
Although measures of long-horizon federal funds rate expectations are uncertain and have several caveats, on balance they suggest that the expected long-run federal funds rate has declined from somewhere in the region of 4 to 5 percent prior to the financial crisis that started in 2007 to somewhere in the region of 2 to 4 percent more recently. Part of the decline in the expected long-run federal funds rate may have been prompted by declining estimates of natural interest rates from widely-cited macroeconomic models.
References
Adrian, T., R. K. Crump, and E. Moench (2013). "Pricing the Term Structure with Linear Regressions." Journal of Financial Economics 110(1), pp. 110-138.
Andreasen, M. M. and A. Meldrum (2018). "A Shadow Rate or a Quadratic Policy Rule? The Best Way to Enforce the Zero Lower Bound in the United States." Journal of Financial and Quantitative Analysis, forthcoming.
Andreasen, M. M., K. Joergensen, and A. Meldrum (2019). "Bond Risk Premiums at the Zero Lower Bound." CREATES Research Paper 2019-10.
Bauer, M. D. and G. D. Rudebusch (2016). "Monetary Policy Expectations at the Zero Lower Bound." Journal of Money, Credit, and Banking 48(7), pp. 1439-1465.
Bauer, M. D. and G. D. Rudebusch (2019). "Interest Rates under Falling Stars." Federal Reserve Bank of San Francisco Working Paper 2017-16.
Christensen, J. H. E. and G. D. Rudebusch (2015). "Estimating Shadow-Rate Term Structure Models with Near-Zero Yields." Journal of Financial Econometrics 13(2), pp. 226-259.
Christensen, J. H. E. and G. D. Rudebusch (2019). "A New Normal for Interest Rates? Evidence from Inflation-Indexed Debt." Review of Economics and Statistics, forthcoming.
Gürkaynak, R. S., B. Sack, and J. H. Wright (2007). "The U.S. Treasury Yield Curve: 1961 to the Present." Journal of Monetary Economics 54(8), pp. 2139-2682.Holsten, K., T. Laubach and J. C. Williams (2017). "Measuring the Natural Rate of Interest: International Trends and Determinants." Journal of International Economics 108, supplement 1 (May), pp. S39-S75.
Johannsen, B. K. and E. Mertens (2018). "A Time Series Model of Interest Rates with the Effective Lower Bound." BIS Working Papers 715.
Kiley, M. T. (2015). "What Can the Data Tell Us about the Equilibrium Real Interest Rate?" Finance and Economics Discussion Series 2015-077. Washington: Board of Governors of the Federal Reserve System, http://dx.doi.org/10.17016/FEDS.2015.077.
Kim, D. H. and J. H. Wright (2005). "An Arbitrage-Free Three-Factor Term Structure Model and the Recent Behavior of Long-Term Yields and Distant-Horizon Forward Rates." Federal Reserve Board Finance and Economics Discussion Series 2005-33.
Kim, D. H. and A. Orphanides (2012). "Term Structure Estimation with Survey Data on Interest Rate Forecasts." Journal of Financial and Quantitative Analysis 47(1), pp. 241-272.
Klein, M. C. (2016). "The Fed's Gradual Embrace of 'Secular Stagnation.'" Financial Times, March 18 2016.
Laubach, T. and J. C. Williams (2003). "Measuring the Natural Rate of Interest." Review of Economics and Statistics 85(4), pp. 1063-1070.
Laubach, T. and J. C. Williams (2016). "Measuring the Natural Rate of Interest Redux." Business Economics 51(2), pp. 57-67.
Li, C., A. Meldrum, and M. Rodriguez (2017). "Robustness of Long-Maturity Term Premium Estimates." FEDS Notes. Washington: Board of Governors of the Federal Reserve System, April 3, 2017, https://doi.org/10.17016/2380-7172.1927.
Potter, S. (2016). "The Advantages of Probabilistic Survey Questions." Remarks at the IT Forum and RCEA Bayesian Workshop Keynote Address, Rimini, Italy, May 19, 2016.
Wu, J. C. and F. D. Xia (2016). "Measuring the Macroeconomic Impact of Monetary Policy at the Zero Lower Bound." Journal of Money, Credit, and Banking 48(2-3), pp. 253-291.
Yellen, J. (2016). "The Federal Reserve's Monetary Policy Toolkit: Past, Present, and Future." Speech at "Designing Resilient Monetary Policy Frameworks for the Future," a symposium sponsored by the Federal Reserve Bank of Kansas City, Jackson Hole, Wyoming, August 26, 2016.
1. We are grateful to Louisa Liles for excellent research assistance and for helpful comments from Ryan Bush, Michiel De Pooter, and Don Kim. Return to text
2. The long-horizon Blue Chip surveys refer to a forecast horizon covering a period 6 to 11 calendar years ahead. Return to text
3. Some other potential drawbacks of surveys are discussed by Meldrum, Li, and Rodriguez (2017). Return to text
4. Potter (2016) discusses the potential advantages of such probabilistic survey questions. Similar questions about the federal funds rate over the next two to three years have been asked since January 2016. Return to text
5. Some additional assumptions are required to compute the average expected federal funds rate. Where respondents are asked to assign probabilities to the federal funds rate falling within a closed interval, we assign all of the probability to the mid-point of that interval. Where respondents are asked to assign probability to the federal funds rate falling within an interval with one open end, we assign all of the probability to a value 50 basis points from the closed end of the interval, except for the open interval of less than or equal to zero percent, which we assign to the estimated lower bound for the federal funds rate reported by the median survey respondent. The estimated average expectations are generally not particularly sensitive to the allocation of probabilities in the open intervals because those intervals have relatively low average unconditional probabilities assigned. We also assume that the average respondent assigns the same probability of returning to the lower bound as the median respondent. Return to text
6. Not all respondents provided modal paths for end-2021. Return to text
7. During the lower bound episode of 2008 to 2015 the target range for the federal funds rate was between 0 and 0.25 percent. We estimate the probability of the federal funds rate being below 0.25 percent at the end of a given year by multiplying the probability of returning to the lower bound at any point before the relevant date by the probability that the federal funds rate is below 0.25 percent on the relevant date (that is, we assume that there is zero probability of the federal funds rate being below 0.25 percent but above the lower bound over the period before the relevant date). Return to text
8. The probabilities fell from about 20 percent in January 2016 to about 10 percent in October 2017. This decline seems reasonable given that the FOMC increased the target range for the federal funds rate gradually over this period, as the economic outlook improved. Since July 2017, the probabilities have increased, which may reflect increased concern about the possibility of a future economic downturn. Return to text
9. These option-implied probabilities are adjusted for the different levels and option-implied volatilities of Libor and the federal funds rate, although this adjustment does not allow for the possibility that the Libor-federal funds rate spread may be particularly high in a scenario associated with a return to the lower bound. However, the option-implied probabilities are not adjusted for other risk premiums. Return to text
10. This forward rate is taken from the Gürkaynak, Sack, and Wright (2007) data set, which is updated by Board staff and is available at https://www.federalreserve.gov/pubs/feds/2006/200628/200628abs.html. Return to text
11. The approach of using a term structure model to measure financial market investors' views about equilibrium real interest rates has been suggested previously by Christensen and Rudebusch (2019). Return to text
12. Other popular DTSMs of nominal interest rates include the models of Kim and Wright (2005) and Adrian, Crump, and Moench (2013). The standard shadow rate models shown in this Note are similar to those other models; the main differences are that shadow rate models ensure that short rate predictions are consistent with the lower bound and that we use different data sets and estimation approaches. Return to text
13. Differences between the model- and survey-based measures could also reflect model misspecification. Indeed, Andreasen, Joergensen, and Meldrum (2019) show that it is straightforward to extend one of the shadow rate models shown here to better match the surveys by allowing for a structural break in certain model parameters in 2015. Return to text
14. Specifically, we use the long-horizon inflation expectation measure used in the Federal Reserve's FRB/US model. The data are available at: https://www.federalreserve.gov/econres/us-models-package.htm. Return to text
15. Yellen (2016) and Klein (2016) are examples of Federal Reserve communications referring to these models and media commentary, respectively. Return to text
Joergensen, Kasper, and Andrew Meldrum (2019). "Expectations about the Federal Funds Rate in the Long Run," FEDS Notes. Washington: Board of Governors of the Federal Reserve System, October 9, 2019, https://doi.org/10.17016/2380-7172.2431.
Disclaimer: FEDS Notes are articles in which Board staff offer their own views and present analysis on a range of topics in economics and finance. These articles are shorter and less technically oriented than FEDS Working Papers and IFDP papers.