FEDS Notes
June 01, 2018
How Does Intergenerational Wealth Transmission Affect Wealth Concentration?
Laura Feiveson and John Sabelhaus
Wealth concentration is high and rising in the US, reigniting an old debate within economics about the role that intergenerational wealth transmission plays in understanding savings and wealth accumulation.1 One view is that observed wealth holdings at any point in time are almost entirely attributable to lifetime saving that is unconnected to family wealth or support, which implies that intergenerational wealth transmission is probably not particularly important for explaining wealth concentration. An alternative view is that wealthy dynastic families hold a substantial share of aggregate wealth that is systematically passed from old to young, either through direct transfers in the form of inheritances and financial gifts, or more indirect channels such as the provision of education or other opportunities that lead to future wealth accumulation.2 In this note, we seek to establish the role of intergenerational wealth transmission by using the Federal Reserve Board's Survey of Consumer Finances (SCF), which contains extensive information about household balance sheets, intergenerational transfers made and received, and demographic and socioeconomic characteristics of respondents.3
Direct intergenerational transfers of cash and assets--in the form of inheritances and gifts--are particularly well captured in the SCF data. We show that the size distribution of such direct transfers is highly skewed, and that inheritance and gift recipients tend to be wealthier, higher-income and more educated that the average person in the economy, resulting in highly concentrated flows of intergenerational transfers. We then examine the extent to which direct transfers affect the concentration of wealth.
Other forms of wealth transmission are more difficult to quantify, although the SCF does contain questions that shed light on some of these channels. Investment in education and inclusion in lucrative family businesses are two examples of indirect ways in which wealthy families set their children up for future financial success. Additional wealth transmission channels derive from changes in consumption or labor supply choices due to the receipt or the prospect of future receipt of a substantial gift or inheritance. While some of these behavioral effects could possibly attenuate the effect of intergenerational transfers on wealth inequality--such as the oft-discussed tendency for some children of wealthy families to slack off--most effects--like the ability to take greater risks through entrepreneurship or other activities--would lead to increased wealth disparities.
Intergenerational Transfers by Size of Transfer
Intergenerational transfers are a widespread phenomenon, with an average of roughly 2 million households receiving either an inheritance or a substantial gift each year. However, these sorts of wealth transfers are highly skewed. Figure 1 focuses on the distribution of inheritances received.4 The left panel shows that most inheritances are relatively small, with about half of all inheritances in amounts less than $50,000. However, the total share of dollars transferred in those amounts of less than $50,000 is also relatively small, accounting for just over 5 percent of total inheritances. At the other end of the size distribution, transfers of $1,000,000 or more account for only about 2 percent of the number of transfers at death, but 40 percent of total dollars transferred.
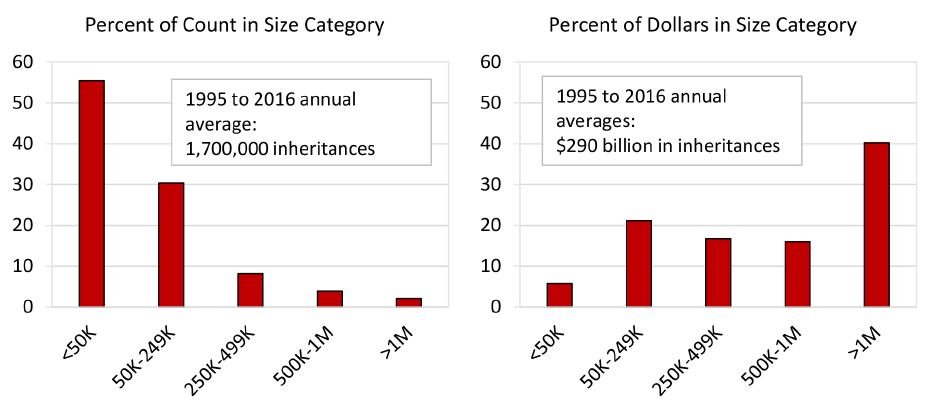
Source: Survey of Consumer Finances, Federal Reserve Board.
Substantial gifts of money and assets from one living person to another--so called inter vivos transfers--are even more skewed than inheritances, as shown in Figure 2.5 More than 70 percent of inter vivos gifts reported are less than $50,000, but the relatively few gifts in amounts greater than $1,000,000 account for almost half of the total dollars received.
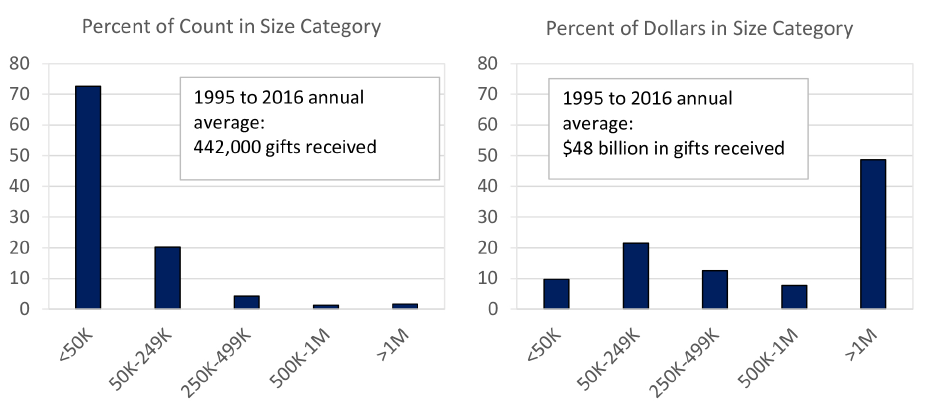
Source: Survey of Consumer Finances, Federal Reserve Board.
Together, annual inheritances and inter vivos transfers averaged about $350 billion (2016 dollars) per year in the period 1995 to 2016, which amounts to around 3 percent of total household sector Disposable Personal Income (DPI). Thus, intergenerational transfers are roughly the same magnitude of total personal saving as measured in the National Income and Product Accounts (NIPA).
Characteristics of Transfer Recipients
The role of transfers in propagating wealth inequality will depend crucially on the characteristics and circumstances of transfer recipients. Even a highly skewed distribution of transfers has the potential to decrease wealth concentration, if, for example, those transfers are received by families experiencing negative income or wealth shocks. However, since transfers are often between family members in similar income or wealth classes, the smoothing role is likely limited. Indeed, we find that the recipients of intergenerational transfers are much more likely to be college-educated, high-income, and high-wealth, as shown in the Table 1.6
Table 1: Characteristics of Transfer Recipients
| Population | Inheritance/ Inter Vivos Gift Recipients | |
|---|---|---|
| Age (Years) | 50 | 49 |
| Median Income (2016 $) | 54,000 | 74,000 |
| Median Net Worth (2016 $) | 97,000 | 267,000 |
| White (Percent) | 73% | 88% |
| College-Educated (Percent) | 30% | 43% |
Note: Pooled over SCF surveys 1995 to 2016.
Source: Survey of Consumer Finances, Federal Reserve Board.
Intergenerational transfers are strongly associated with life events that tend to occur around certain ages, for example, the death of a parent. As such, it is instructive to look at lifecycle profiles of transfer receipt by age.7 As before, we look separately at inheritances and inter vivos transfers, and we focus on differences in transfers received across the income distribution. The left panel of Figure 3 shows the probability of having received an inheritance over the past 3 years by age and income. Inheritance receipt peaks at around age 60 for all income groups, consistent with observed generational age gaps (around 20 years) and lifespans (around 80 years).
In addition to the age pattern, Figure 3 shows that the probability of receiving an inheritance for those in the top 10 percent of the income distribution is twice the probability of receipt for those in the bottom half of the distribution.8 The right panel shows that the amount of inheritance receipt, conditional on receiving a transfer, is almost four times as large for those in the top of the income distribution than those at the bottom of the distribution. Similar differentials exist across education and wealth groupings.
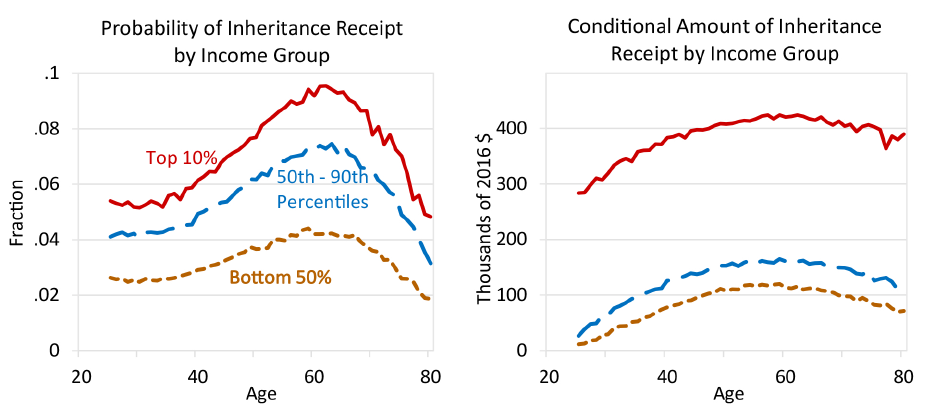
Source: Survey of Consumer Finances, Federal Reserve Board.
The lifecycle pattern of inter vivos transfer receipt is very different than the pattern for inheritances. As shown in the left panel of Figure 4, the probability of receiving an inter vivos transfer peaks for individuals in their mid-20s--when many households receiving a helping hand from their parents--after which it declines. While individuals in the top of the income distribution are more likely to receive inter vivos transfers than those in the bottom half of the distribution, the differentials in the probabilities are not as pronounced as those for inheritances. However, the differences in the amounts received are again substantial--as shown in the right panel for Figure 4, conditional on receiving an inter vivos transfer, those in the top 10 percent of the income distribution receive three times the amount of those in the bottom 90 percent of the distribution.
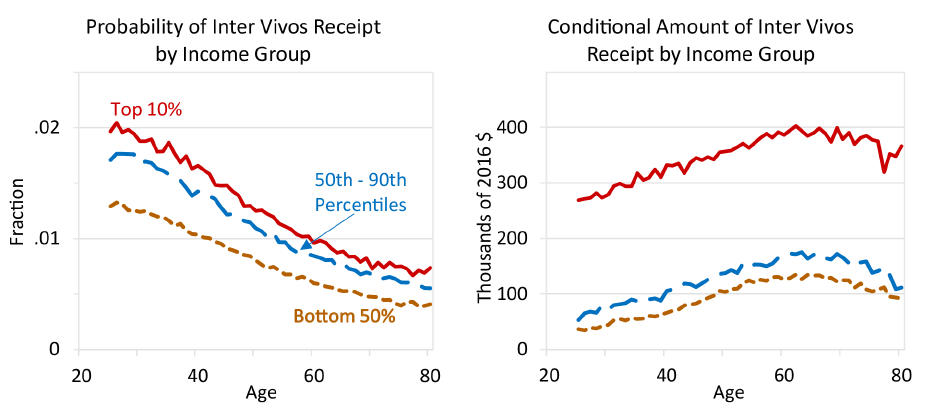
Source: Survey of Consumer Finances, Federal Reserve Board.
These patterns of inheritance and inter vivos gift receipt demonstrate that the bulk of intergenerational transfers are flowing to families that already have substantial resources. Indeed, as shown in the left panel of Figure 5, almost 40 percent of intergenerational transfers go to households that were in the top 10 percent of the income distribution in the year they received the transfer. Only about 20 percent of the total transfer amount goes to families in the bottom half of the income distribution. Intergenerational transfer receipt is even more concentrated across wealth groups. The right panel of Figure 5 shows that more than half of all intergenerational transfers go to the top 10 percent of the wealth distribution, while only 8 percent of intergenerational transfers go to the bottom half of the wealth distribution.
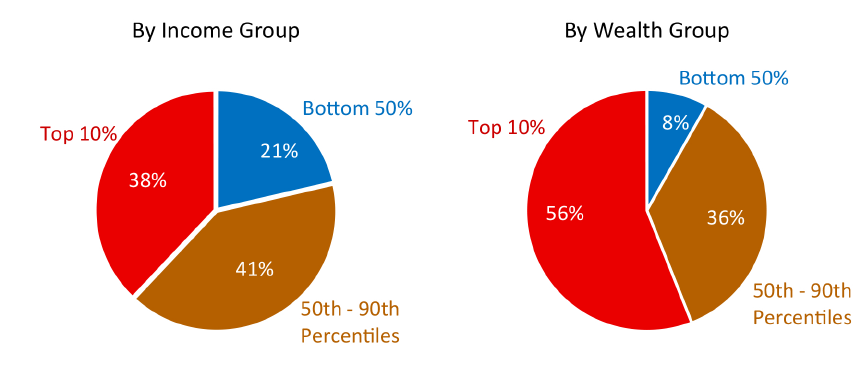
Source: Survey of Consumer Finances, Federal Reserve Board.
Can Direct Intergenerational Transfers Help Explain Wealth Concentration?
The observations above on inheritance and inter vivos gift receipt by income and wealth suggest that the flow of intergenerational transfers likely has an important role in explaining the wealth concentration. In this section, we use SCF data on the history of all transfers received for each household to confirm that intergenerational transfers account for a substantial fraction of wealth for households across the entire wealth distribution. One implication of this fact is that redistributing all wealth directly accounted for by intergenerational transfers would have a dramatic effect on the distribution of wealth, as shown in a simple counterfactual.
For every family in the SCF sample, we observe their current wealth and their lifetime history of intergenerational transfers.9 That suggests the following exercise. For each individual, compute lifetime transfers received, convert those transfers into today's dollars using an assumed nominal interest rate, and compare that to current wealth. The crucial adjustment for this exercise involves the timing of transfer receipt, because interest accumulates and wealth grows over time. In the SCF we observe when the transfer was received, but, as in the older aggregate transfers literature mentioned in the introduction, we still have to make an assumption about the interest earned on the inherited wealth.10
In aggregate, the SCF data confirms the findings from the older literature about the direct contribution of intergenerational wealth transfers to wealth accumulation.11 As shown in the last column of Table 2, if we assume that the inflation-adjusted return on transfers received is 3 percent, we estimate that 26 percent of total wealth can be accounted for by intergenerational transfers. Using a real interest rate of 5 percent, the estimated share of wealth accounted for by intergenerational transfers jumps to 51 percent. The choice of interest rate clearly matters for the aggregate estimates of the extent to which intergenerational transfers can account for total wealth, and indeed, that is one of the main points of contention in the older literature.
Table 2: Share of Wealth Directly Accounted for by Intergenerational Transfers, 2016
| Bottom 50% | Next 40% | Top 10% | All | |
|---|---|---|---|---|
| Share of Wealth | 3% | 25% | 72% | 100% |
| Fraction of Wealth from Transfers | ||||
| Real interest rate = 3% | 43% | 24% | 25% | 26% |
| Real interest rate = 5% | 74% | 40% | 53% | 51% |
Source: Survey of Consumer Finances, Federal Reserve Board.
Using the SCF micro data we can also look beyond the aggregates and begin to think about the effects of intergenerational transfers on the distribution of wealth. The first step is to reconstruct the aggregate calculation for various wealth groups. To keep the analysis simple, we group SCF observations by actual wealth into the bottom 50 percent, the next 40 percent, and the top 10 percent, conditional on age. The first three columns of Table 2 show that wealth accounted for by intergenerational transfers is substantial across all wealth groups. Thus, although the top 10 percent of households own the vast majority of wealth, there is no prima facie evidence that a larger share of their wealth is attributable to lifetime saving.12
Building on this simple accounting exercise, we conduct the following counterfactual thought experiment. We ask, "what if all of the wealth owned by each wealth group that is attributable to intergenerational transfers had instead been distributed equally across the population?" For this counterfactual, we implicitly assume that the lifetime consumption of each wealth group and any other behavior does not change in an equal-distribution world. This assumption is obviously wrong, but may actually be close to the welfare conclusions one would draw if (for example) we acknowledge that lower-wealth individuals probably have a higher propensity to consume transfers received. In effect, we want the exercise to show that (currently) lower-wealth families would have first-order higher economic well-being through either additional lifetime consumption or through higher current wealth. We choose to show the latter because it does not require estimating consumption and it keeps total wealth constant.
Figure 6 shows the results of the counterfactual thought experiment, which are dramatic and again suggestive that direct transfers likely play an important role in explaining wealth concentration. The top 10 percent of families sorted by wealth actually owned 73 percent of the wealth in 2016. If, rather than using actual transfer receipts, we assume that all of the inheritances and inter vivos transfers reported by individuals alive in 2016 had been equally distributed, the wealth share of those same households would fall to 57 percent, given a real interest rate of 3 percent. Increasing the assumed interest rate on transfers received to 5 percent makes the counterfactual even more dramatic, as the wealth share of families in the top 10 percent would fall by almost half, to 40 percent. Most of the wealth redistribution in the counterfactual goes to those families currently in the bottom 50 percent of the distribution, as their wealth share rise from the actual 3 percent observed in 2016 to a counterfactual 15 percent at an interest rate of 3 percent, and to 26 percent at an interest rate of 5 percent.13
This exercise suggests that policies that tax and redistribute intergenerational transfers have the potential to greatly shift wealth around the population, with large welfare effects for subsets of the population.14
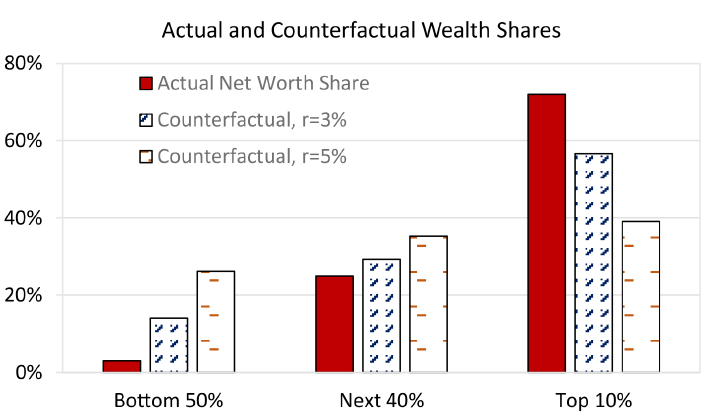
Source: Survey of Consumer Finances, Federal Reserve Board.
Indirect Forms of Intergenerational Wealth Transmission
In addition to intergenerational transfers in the form of a direct transfer of wealth, there are other ways in which wealth is passed across generations. The most obvious is through education. If wealthier families are able to provide better education for their children, those children will have higher labor incomes, and thus they will tend to save more over their lifetimes and accumulate greater wealth. To analyze outcomes among households from wealthy families, we find it useful to define "born to wealth" as those households for whom the sum of their reported lifetime transfers received (with interest) and their expected future transfers exceeds $1,000,000 in real 2016 dollars. In rows 1 and 2 of Table 3, we show that the correlation between being "born to wealth" and education attainment is undeniable: the probability of having a bachelor's degree is twice as big for those born to wealth than all others, and the probability of having an advanced degree is four times as large. Ultimately, the key to understanding this wealth transmission channel is to determine how much of the subsequent difference in labor earnings is attributable to parental investments as opposed to other factors, such as natural ability or even luck.15
Table 3: Evidence of Indirect Forms of Intergenerational Wealth Transmission
| Born to Wealth 40 to 60 year old households | All other 40 to 60 year old households | |
|---|---|---|
| Percent of Group: | ||
| Has Bachelor's Degree | 67% | 32% |
| Has Advanced Degree | 16% | 4% |
| Works in Family or Inherited Business | 11% | 0.5% |
| Percent of Total Households | 2.7% | 97.3% |
Note: "Family or Inherited Business" is defined as a business that reported to be either inherited, given, or started with inheritance funds. Advanced Degree includes a PhD, JD, or MD. Households are assigned to the category "born to a wealth" if the sum of their inheritances received and their expected inheritances exceeds $1,000,000 (in real 2016 dollars).
Source: Survey of Consumer Finances, Federal Reserve Board.
Another form of wealth transmission may be through including heirs in lucrative family businesses. Because it is not possible to link children and parents in the SCF, it is difficult to distinguish family businesses from other businesses. However, respondents are asked about the origins of any businesses that they actively work in, and, in particular, whether the business was inherited or given to them. Furthermore, there is a question that asks with what types of finance was the business acquired--with a possible answer of "inherited/given". Row 3 of Table 3 focuses on those businesses that were inherited or given, or for which "inherited/given" was reported to be the financing source. Given this definition of family business, 11 percent of those respondents that were born to wealth have an active role in such a business, in contrast to less than 1 percent of the general population. Since this definition surely misses some family businesses, for which respondents would have reported "joining" the business rather than "inheriting" it, the probabilities shown in Table 3 are probably too low. They nevertheless demonstrate that family businesses may possibly be a strong channel of wealth transmission.
Harder-to-measure forms of wealth transmission across generations are also possible. These include providing connections that lead to higher paying jobs, providing financial expertise that leads to higher returns, and providing resume-building experiences that lead to more labor market opportunities. Evidence of these forms of transfers are harder to come by in the SCF, because parents and children are not directly linked.
Behavioral Responses to Intergenerational Wealth Transmission
Whether wealth transmission comes in the form of direct transfers or other channels, the behavioral responses of the wealth recipients could serve to amplify or attenuate wealth differentials. Andrew Carnegie once famously wrote "the parent who leaves his son enormous wealth generally deadens the talents and energies of the son, and tempts him to lead a less useful and less worthy life than he otherwise would..." This quote led to what is known as the "Carnegie Conjecture"--that idea that inheritances lead to a reduction in labor supply--for which there is some empirical evidence.16 On the other hand, network connections and higher education, as mentioned in the previous section, may lead to jobs that require more hours (in turn for more pay), thus leading to increased labor supply for some "born to wealth" households. Consumption choices are also paramount. The high saving rates of high-wealth consumers may amplify wealth differentials deriving from intergenerational transfers, as those who receive the most save the most, thus leading to even more wealth accumulation.
Another potential amplifier is through risk taking due to implicit insurance. An individual born into a wealthy family may be more likely to take risks in terms of occupational or portfolio choices, knowing that they are insured against bad outcomes in ways that others might not be. One possible manifestation of this family insurance mechanism is the decision to start or expand a business.17 Individuals who lack access to family financing (either direct family loans or loans based on family-owned collateral) face higher costs of capital, and thus are less likely to be competitive. In economic downturns, individuals with access to deep pockets might be more able to weather the storm and keep their businesses open.
Table 4 provides some suggestive evidence of the risk-taking channel among 40 to 60 year old households. We find that 37 percent of those born to wealth are willing to take on above average risk to get above average returns, as opposed to only 21 percent of the rest of the population. On the other hand, few (14 percent) of the households born to wealth are not willing to take on any risks, in contrast to a much higher fraction (37 percent) of the population at large. These figures certainly corroborate differences in risk preference across the groups. The third row shows that the probability of having started a successful business--a marker of the ability to turn higher risk into a higher return--is also four times larger for those in the born to wealth category.
Table 4: Evidence of Risk Taking
| Born to Wealth 40 to 60 year old households | All other 40 to 60 year old households | |
|---|---|---|
| Percent of Group: | ||
| Willing to take above average financial risks for above average returns | 37% | 21% |
| Not willing to take financial risks | 14% | 38% |
| Started a successful business | 12% | 3% |
Note: "Successful business" is defined as a business of net worth greater than $100,000. Households are assigned to the category "born to a wealth" if the sum of their inheritances received and their expected inheritances exceeds $1,000,000 (in real 2016 dollars).
Source: Survey of Consumer Finances, Federal Reserve Board.
The evidence from the SCF presented here is strongly suggestive that intergenerational wealth transmission plays an important role in helping to explain wealth concentration. However, the extent to which and specific ways in which transfers affect concentration can only really be addressed in the context of a fully-specified model in which all of the various channels are operative and calibrated to match the data. Such a model would need to consider also the behavior of those giving the transfers, stemming perhaps from the so-called bequest motive and other altruistic tendencies.18 The facts presented here provide an important set of benchmarks that can be used to evaluate how various model-based explanations for wealth concentration stack up against what we now know about intergenerational transfers.19
References
Alvaredo, Facundo, Bertrand Garbini, and Thomas Piketty. 2017. "On the Share of Inheritance in Aggregate Wealth: Europe and the USA, 1900–2010," Economica (84): 239–260.
Boserup, Simon H., Wojciech Kopczuk, and Claus T. Kreiner. 2016. "The Role of Bequests in Shaping Wealth Inequality: Evidence from Danish Wealth Records," University of Copenhagen. (January)
Bricker, Jesse, Lisa J. Dettling, Alice Henriques, Joanne W. Hsu, Lindsay Jacobs, Kevin B. Moore, Sarah Pack, John Sabelhaus, Jeffrey Thompson, and Richard A .Windle. 2017. "Changes in U.S. Family Finances from 2013 to 2016: Evidence from the Survey of Consumer Finances," Federal Reserve Bulletin, 103(3): 1-42. (September)
Bricker, Jesse, Alice Henriques, Jacob Krimmel, and John Sabelhaus. 2016. "Measuring Income and Wealth at the Top Using Administrative and Survey Data," Brookings Papers on Economic Activity, 1:2016, p. 261-321.
Carroll, Christopher, Jiri Slacalek, Kiich Tokuoka, and Matthew N. White. 2017. "The Distribution of Wealth and the Marginal Propensity to Consume," Quantitative Economics, 8: 977-1020.
Chetty, Raj, John N. Friedman, Emmanuel Saez, Nicholas Turner, and Danny Yagan. 2017. "Mobility Report Cards: The Role of Colleges in Intergenerational Mobility," NBER Working Paper No. 23618. (July)
De Nardi, Mariacristina, 2004. "Wealth Inequality and Intergenerational Links," Review of Economic Studies 71(3): 743-768.
De Nardi, Mariacristina. 2016. "Savings and Wealth Inequality," Plenary talk given at the Society of Economic Dynamics in Toulouse. Available at http://users.nber.org/~denardim/research/research.html.
Elinder, Mikael, Oscar Erixson, and Daniel Waldenstrom. 2016. "Inheritance and Wealth Inequality: Evidence from Population Registers," CEPR Working Paper DP11191.
Fagerang, Andreas, Luigi Guiso, Davide Malacrino, and Luigi Pistaferri. 2016. "Heterogeneity and Persistence in the Returns to Wealth," NBER Working Paper 22822. (November)
Gale, William G., and John Karl Scholz. 1994. "Intergenerational Wealth Transfers and the Accumulation of Wealth," Journal of Economic Perspectives, 8(4): 145-160. (Fall)
Holtz-Eakin, Douglas, David Joulfaian, and Harvey Rosen, 1993. "The Carnegie Conjecture: Some Empirical Evidence," Quarterly Journal of Economics¸108(2): 413-435.
Hurst, Erik and Annamaria Lusardi, 2004. "Liquidity Constraints, Household Wealth, and Entrepreneurship," Journal of Political Economy 112(2): 319-348.
Kopczuk, Wojciech and Joseph P. Lupton, 2007. "To Leave or Not to Leave: The Distribution of Bequest Motives," Review of Economic Studies 74: 207-235.
Kotlikoff, Laurence J., and Lawrence H. Summers. 1981. "The Role of Intergenerational Transfers in Aggregate Capital Accumulation," Journal of Political Economy, 89: 706-732. (August)
Modigliani, Franco. 1988. "The Role of Intergenerational Transfers and the Accumulation of Wealth," Journal of Economic Perspectives, 2: 15-40. (Spring)
Saez, Emmanuel, and Gabriel Zucman. 2016. "Wealth Inequality in the United States since 1913: Evidence from Capitalized Income Tax Data." Quarterly Journal of Economics, 131(2): 519-578.
Wolff, Edward. 2002. "Inheritances and Wealth Inequality, 1989-1998," American Economic Review, 92, 260-264.
1. Although there is widespread agreement that wealth concentration is "high and rising" there is some disagreement about how high and how fast. See, in particular, the differences between Saez and Zucman (2016), who rely on inferring wealth from administrative data on income flows, versus Bricker, Henriques, Krimmel, and Sabelhaus (2016), who use a combination of survey and administrative measures with direct observations on wealth holdings. Return to text
2. The long-standing debate in macroeconomics about the role of wealth transfers in aggregate wealth accumulation goes back to Kotlikoff and Summers (1981), who introduced a very stylized method for converting inheritance flows into wealth stocks, and estimated that 80 percent of the aggregate capital stock is accounted for by wealth transfers. Modigliani (1988) questioned some aspects of their methodology, and estimated that transfers only account for something like 20 percent of aggregate wealth. A more recent estimate from Gale and Scholz (1994) is about 50 percent, and unlike the earlier papers, they specifically account for inter vivos transfers. Return to text
3. The latest SCF findings (for the 2016 survey wave) are described in Bricker, Dettling, Henriques, Hsu, Jacobs, Moore, Pack, Sabelhaus, Thompson, and Windle (2017). The appendix to that report also includes a detailed explanation of the survey methodology, including the "oversampling" of wealthy families that is essential for capturing intergenerational transfers made and received by the very wealthy. Return to text
4. The inheritance measure in the SCF excludes transfers to surviving spouses. Details about how the SCF data was used to create the figures in this Note are available from the authors, including an important validation exercise on transfers at death that compare this reported inheritance distribution to a simulated distribution based on SCF wealth holdings and mortality rates. The two distributions and aggregate flows are nearly identical, which indicates that the survey is doing a good job capturing inheritances. Return to text
5. The SCF treatment of inter vivos transfers is somewhat limited for conceptual reasons, because some respondents report making transfers that include in-kind payments (such as tuition and other college expenses) while the survey does not attempt to capture the receipt of such transfers. The inter vivos transfers in Figure 2 are limited to respondent-reported receipt of large gifts of financial and tangible assets. Return to text
6. Income here is defined as the amount of annual income that respondents report "usually" receiving each year. This measure of income is more stable over time than current income and tends to be a closer proxy to permanent income for households. Return to text
7. These profiles are estimated using regressions (logit for the probability, and OLS for the conditional amount) against cubic polynomials in age and dummies for income and education groups. Return to text
8. The income percentiles along with the net worth percentiles (used later) are calculated for each age using quantile regressions. Thus, the "top 10 percent" refers to those households that are in the top 10 percent of the income (or net worth) distribution conditional on the age of the household head. Return to text
9. The analysis of transfers in the previous sections is based on inheritances and inter vivos transfers received in the three years preceding the survey. In this section we switch to using the SCF information about all inheritances ever received. In a background document available from the authors, we show that reported transfers during overlap periods (every incremental survey includes the inheritance years covered by the previous survey plus three new years) line up as expected, given that some of the respondents from the earlier surveys have died off. Return to text
10. The old debate about the role of intergenerational transfers in aggregate wealth used a similar conceptual framework, but based on aggregate inheritance flows and assumptions about both timing of receipt and interest rates. The key conceptual innovation here is that in the SCF we directly observe the timing and distribution of transfer receipt at the micro level. Return to text
11. A recent paper by Alvaredo, Garbini, and Piketty (2017) uses the approach from the older literature to study aggregate inheritance shares over the past century in Europe and the US. The authors conclude that inheritances--after falling as a share of aggregate wealth for most of the 20th century--have now begun to increase. However, they also point out that administrative data on inheritances for the US is very limited and getting worse over time because of rising estate tax filing thresholds, which underscores the need for high-quality survey data such as the SCF. Return to text
12. Fagerang, Guiso, Malacrino, and Pistaferri (2016) provide evidence of heterogeneity and persistence in returns to wealth that would amplify these conclusions and give more weight to transfers in accounting for wealth concentration. If, as they show, higher wealth families have higher average rates of return, we can attribute a higher share of their wealth to intergenerational transfers than we would for other families. For example, in the context of Table 2, one might use the 5 percent line for high wealth families, and the 3 percent line for all others. Return to text
13. Some notable papers, including Wolff (2002), Elinder, Erixson, and Waldenstrom (2016), and Boserup, Kopczuk, and Kreiner (2016) have reported that inheritances reduce wealth inequality. Their results derive from the basic fact that the distribution of inheritance wealth, while highly concentrated, is not as concentrated as the distribution of total wealth. Thus, in a counterfactual scenario in which inheritance wealth is removed from current wealth for all individuals without redistribution, measures of relative wealth inequality (such as wealth shares at the top of the distribution) increase. Our exercise deviates from theirs in two ways. First, we consider a counterfactual scenario in which inheritance wealth is redistributed equally among individuals. Second, we do not re-sort individuals when we calculate the wealth shares in the counterfactual. Re-sorting would have reduced the effects reported in Table 3, although the inequality measures would have still be reduced in the counterfactual that includes redistribution. As with the exercises in the above mentioned studies, our exercise is not intended to provide a definitive measure of the effect of inheritances on inequality, which would require a richer model that includes bequest motives. Instead, ours is to simply illustrate the extent to which transfers have the potential to shift the wealth distribution. Return to text
14. A typical assumption in heterogeneous agent models is that bequests at death are accidental and distributed equally, which may be an important reason why those models have difficulty explaining observed wealth concentration. One simple take away from the results here is that calibrated models should build in more realistic transfer profiles across different type of agents. Return to text
15. The literature on heterogeneous returns to human capital is much too extensive to summarize here, but one particularly relevant recent contribution is by Chetty, Friedman, Saez, Turner, and Yagan (2017). They use detailed micro data that links parent's earnings, college attendance, and children's earnings to show how different colleges affect intergenerational mobility. Although it is not the main point of the paper, they observe that the likelihood of attending a very selective college, which tends to have a substantial impact on earnings, is strongly associated with parental resources. Return to text
16. See Holtz-Eakin, Joulfaian, and Rosen (1993). Return to text
17. See, for example, Hurst and Lusardi (2004). Return to text
18. There exists a large literature on bequest motives. For recent examplea, see De Nardi (2004) and Kopczuk and Lupton (2007). Return to text
19. Carroll, Slacalek, Tokuoka, and White (2017) provide an example of a model that generates observed wealth concentration by assuming there are differences in "patience" between dynastic and other families. De Nardi (2016) provides a rich overview of the many different model features that can all contribute to explaining wealth concentration. In sum, there are many plausible explanations for wealth concentration, and the key is to isolate the operative channels and think about how policy affects those channels. Return to text
Feiveson, Laura, and John Sabelhaus (2018). "How Does Intergenerational Wealth Transmission Affect Wealth Concentration?," FEDS Notes. Washington: Board of Governors of the Federal Reserve System, June 1, 2018, https://doi.org/10.17016/2380-7172.2209.
Disclaimer: FEDS Notes are articles in which Board staff offer their own views and present analysis on a range of topics in economics and finance. These articles are shorter and less technically oriented than FEDS Working Papers and IFDP papers.