FEDS Notes
November 14, 2018
Intercorporate Equity Holdings in the Financial Accounts of the United States
Joseph Briggs and Hannah Hall
Nonfinancial corporations often invest in other corporations by purchasing equity. Such investments might reflect private or public equity purchases, and might be made for strategic reasons (e.g., access other markets, complementarity to current investments, investments in associates) or as passive investments (Beechy, Trivedi, and MacAulay 2010). In the framework of the Financial Accounts, such investments are termed "intercorporate equity holdings."
Intercorporate equity holdings are an important component of the aggregate corporate balance sheet. Historically, such investments have averaged 8% of total US public equity outstanding, and in 2018 Q2 they totaled almost $1.9 trillion. Prior to the September 2018 publication, the Financial Accounts of the United States showed the equity liability of the nonfinancial corporate sector net of these intercorporate equity investments. As of the current release, we now show both the gross liability, and an asset to represent the intercorporate equity holdings of nonfinancial corporations. We also made significant improvements to their valuation. This FEDS Note details these changes and highlights the new data on intercorporate equity investments available in the Financial Accounts.
Presentation in the Financial Accounts
In previous publications intercorporate equity holdings of domestic nonfinancial corporations were subtracted from the total outstanding equity issues (L.223, line 3), and thus we did not show an equity asset for this sector. In our new publication, we no longer net the intercorporate holdings from the equity issues, and we introduce a new asset line (line 12) in our Corporate Equities table (L.223) to reflect the equity issues held by nonfinancial corporations.1 This results in an upward revision in total outstanding equity (L.223, line 3) and introduces corporate equities as a new asset held by nonfinancial corporations (L.223, line 12), but leaves the net equity liability of public nonfinancial corporations (L.223, line 3 minus line 12) unchanged (other than changes to the valuation methodology discussed below).
Valuing intercorporate equity holdings
We also change our method for valuing equity holdings of corporations. In previous publications, intercorporate holdings were calculated by first totaling Standard and Poor's Compustat's main measure of equity holdings in other firms (Investments and Advances -- Equity Method, IVAEQ) and then multiplying this total by three to convert to approximate market value.2 Since this used annual data, we assumed constant growth throughout each year to calculate the quarterly levels. This calculation began in 1996, prior to which intercorporate holdings were assumed to be zero.
Our revised calculation makes three adjustments to the method described above. First, we account for a second Compustat variable (Investments and Advances -- Other, IVAO) that includes equity holdings via block ownership stakes in other corporations and other long-term investments. Cardella, Fairhurst, and Klasa (2018) find that block ownership stakes and long-term investments account for approximately 10% and 50% of IVAO, respectively. We estimate that 20% of long-term investments are equity, implying that 20% of the total value of IVAO should be included in our estimate of intercorporate equity holdings.3 Second, instead of assuming a constant market-to-book ratio of three when adjusting intercorporate holdings to market value, we use the quarterly market-to-book ratio of the S&P 500 to bring the total of IVAEQ and 20% of IVAO to market valuation. The total value of intercorporate holdings can therefore be expressed as
$$$$ {FL}_{y1,Q4} = ({IVAEQ}_{y1} + .2*{IVAO}_{y1} ) * {{mkt}_{y1}/bk}_{y1} $$$$
for the fourth quarter of a given year. Starting with the previous year's fourth quarter level, Q1-Q3 levels are calculated as the last quarter's level grown with the current quarter's stock return plus the quarterly transaction (transaction calculations are described in the next section):
$$$$ {FL}_{y1,Qi} = {FL}_{y1,Qi-1} * r_{y1,Qi} + {FU}_{y1,Qi} $$$$
Third, we extend our intercorporate holdings series to begin in 1963, the first year for which our main variables are available.
Calculating net investment in intercorporate equity holdings
In prior publications no net investment in the intercorporate equity holdings series existed. To create these series, we impute annual net investment as the unexplained annual change in intercorporate equity holdings and distribute the annual change over quarterly transactions.
The annual net transaction is defined as the difference between the observed Q4 intercorporate holdings and last year's Q4 intercorporate holdings grown by current year equity returns:
$$$$ {FU}_{y1,Annual} = {FL}_{y1,Q4} - ({FL}_{y0,Q4} * r_{y1} ). $$$$
Annual transactions are then evenly distributed across quarters but divided by rest-of-the-year stock returns to account for within year capital appreciation:
$$$$ {FU}_{Qi} = \frac{1}{4} {FU}_{Annual} \times \prod_{j=i+1}^4 \frac{1}{r_{y1,Qj}} $$$$
The adjustment for capital appreciation guarantees internal consistency of quarterly transactions, annual transactions, and annual changes in levels.
Results:
Figure 1 presents our new intercorporate equity holdings series and compares it to the series in previous publications. In addition, Figure 2 presents the corresponding series as a share of total equity outstanding. There are four key takeaways from these figures. First, the new series extends back much further historically. Second, intercorporate holdings are large. These holdings represent 8% of total equity outstanding on average with shares peaking around 14% in 2002. Third, on average the new series has been revised upward, reflecting our accounting for additional equity holdings not reported in IVAEQ. Finally our new intercorporate holdings series better captures market fluctuations. For example, Figure 1 shows that the value of intercorporate holdings increased and fell rapidly during the dotcom boom and bust, consistent with the overall market. More recently, Figure 2 shows that our previous series implied a decrease in intercorporate equity holdings relative to total equity outstanding from 2013-2018. After accounting for the rise in market to book value over this period we instead see that this ratio is relatively unchanged over the past 5 years.
Figures 3 and 4 present corresponding figures for the new net transaction series, with Figure 3 presenting the level of changes and Figure 4 presenting changes relative to total equity outstanding. We observe that net investment, both on an absolute and relative basis, peaked in 1999. In contrast, net investment bottomed on a relative basis in 1988 and an absolute basis in 2006. Net transactions have been modest post-crisis, although net transactions ticked down in 2017.
References:
Beechy, Thomas, Umashanker Trivedi, and Kenneth MacAulay. "Advanced Financial Accounting". Toronto, Ontario: Pearson Education Canada, 2010. 6th Edition.
Cardella, Laura, Douglas Fairhurst, and Sandy Klasa. "What Determines the Composition of a Firm's Total Cash Reserves?" (2016). Working Paper.
Desai, Mihir. "Taxing Corporate Capital Gains." Tax Notes 110.9 (2006): 1-2.
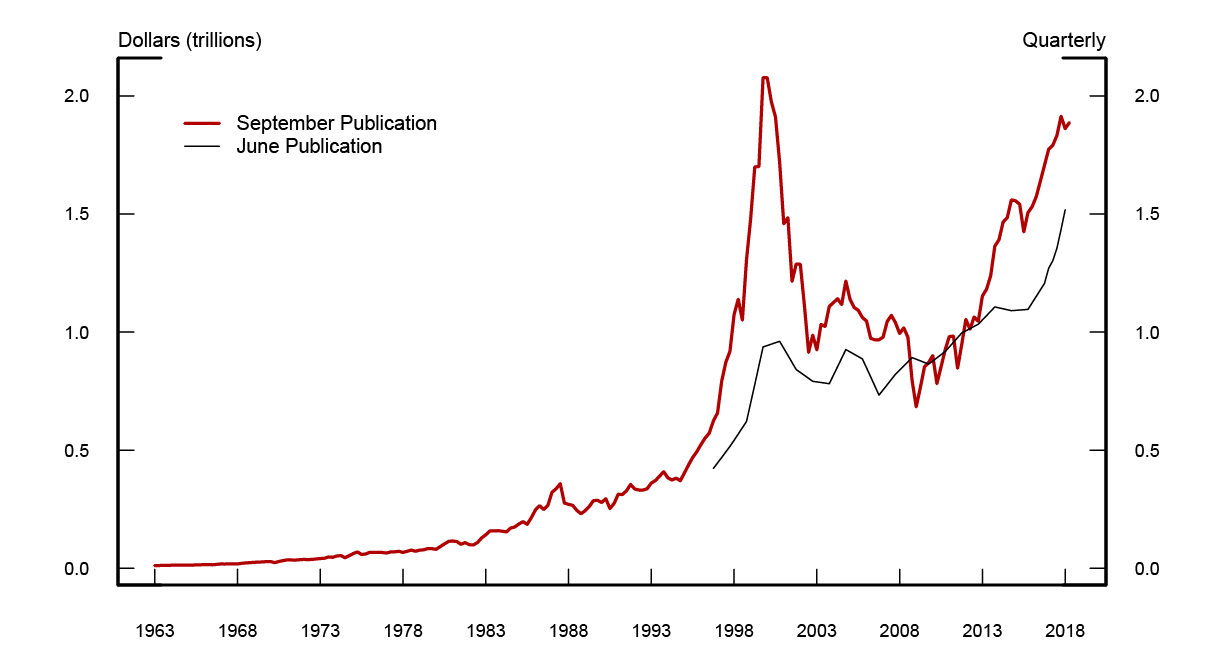
Source: Financial Accounts of the United States.
Figure 2: Intercorporate Equity Investments by Public Nonfinancial Corporations as Share of Total Equity Outstanding
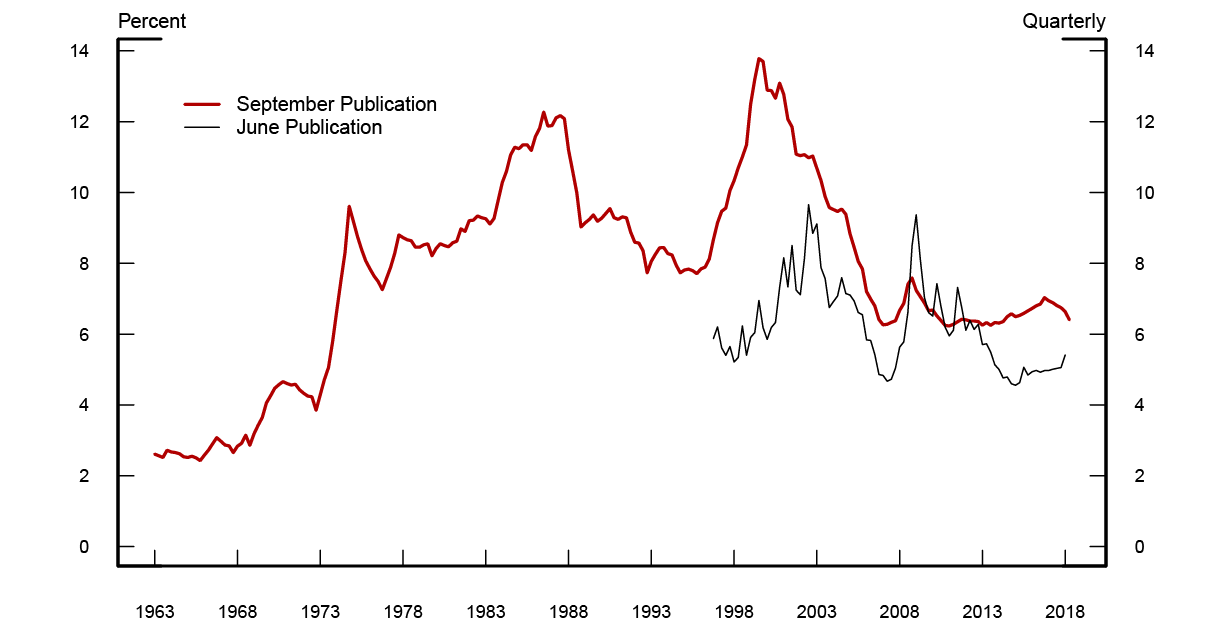
Source: Financial Accounts of the United States.
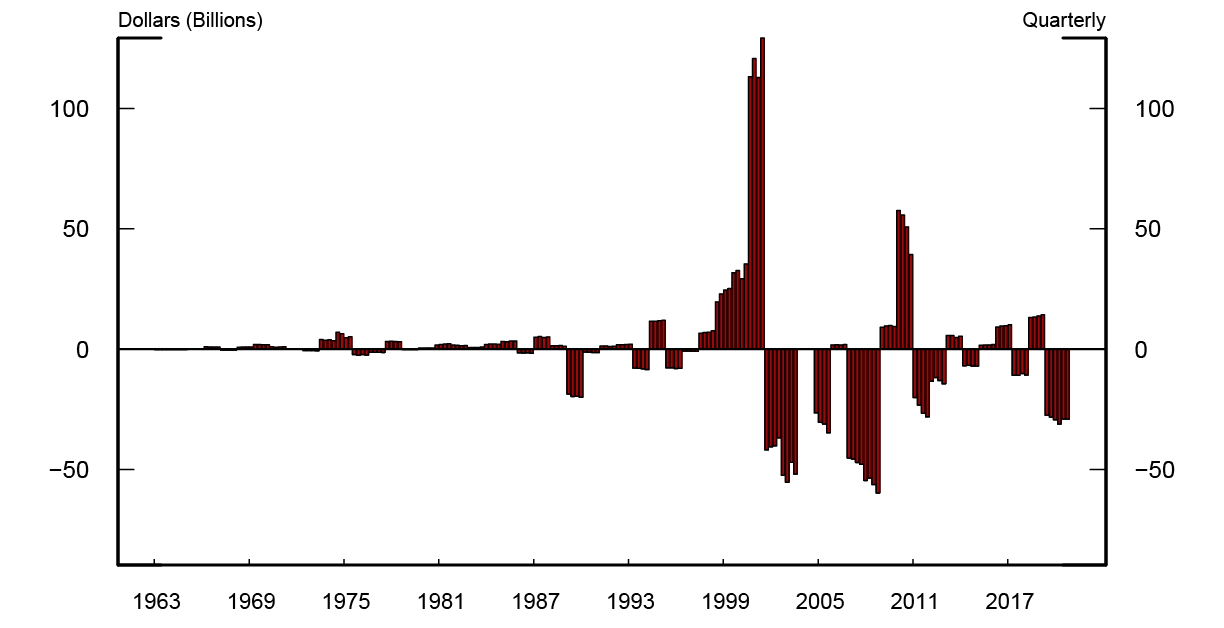
Source: Financial Accounts of the United States.
Figure 4: Changes in Intercorporate Equity Investments by Public Nonfinancial Corporations as Share of Total Equity Outstanding
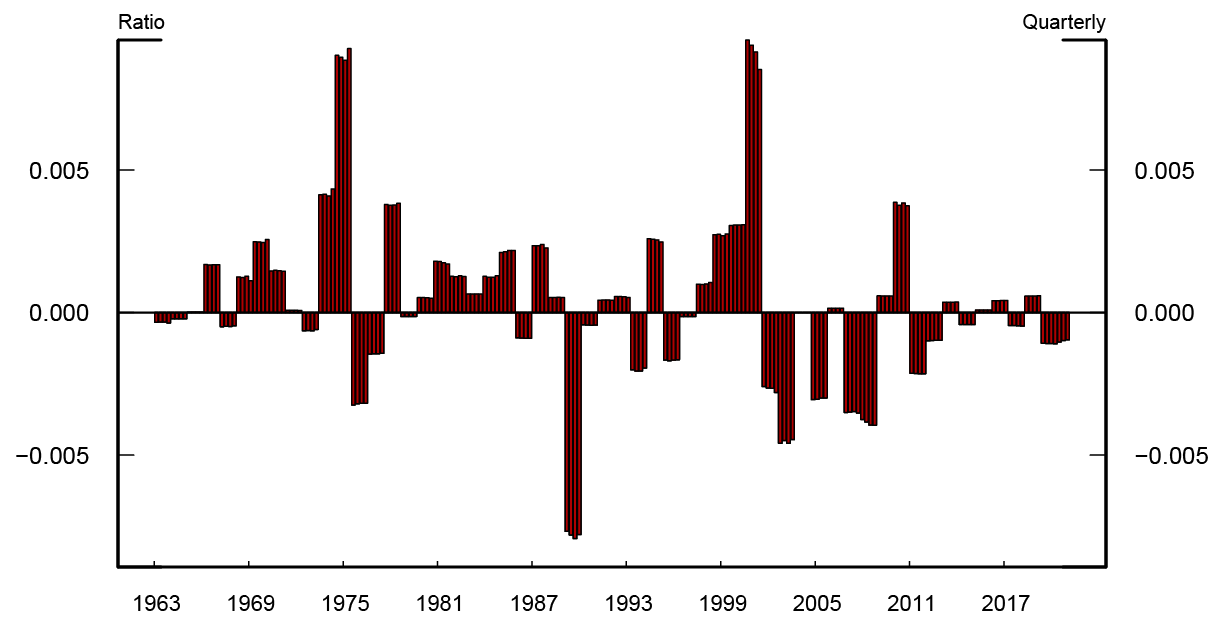
Source: Financial Accounts of the United States.
1. This change makes our presentation of nonfinancial corporations more similar to other sectors for which asset holdings were previously shown. Return to text
2. Desai (2006) notes that IVAEQ represents the book value of investments which likely understates the market value of investments recorded in public financial statements. Return to text
3. The overall estimate for equity holdings captured in IVAO is the sum of 10% equity from block ownership stakes and 50%×20% equity from long term investments. Return to text
Briggs, Joseph, and Hannah Hall (2018). "Intercorporate Equity Holdings in the Financial Accounts of the United States," FEDS Notes. Washington: Board of Governors of the Federal Reserve System, November 14, 2018, https://doi.org/10.17016/2380-7172.2281.
Disclaimer: FEDS Notes are articles in which Board staff offer their own views and present analysis on a range of topics in economics and finance. These articles are shorter and less technically oriented than FEDS Working Papers and IFDP papers.