FEDS Notes
June 16, 2017
Principal Payments on the Federal Reserve's Securities Holdings
Brian Bonis, John Kandrac, and Luke Pardue1
As noted in the Policy Normalization Principles and Plans issued in September 2014, when the Federal Open Market Committee (FOMC) judges that it is appropriate to begin the process of normalizing the size of the balance sheet, it intends to gradually reduce the Federal Reserve's holdings of Treasury securities and agency debt and agency mortgage-backed securities (MBS). In a June 2017 addendum to the Policy Normalization Principles and Plans, the FOMC provided more information describing how it will decrease the reinvestment of principal payments received on the securities held in the System Open Market Account (SOMA). This note provides data sources for information on current SOMA holdings and offers background information to help understand how principal payments on SOMA securities combined with a change in reinvestment policy will reduce these holdings.
Current SOMA Holdings
As of June 7, 2017, the Federal Reserve's $4.2 trillion domestic SOMA portfolio was composed of $2.5 trillion in Treasury securities, $1.8 trillion in agency MBS, and $9 billion in agency debt securities.
Detailed information regarding SOMA securities holdings is available on the Federal Reserve Bank of New York (FRBNY) SOMA Holdings website. The SOMA holdings data are updated weekly on Thursdays, with data as of the prior Wednesday, and include information such as the maturity date, coupon, individual security identifier, and face (par) value for each security held in the SOMA. Table 2 of the Federal Reserve's weekly H.4.1 release, found on the Board of Governor's website and shown below, reports the SOMA's aggregate securities holdings by remaining maturity for different time horizons.
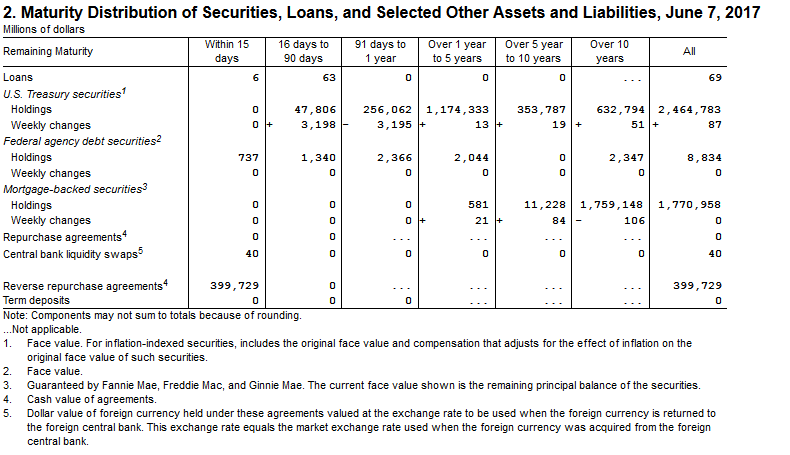
As of June 7, 2017, nearly $48 billion of Treasury securities held in the SOMA were scheduled to mature within three months, with about 60 percent of the Treasury portfolio maturing within five years. The face value of Treasury securities maturing over any time horizon can be calculated by downloading the Treasury data from the FRBNY SOMA holdings website and summing the par values by maturity date.2
Turning to MBS, the table shows that there are no securities maturing in the next year and only about $12 billion maturing within the next 10 years. However, MBS generate principal payments each month prior to maturity (reflecting both scheduled and unscheduled principal payments on the underlying mortgages) and, as will be explained in more detail below, are subject to some uncertainty. As a result of this uncertainty, projections of monthly MBS principal payments must be estimated based on statistical models. For example, principal payments on SOMA MBS holdings during the second half of 2016 averaged roughly $37 billion per month while principal payments on SOMA MBS holdings during the first half of 2017 averaged roughly $23 billion per month.
SOMA holdings of agency debt are small relative to holdings of Treasuries and MBS, and currently stand at less than $9 billion in total, half of which will mature by mid-2018.
Maturing Treasury Holdings
The SOMA Treasury portfolio consists of Treasury securities with varying maturities. The portfolio is primarily composed of nominal notes and bonds with maturities that occur on the 15th day of the month and the last day of the month. Somewhat larger maturities of Treasury securities held in the SOMA tend to occur on the mid-month of each quarter (February, May, August, and November) due to the schedule the U.S. Treasury uses to issue its securities.3
Over the next two years, an average of about $30 billion in SOMA Treasury securities will mature each month. As illustrated in figure 1, the monthly face value of maturing SOMA Treasury holdings is variable due to the portfolio's composition and Treasury maturity patterns. The minimum face value maturing each month is about $9 billion and the maximum face value is nearly $60 billion.
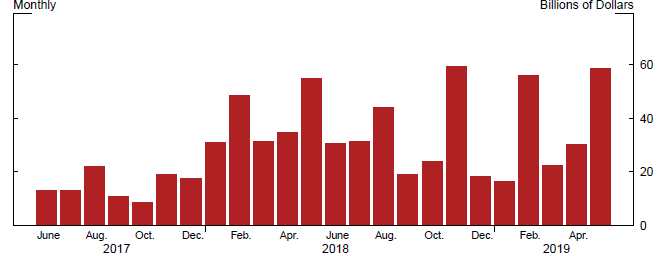
Based on SOMA holdings as of June 7, 2017.
MBS Principal Payments
Monthly MBS principal payments reflect two components. First, because MBS are backed by fully amortizing mortgage loans that are paid off according to the amortization schedule over the life of the loan, MBS investors receive regular amortization payments. Second, MBS principal payments include an unscheduled component that largely reflects homeowners exercising their option to prepay part or all of their remaining principal balance.
The scheduled amortization payment for each security can be calculated using a standard formula that depends upon the remaining principal balance of the MBS.4 However, unscheduled principal prepayments introduce cash flow uncertainty for MBS investors, which can make total receipts of principal--both in the current period and in future periods--difficult to project. Consequently, financial market participants put considerable effort into forecasting prepayments.
Sophisticated prepayment models typically forecast different sources of unscheduled prepayments separately, often using characteristics of the borrowers and mortgages that underlie the MBS. Some major sources of prepayments and their determinants are as follows:5
-
Turnover – Turnover refers to the rate at which outstanding mortgages are paid off in full due to the sale of a home. The rate of turnover in the housing stock is affected by many things, including home price appreciation, the state of the economy, net household formation, and seasonality.
-
Refinancing – Refinancing occurs when homeowners take out a new mortgage in order to pay off their existing mortgage. Typical motivations for refinancing include extracting home equity (a "cash-out" refinancing) and, if interest rates have fallen sufficiently, reducing monthly payments (a "rate" refinancing). Rate refinancing is by far the more common motivation, which causes mortgage prepayments to vary substantially with prevailing interest rates. As rates fall, borrowers face an incentive to engage in rate refinancing, boosting unscheduled principal payments.
-
Curtailment – Curtailment payments describe borrowers' principal prepayments made over and above the scheduled amount. These payments reduce the outstanding mortgage balance, hastening the time to full repayment. Curtailments can be related to the amortized loan-to-value ratio, with extra payments tending to increase as the loan balance falls.
-
Buyout – Buyouts, or involuntary prepayments, occur when borrowers default on their loans, or become sufficiently delinquent that the agency guarantor fulfills its commitment to pay the remaining principal balance to the investor. Prepayments on MBS due to buyouts can depend on the state of the economy, with delinquencies typically increasing as unemployment rises.
There are some simple methods that are sometimes used to provide a rough estimate of prepayments. For example, under the benchmark model developed by the Public Securities Association known as the "PSA-100", the prepayment rate is assumed to be 0.2 percent (annualized) in the first month of the life of an MBS and increase by an additional 0.2 percentage points each month. Beginning in the 30th month, the PSA-100 model assumes a constant prepayment rate of 6 percent.
Another relatively simple framework for projecting prepayment rates is described in Richard and Roll (1989).6 In this model, a seasonality factor is combined with a refinancing incentive, a more complex aging process, and a "burnout" component, which describes the evolving sensitivity of prepayments to interest rates over time for a given MBS. A simplified version of this model is used to forecast principal prepayments on SOMA MBS holdings in Carpenter et al. (2015).7
Future Securities Purchases
In order to more precisely project the maturity profile of SOMA securities into the future, it is necessary to account for future purchases that will add new securities to the SOMA portfolio because these securities will affect total principal receipts as they mature or pay down. In general, though, the value of SOMA maturities resulting from reinvestment purchases will be small relative to maturities resulting from existing securities holdings.
Reinvestment purchases of Treasury securities can be projected by taking the maturity schedule of SOMA's Treasury holdings, and making some assumptions about the Treasury's future auctions and the date that the FOMC implements the change in reinvestment policy. Under the Committee's current operational approach to reinvestments, SOMA's maturing Treasury securities are rolled into Treasury securities issued on the same day that the current holdings mature. If multiple Treasury security auctions settle on the day SOMA Treasury holdings mature, the proceeds from the maturing securities are allocated proportionally across the auctions according to the announced offering amount for each new security.8,9 Given that the shortest tenor for a Treasury coupon security is two years, the Treasury securities that are rolled over will mature at least two years later.
SOMA's agency debt holdings are currently reinvested into agency MBS upon maturity. Because the Federal Reserve no longer purchases agency debt, SOMA agency debt holdings will fall to zero by July 2032 whether the maturing securities are redeemed or reinvested into MBS.
Similar to agency debt, the current reinvestment policy for SOMA's agency MBS holdings prescribes reinvestment in agency MBS.10 Newly purchased MBS will receive principal payments as a result of amortization payments and prepayments, as discussed earlier. Consequently, MBS reinvestment purchases in turn affect future MBS principal payments for the SOMA portfolio. Agency reinvestment purchases are concentrated in newly-issued fixed-rate agency MBS guaranteed by Fannie Mae, Freddie Mac, and Ginnie Mae. More detail on the Federal Reserve's MBS reinvestment practices can be found on the Federal Reserve Bank of New York's website.
Once the FOMC decides to change its reinvestment policy, principal payments will be reinvested only to the extent that they exceed pre-specified monthly dollar "caps." That is, reinvestments in a given month will equal the amount of principal payments that exceed the cap. The caps will rise gradually at quarterly intervals over a 12-month period and the value of the caps at the end of the 12-month period will then be maintained until the size of the balance sheet is normalized. This Q&A offers examples and more information regarding the caps and implementation of the FOMC's reinvestment policy.
1. We thank Kathryn Chen, James Clouse, Jane Ihrig, Thomas Laubach, Deborah Leonard, Brian Madigan, Ellen Meade, Dave Na, and Julie Remache for comments. Return to text
2. To calculate the total principal of a maturing TIPS security, the inflation compensation value must be added to the par value of the security. Return to text
3. 10-year notes and 30-year bonds mature on the 15th of the mid-month of each quarter. 2-, 5-, and 7-year fixed-rate notes mature on the last day of the month and 3-year notes mature on the 15th of the month. For more information on Treasury securities and settlement patterns, please see https://www.treasurydirect.gov/instit/auctfund/work/auctime/auctime.htm. Return to text
4. Scheduled principal payments, or amortization, can be calculated for each MBS separately each month using information on the weighted-average coupon (WAC), the remaining principal balance (RPB) at the beginning of the month, and the remaining term, calculated as the original weighted-average maturity (WAM) of the MBS minus the number of months since issuance (t): $$$$ {Scheduled\ Payment}_t = {RPB}_{t-1} \cdot \left[ \frac{\frac{{WAC}_t}{12} \cdot \left( 1+\frac{{WAC}_t}{12} \right)^{{WAM}-t+1}}{\left( 1+\frac{{WAC}_t}{12} \right)^{{WAM}-t+1}-1} \right] - {RPB}_{t-1} \cdot \frac{{WAC}_t}{12} $$$$ Return to text
5. Borrower and mortgage-level information such as FICO score, loan size, third-party mortgage origination status, age of the mortgage, etc., are also often used to forecast each source of prepayment. Return to text
6. S. F. Richard and R. Roll (1989). "Prepayments on fixed-rate mortgage-backed securities," The Journal of Portfolio Management, 15(3), 73-82. Return to text
7. Seth Carpenter, Jane Ihrig, Elizabeth Klee, Daniel Quinn, and Alexander Boote (2015). "The Federal Reserve's Balance Sheet and Earnings: A Primer and Projections," International Journal of Central Banking, vol. 11, no. 2, pp. 237-283. Return to text
8. Ahead of the settlement date, the Federal Reserve places bids at Treasury auctions as noncompetitive tenders that are treated as add-ons to announced auction sizes. It is worth noting that SOMA Treasury bills are rolled over into bills and SOMA Treasury coupon securities (i.e. notes, bonds, TIPS, and FRNs) are rolled over across all non-bills. SOMA currently does not hold any Treasury bills. Return to text
9. For a hypothetical example and more information on Treasury rollovers, see FRBNY's Treasury Rollovers FAQs. Return to text
10. The guarantors of agency MBS announce actual prepayment rates each month for their outstanding MBS based on the principal received from mortgage borrowers. The Federal Reserve's Open Market Desk uses this information to determine the amount of MBS purchases that are required to offset total principal payments on SOMA MBS holdings, and announces scheduled reinvestment purchases regularly on the Federal Reserve Bank of New York's website. Return to text
Bonis, Brian, John Kandrac, and Luke Pardue (2017). "Principal Payments on the Federal Reserve's Securities Holdings," FEDS Notes. Washington: Board of Governors of the Federal Reserve System, June 16, 2017, https://doi.org/10.17016/2380-7172.2021.
Disclaimer: FEDS Notes are articles in which Board staff offer their own views and present analysis on a range of topics in economics and finance. These articles are shorter and less technically oriented than FEDS Working Papers and IFDP papers.