FEDS Notes
August 04, 2023
The Restrained Recovery of State and Local Government Payrolls from the Pandemic Recession
David Cashin, Byron Lutz, William Peterman, David Ratner, and Sarah Rodman
On the eve of the outbreak of the COVID-19 pandemic, state and local government (S&L) employment in the U.S. stood at 20 million. In the first three months of the pandemic, S&L payrolls plunged 1.5 million (Figure 1) as social distancing reduced the need for many government services, such as in-person schooling, and S&L governments feared sharp revenue declines. By Spring 2021, however, S&L governments found themselves in their strongest budget position in 50 years, as the federal government provided historic levels of aid and S&L tax revenues proved resilient. And yet, despite the strong budget positions and the waning of social distancing, the level of S&L payrolls has not returned to its pre-pandemic peak let alone its pre-COVID trend. In this note, we argue that the recovery in S&L payrolls has been quite restrained. We then highlight two factors—anemic wage growth relative to the private sector and an elevated rate of early retirements—that have likely hampered the sector's recovery. We conclude with some thoughts on the outlook for S&L employment growth going forward.
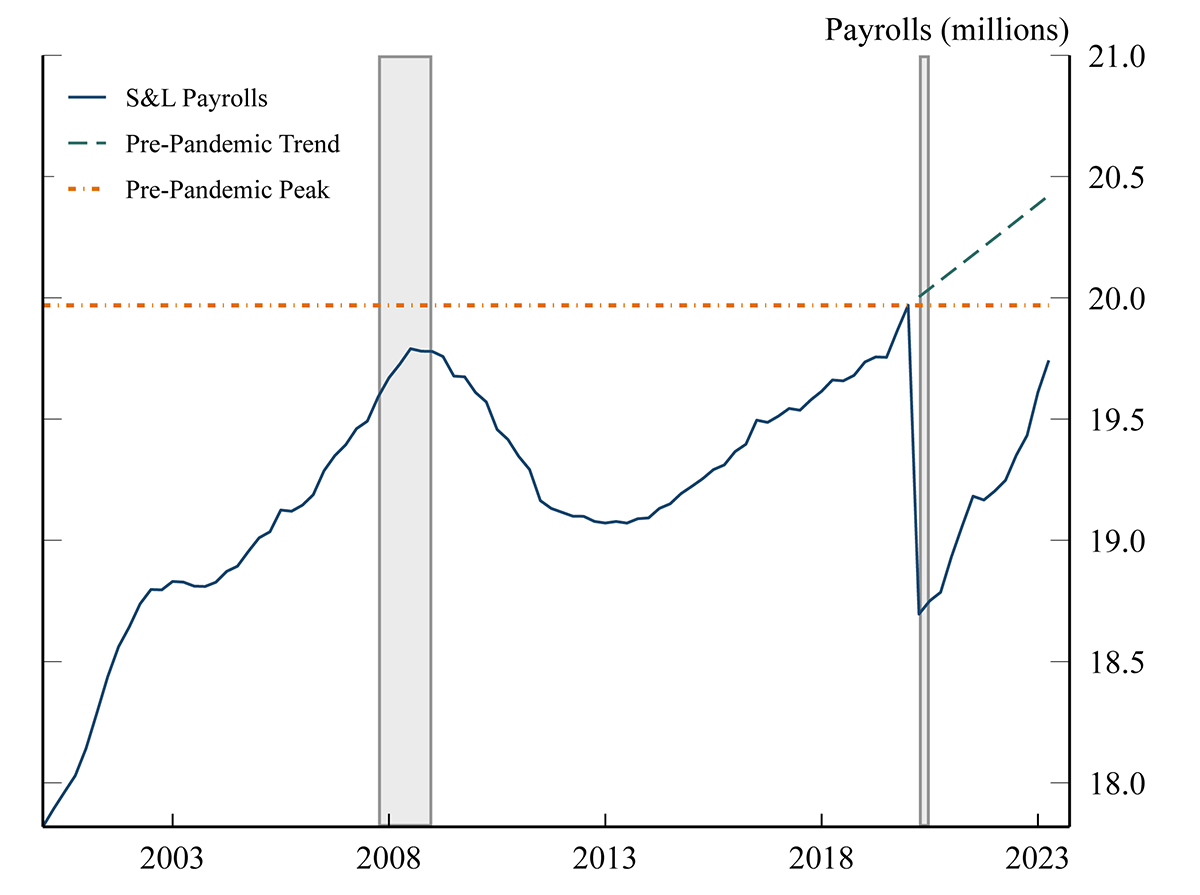
Note: For the pre-pandemic trend line, we assume that, after February 2020, S&L payrolls continued to grow by 11,000 per month, their average monthly pace from 2015 to 2019. The shaded bars indicate periods of business recession as defined by the National Bureau of Economic Research (NBER): December 2007-June 2009 and February 2020-April 2020
Source: Bureau of Labor Statistics and author calculations.
The recovery in S&L payrolls from the pandemic recession has been slower than expected.
In the years preceding the COVID-19 pandemic, S&L employment grew very sluggishly; indeed, it only reached its pre-Great Recession peak in 2019. With the onset of the pandemic, S&L employment contracted sharply as social distancing led to the reduction of government services, many of which were in person. For example, public schools and libraries closed and public transit services were cut back significantly as ridership plummeted.1 In addition, governments feared potential revenue losses double the severe declines they experienced during the Great Recession (NASBO, Spring 2020). After 3 months of contraction, payrolls bottomed out in May 2020 at a level 7 1/2 percent below the pre-pandemic peak and then began to recover.
Over the next few years, thanks in large part to the federal government's COVID-related relief measures, the S&L sector would find itself in its strongest budget position in decades. First, the federal government provided the S&L sector with over $250 billion in aid in the Spring of 2020 as part of the Families First Coronavirus Response Act and the Coronavirus Aid, Relief, and Economic Security Act (CARES), followed by nearly $700 billion in additional aid in Winter 2021 as part of the Consolidated Appropriations Act (CAA) and American Rescue Plan Act (ARPA). Second, S&L tax revenues proved resilient for a variety of reasons: pandemic-related employment losses were concentrated in low-wage jobs, incomes were supported by historically-large unemployment compensation and stimulus payments, and the decline in consumption was concentrated in services which generally have lower sales tax burdens than goods (Auerbach et al., 2020). The result was that the net saving of the S&L sector as a percentage of economic activity, a flow measure which can roughly be thought of as capturing the sector's operating budget position—it is equal to current revenues minus current expenditures—entered positive territory for the first time since the mid-1980s and quickly rose to its highest level on record (Figure 2, solid red line).2 The S&L sector's balance sheet, a stock measure of the sector's budget position, also reveals remarkable strength soon after the onset of the pandemic. The blue line in figure 2 shows that, like the net saving measure, S&L net assets as a percentage of nominal GDP turned positive in mid-2020 and reached an all-time high not long after.
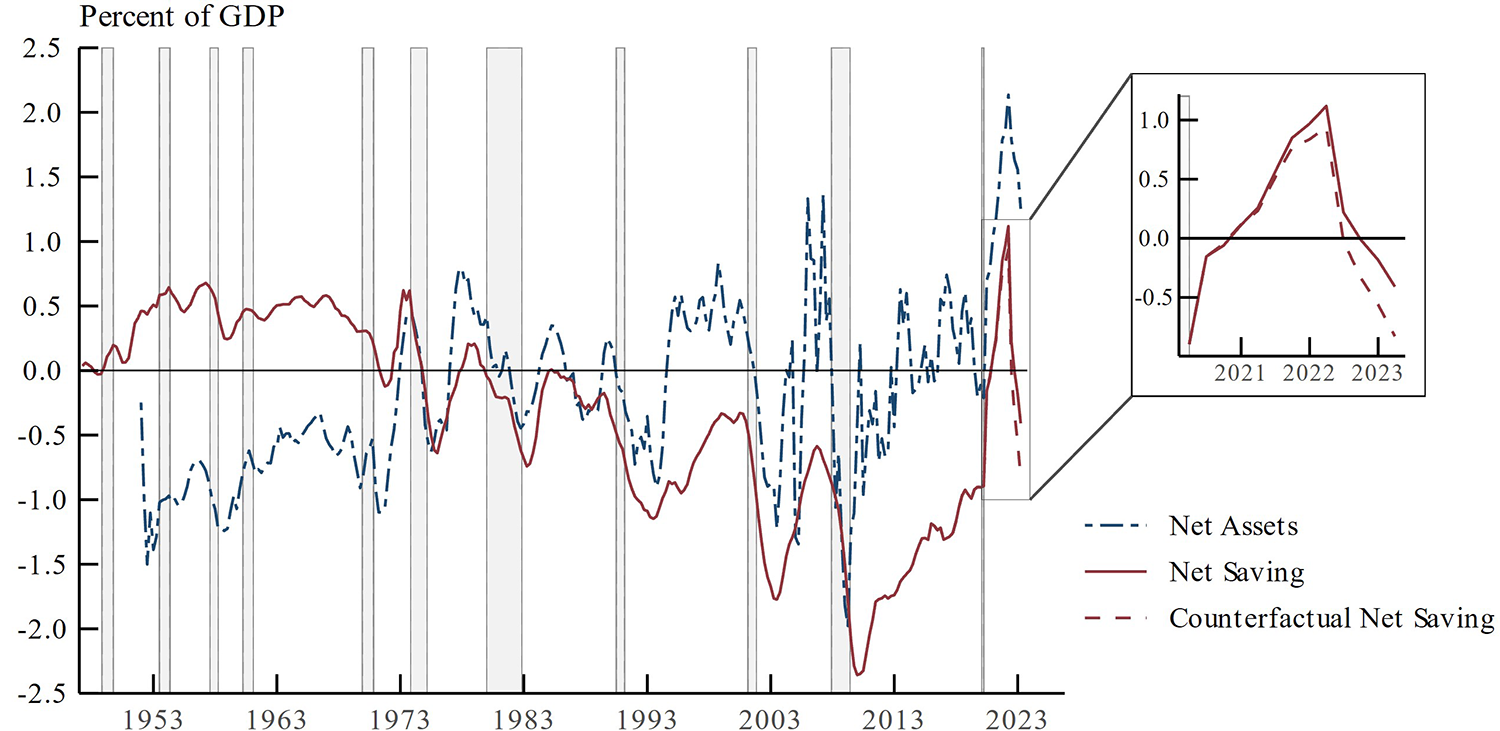
Note: The net assets measure excludes pension fund claims on the S&L sector, as these claims reflect long-term underfunding issues that are less relevant for the current operations of the S&L sector. For the counterfactual net saving measure, we assume that S&L sector wage growth kept up with private sector wage growth throughout the pandemic. The shaded bars indicate periods of business recession as defined by the National Bureau of Economic Research (NBER): November 1948-October 1949, July 1953-May 1954, August 1957-April 1958, April 1960-February 1961, December 1969-November 1970, November 1973-March 1975, January 1980-July 1980, July 1981-November 1982, July 1990-March 1991, March 2001-November 2001, December 2007-June 2009, and February 2020-April 2020.
Source: Bureau of Economic Analysis, Financial Accounts of the United States, and author calculations.
With the waning of social distancing, the reopening of public schools and government services over 2021 and 2022, and the exceptionally strong budget position of the S&L sector, one reasonably might have expected a robust employment recovery with payrolls returning to their pre-pandemic peak relatively quickly. However, as of June 2023, S&L employment was still 220,000 workers below its pre-pandemic peak (orange dashed line in Figure 1) and 660,000 workers below the level we would have observed in the absence of the pandemic had payrolls continued to grow at their pre-COVID trend (green dashed line in Figure 1). Although the S&L sector may have been apprehensive about using one-time federal aid for the recurring expenses associated with employment, it remains puzzling why the recovery has not been more robust given the resiliency of S&L tax revenues coupled with the sheer magnitude of the federal aid. The dashed red line in Figure 2 provides a counterfactual estimate of S&L net saving had payrolls grown quickly enough to return to their pre-pandemic peak at the beginning of the 2022-2023 school year. Such a rate of payroll growth—a little less than 50 thousand per month, on average—would still have left the S&L sector in a comfortable net saving position from a historical standpoint. This exercise suggests that, conditional on the sector's budget position, the recovery was quite slow. In the next two sections, we discuss factors that have likely played a significant role in restraining the recovery.
Elevated early retirements from the S&L sector have impeded the recovery.
It has been well documented that the shortfall in labor force participation relative to the pre-pandemic period has been shaped by an increase in the retired share of the U.S. population, with much of this increase due to "excess retirements" that likely would not have occurred in the absence of the pandemic (Montes et al., 2022). Others have found evidence of increased transitions to retirement during the pandemic for certain job characteristics, including high personal contact occupations (Davis, 2021). Given the prominence of these types of jobs among S&L employees (e.g. public education, transit workers), we explore the role of transitions to retirement for S&L employment. In Figure 3 we plot the 12-month moving average of the employment-to-retirement transition rate for the S&L sector (solid blue line), as well as the average rate over 2018-2019 (dashed blue line), the two years before the pandemic's onset.3
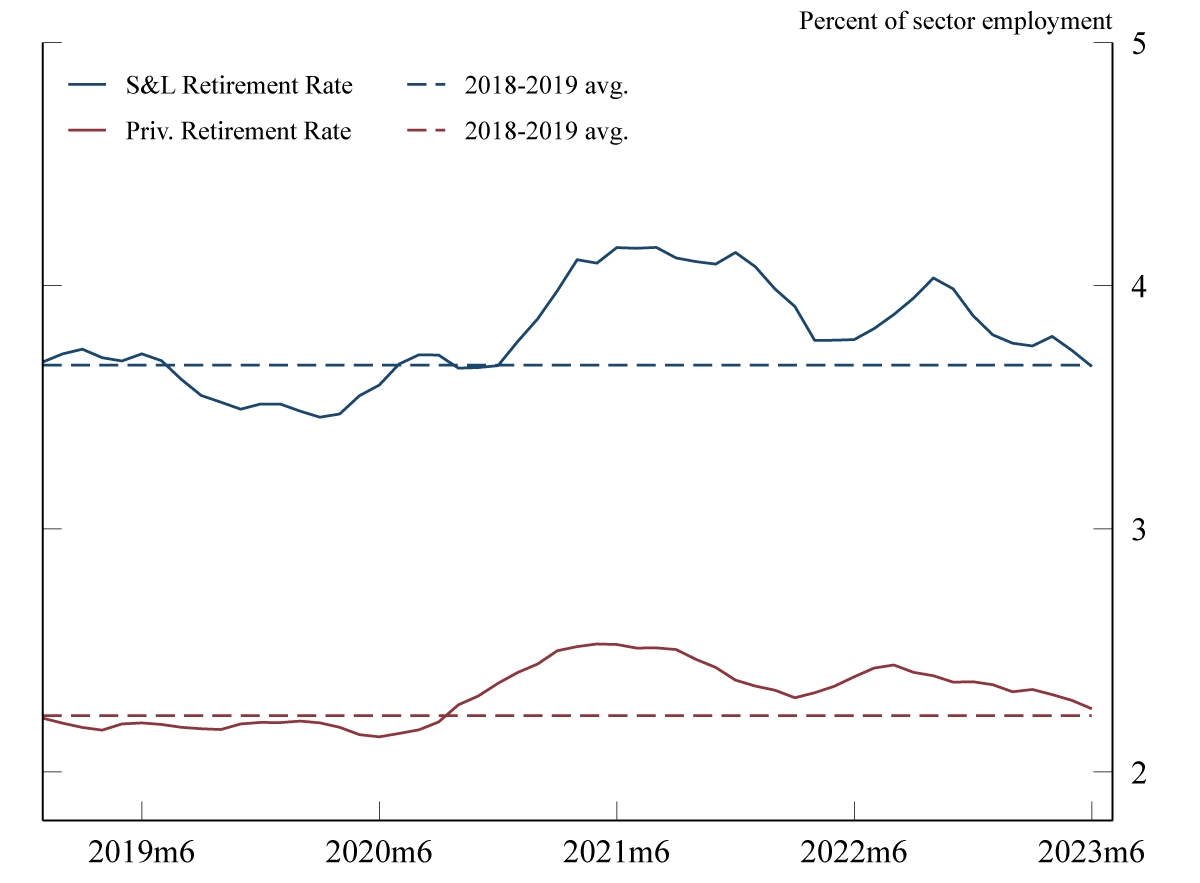
Note: Figure plots percent of those in a given sector who are employed in one month and observed to be retired one year later. Twelve-month moving averages of monthly data.
Source: Authors' analysis of Current Population Survey data.
The flow into retirement picked up notably early in the pandemic and remained elevated through the end of last year before returning to its pre-COVID trend over the first half of 2023. Over 2021, 2022, and the first half of this year, the cumulative difference in S&L transition rates relative to the 2018-2019 average was approximately 3/4 percentage point (ppt.), which exceeded the corresponding cumulative difference for the private sector (solid and dashed red lines). Under the assumption that the transition rate in the S&L sector would have remained at its 2018-2019 average in the absence of the pandemic, a back-of-the-envelope calculation using the data in Figure 3 suggests that these excess retirements in the S&L sector can account for up to 150,000 missing workers, or nearly 1/4 of the existing shortfall in S&L employment relative to its pre-COVID trend.4
S&L compensation growth has lagged the private sector since early in the pandemic.
Beyond the reduction in the S&L workforce due to early retirements, the S&L sector has likely struggled to retain and attract workers because compensation growth in the sector has lagged the private sector. Figure 4 displays year-over-year growth in S&L (blue line) and private sector (red line) employee compensation from the Employment Cost Index (ECI). S&L ECI growth consistently trailed the private sector after the pandemic began, with a cumulative disparity between the two sectors of about 2 1/2 ppt. through the first quarter of 2023. More recently, however, the gap in compensation growth between the two sectors has closed, which has coincided with an increase in the pace of hiring at the S&L level.
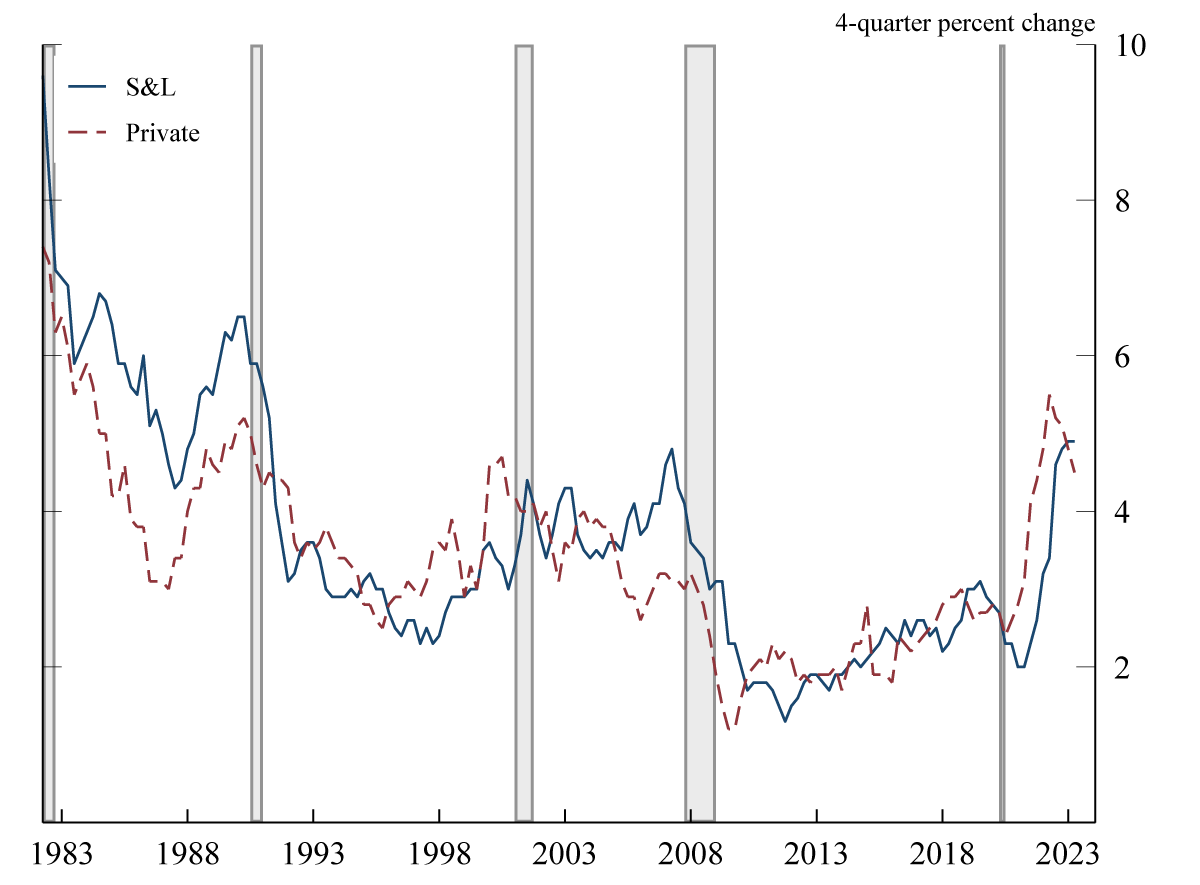
Note: The shaded bars indicate periods of business recession as defined by the National Bureau of Economic Research (NBER): July 1981-November 1982, July 1990-March 1991, March 2001-November 2001, December 2007-June 2009 and February 2020-April 2020.
Source: Bureau of Labor Statistics.
A natural question is how much did this compensation growth disparity after the pandemic's onset matter for employment growth in the S&L sector? A regression of the quarterly ppt. difference between S&L and private employment growth on lags of the quarterly ppt. difference between S&L and private ECI growth over the four decades prior to the pandemic offers suggestive evidence. Column 2 of Table 1 displays the coefficient estimates from the regression, which suggest that this disparity has been a major contributor to the current shortfall in S&L employment. The estimates show that a 1 ppt. decrease in S&L compensation growth relative to the private sector is associated with a 1 ppt. shortfall in S&L employment growth.5 Because the cumulative difference between private and S&L compensation growth since the pandemic began has been about 2 1/2 ppt., the results suggest that relatively slow compensation growth in the S&L sector since the second half of 2020 could be responsible for 450,000 missing workers in the sector, or nearly 2/3 of the existing shortfall in S&L employment relative to its pre-COVID trend.6
Table 1. Relative compensation and employment growth in the S&L and private sectors
| Lagged ECI growth, S&L less private (ppt.) | Employment growth, S&L less private (ppt.) | ||
|---|---|---|---|
| (1) | (2) | (3) | |
| 1-quarter | 0.2 | 0.44*** | 0.32 |
| 2-quarter | 0.21 | 0.37** | 0.38*** |
| 3-quarter | 0.07 | 0.23* | 0.29* |
| 4-quarter | -0.04 | 0.16 | 0.29 |
| Flexible time trends | N | Y | Y |
| Sample period | 1982 Q2 to 2019 Q4 | 1982 Q2 to 2019 Q4 | 1982 Q2 to 2023 Q1 |
| Observations | 147 | 147 | 160 |
Note: Table 1 displays coefficient estimates from a regression of the quarterly percentage point difference between S&L and private sector employment growth on 1-, 2-, 3-, and 4-quarter lags of the percentage point difference between S&L and private sector ECI growth. The estimates shown in columns 2 and 3 also include linear, quadratic, and cubic time trends to control for longer-term trends in relative employment growth between the two sectors. Newey-West standard errors allow for autocorrelation of up to 4 quarters. ***, **, and denote statistical significance at the 1, 5, and 10 percent levels, respectively.
Summing over our estimates of the missing workers due to early retirements and anemic wage growth, we find that about 90 percent of the shortfall in S&L employment relative to the pre-COVID trend can be attributed to these two factors. But this finding comes with important caveats. First, the assumption that the two factors are independent of each other is a strong one. For example, slow wage growth in the S&L sector during the pandemic could have hastened early retirements from the sector, and the catch up in wage growth more recently may have helped to bring the retirement rate back down. Second, while the regression of S&L employment growth relative to the private sector on the relative compensation growth of the two sectors indicates a clear and strong historical relationship, additional evidence from the pandemic era is murkier. For example, if relatively slow wage growth in the S&L sector prompted workers to opt for private sector jobs, then we would expect to observe lower rates of hiring per job opening in the S&L sector. While these hiring rates in the S&L sector fell notably after the onset of the pandemic, the decline was similar to that observed for the private sector. Nevertheless, the exercises above suggest a substantial role for early retirements and anemic wage growth in restraining the S&L payroll recovery from the pandemic recession.
At its current pace, S&L employment would return to its pre-pandemic peak at the end of this year.
Since S&L employment bottomed out following the pandemic's onset, the sector averaged monthly net payroll gains of 49,000 between July 2020 and June 2021 (FY 2021);7 just 12,000 in FY 2022, when early retirements and compensation growth disparities peaked in the sector; and rebounded to a monthly average of 45,000 during FY 2023, as these headwinds dissipated. Were the FY 2023 pace of hiring to continue, S&L employment would return to its pre-pandemic level late this year and its pre-COVID trend in early 2025.
That said, there is a lot of uncertainty about whether this robust pace will continue. Recently, S&L tax revenue growth has slowed and state budget projections for FY 2024 are quite downbeat (NASBO, Spring 2023). Even though the S&L sector is still in a strong budget position, which could temper any tendency towards a pull back on hiring, these governments have proved reticent to use one-time aid for recurring expenses such as employment.
On the other hand, the wave of retirements in the sector appears to be over and, with a reduced outflow of workers, it may be easier to boost employment in the sector moving forward.8 Additionally, as the private sector labor market has slowed over the last year, S&L compensation may keep pace or perhaps outstrip that in the private sector, auguring continued robust employment gains in the near future.
References
Auerbach, Alan, William G. Gale, Byron Lutz, and Louise Sheiner. 2020. "Fiscal Effects of COVID-19." Brookings Papers on Economic Activity, Fall, 229-278. https://www.brookings.edu/wp-content/uploads/2020/09/Auerbach-paper.pdf.
Davis, Owen. 2021. "Employment and Retirement Among Older Workers During the COVID-19 Pandemic." Schwartz Center for Economic Policy Analysis and Department of Economics, The New School for Social Research, Working Paper Series 2021-6. https://www.economicpolicyresearch.org/images/docs/research/nssr_working_papers/NSSR_WP_062021.pdf.
Montes, Joshua, Christopher Smith, and Juliana Dajon. 2022. "'The Great Retirement Boom': The Pandemic-Era Surge in Retirements and Implications for Future Labor Force Participation." Finance and Economics Discussion Series 2022-081. Washington: Board of Governors of the Federal Reserve System. https://doi.org/10.17016/FEDS.2022.081.
National Association of State Budget Officers. 2020. Spring 2020 Fiscal Survey of States. https://www.nasbo.org/mainsite/reports-data/fiscal-survey-of-states/fiscal-survey-archives.
National Association of State Budget Officers. 2023. Spring 2023 Fiscal Survey of States. https://www.nasbo.org/reports-data/fiscal-survey-of-states.
1. While instructional staff at public schools continued to work in a remote capacity, support staff such as janitors were often laid off. Return to text
2. Capital investments, such as the construction of roads, are not included in current expenditures. They are instead part of the capital budget, as they are partially financed by bond issuance. Return to text
3. The authors thank John Coglianese and Chris Nekarda for providing harmonized Current Population Survey microdata used by the authors for Figure 3. Return to text
4. There are a number of strong assumptions needed in order to view this number as an estimate as opposed to an upper bound. For example, it assumes that S&L governments did not replace those elevated retirements by retaining workers they otherwise might not have or hiring replacements. Nonetheless, we view the exercise as instructive of the magnitude of outflows that the sector faced from elevated retirements. Return to text
5. Reassuringly, and as displayed in column 3 of Table 1, we obtain quantitatively similar estimates when we include the employment and compensation growth data from the post-pandemic period (i.e. 2020 Q1 to 2023 Q1). Return to text
6. The level of S&L employment in 2020 Q2, when S&L ECI growth fell behind private sector growth, was 18.7 million. 2 1/2 percent of 18.7 million is roughly 450 thousand. Return to text
7. S&L fiscal years generally begin in July, whereas the federal government's fiscal year begins in October. Return to text
8. JOLTS data through May 2023 show that total separations from the S&L government sector are roughly back to their pre-pandemic rates. Return to text
Cashin, David, Byron Lutz, William Peterman, David Ratner, and Sarah Rodman (2023). "The Restrained Recovery of State and Local Government Payrolls from the Pandemic Recession," FEDS Notes. Washington: Board of Governors of the Federal Reserve System, August 04, 2023, https://doi.org/10.17016/2380-7172.3369.
Disclaimer: FEDS Notes are articles in which Board staff offer their own views and present analysis on a range of topics in economics and finance. These articles are shorter and less technically oriented than FEDS Working Papers and IFDP papers.