FEDS Notes
September 04, 2018
U.S. Corporations' Repatriation of Offshore Profits
Michael Smolyansky, Gustavo Suarez, and Alexandra Tabova1
Abstract: We investigate how companies with large holdings of cash abroad have used those funds following the Tax Cuts and Jobs Act, which eliminated prior tax disincentives on the repatriation of foreign earnings.
Before the Tax Cuts and Jobs Act (TCJA), foreign profits of U.S. multinational enterprises (MNEs) were subject to U.S. taxes, but only when repatriated. This system incentivized firms to keep profits abroad, and, by the end of 2017, U.S. MNEs had accumulated approximately $1 trillion in cash abroad, held mostly in U.S. fixed-income securities.2 Under the TCJA, the United States shifted to a quasi-territorial tax system in which profits are taxed only where they are earned (subject to minimum taxes); henceforth, U.S. MNEs' foreign profits will therefore no longer be subject to U.S. taxes when repatriated. As a transition to this new tax system, the TCJA imposed a one-time tax (payable over eight years) on the existing stock of offshore holdings regardless of whether the funds are repatriated, thus eliminating the tax incentive to keep cash abroad.3
Balance of payments data show that U.S. firms repatriated just over $300 billion in 2018:Q1, roughly 30 percent of the estimated stock of offshore cash holdings (figure 1). For reference, the 2004 tax holiday, which provided a temporary one-year reduction in the repatriation tax rate, resulted in $312 billion repatriated in 2005, of an estimated $750 billion held abroad.4 It should be noted that repatriation reflects the transfer of funds to the United States in purely accounting terms: The funds previously held by a foreign affiliate are now held by the U.S. parent.
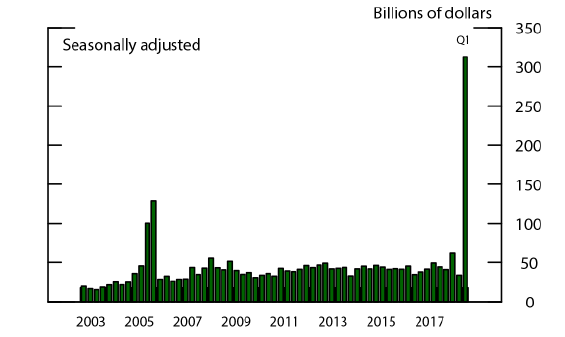
Source: BEA Balance of Payments data.
The quantity of cash repatriated since the passage of the TCJA might have a notable effect on firm financing patterns and investment decisions in the near term--a topic that has garnered considerable investor attention.5 The analysis detailed here suggests that funds repatriated in 2018:Q1 have been associated with a dramatic increase in share buybacks; evidence of an increase in investment is less clear at this stage, as it is likely too early to detect given that the effects may take time to materialize.
Our analysis investigates how U.S. nonfinancial firms with large holdings of cash abroad--specifically the top 15 holders--have deployed the repatriated funds, comparing their financing and investment behavior with that of all other nonfinancial S&P 500 firms.6 The top 15 firms account for roughly 80 percent of total offshore cash holdings, and roughly 80 percent of their total cash (domestic plus foreign) is held abroad. Figure 2 shows that, following the passage of the TCJA in late December 2017, share buybacks spiked dramatically for the top 15 cash holders, with the ratio of buybacks to assets more than doubling in 2018:Q1.7 In dollar terms, buybacks increased from $23 billion in 2017:Q4 to $55 billion in 2018:Q1. Among the top 15 cash holders, the largest holders accounted for the bulk of the share repurchases: In 2018:Q1, the top 5 cash holders accounted for 66 percent, and the top holder alone accounted for 41 percent. Firms can also pay out cash to shareholders through dividends; however, unlike buybacks, dividends were little changed for the top 15 cash holders relative to the same period last year. Similarly, academic studies suggest that most of the repatriated funds during the 2004 tax holiday were used to fund share buybacks (see Dharmapala, Foley, and Forbes (2011)).
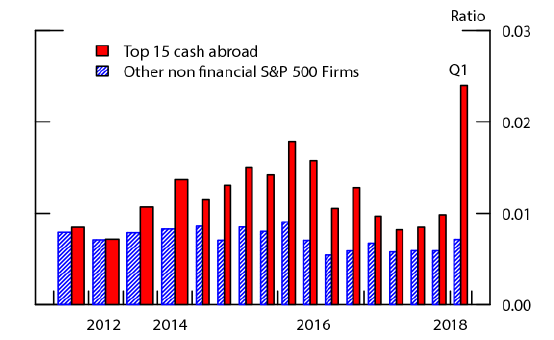
Note: For years before 2015, annual averages of quarterly values are shown.
Source: Compustat; Bloomberg.
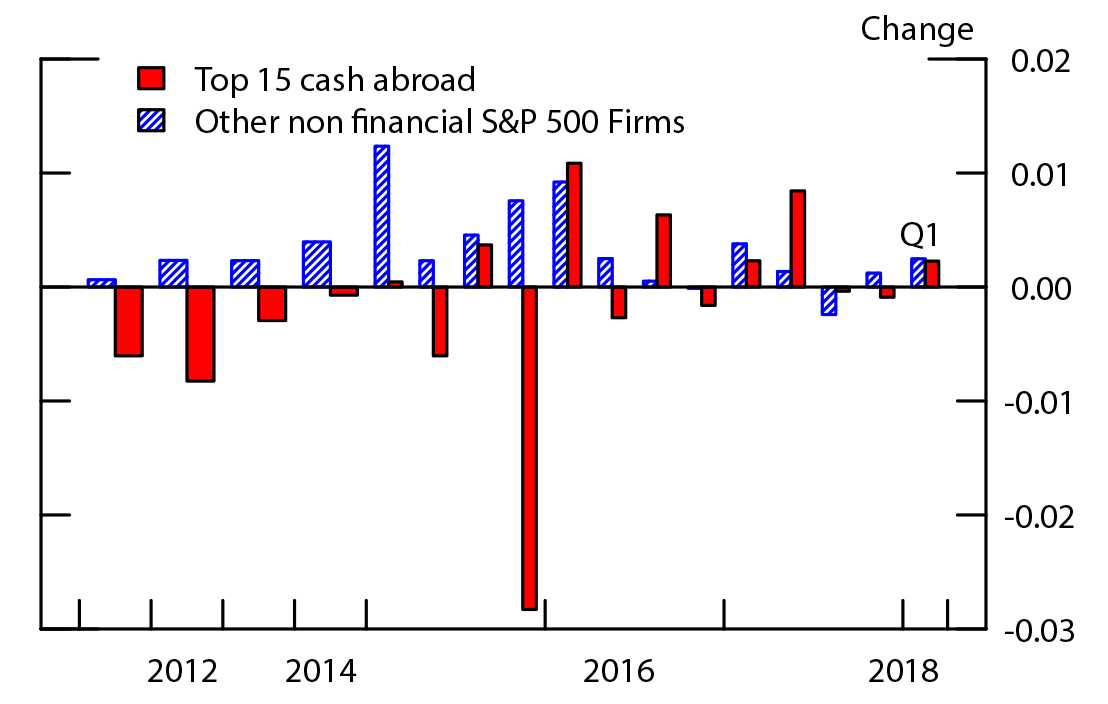
In contrast, the evidence of an analogous increase in investment is arguably more limited at this early stage, or is at the very least open to interpretation (figure 3). On the one hand, unlike in the case of share buybacks, there is no obvious spike in investment among the top 15 cash holders in 2018:Q1 relative to the previous quarter. Indeed, it appears that the top 15 cash holders have already been on a slight upward trajectory relative to other firms for a few years. The upward trend is consistent with the notion that, because the top 15 cash holders are large firms, they are unlikely to have faced notable constraints or costs to accessing capital markets to fund investment before the TCJA. On the other hand, there is seasonal pattern in capital expenditures and R&D (with spikes in the fourth quarter); thus, comparing 2018:Q1 to the same period last year, it does appear that investment is higher for the top 15 cash holders (shown in red), though not for other firms (shown in blue). Of course, it is far too early to reach a definitive conclusion or to know whether the effects will persist, as any boost to investment due to the repatriation may take time to fully materialize.8
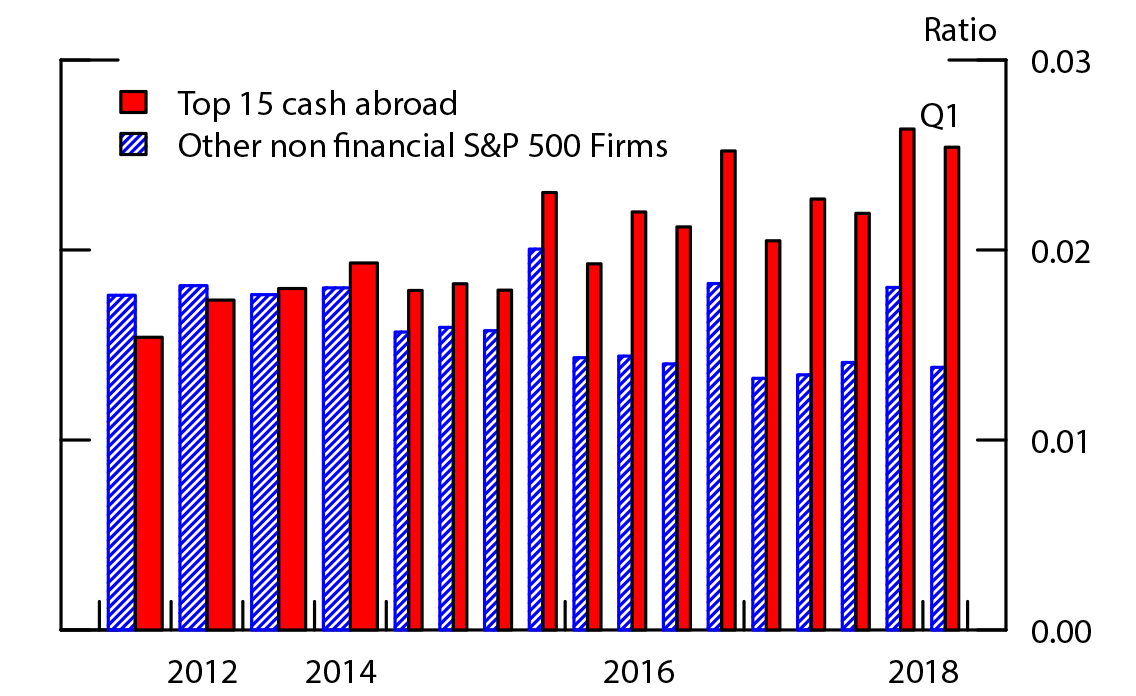
Note: For years before 2015, annual averages of quarterly values are shown. R&D is research and development.
Source: Compustat; Bloomberg.
How have the top 15 cash holders funded their increase in share buybacks? Given that most of the offshore funds are invested in U.S. fixed-income securities, one might expect some of these to have been sold to pay for the buybacks. The evidence supports this hypothesis: Figure 4 plots the net purchase of securities (scaled by assets), and indeed the top 15 cash holders were net sellers in 2018:Q1, with their total securities holdings falling by about 3 percent of their total assets (or $66 billion).9
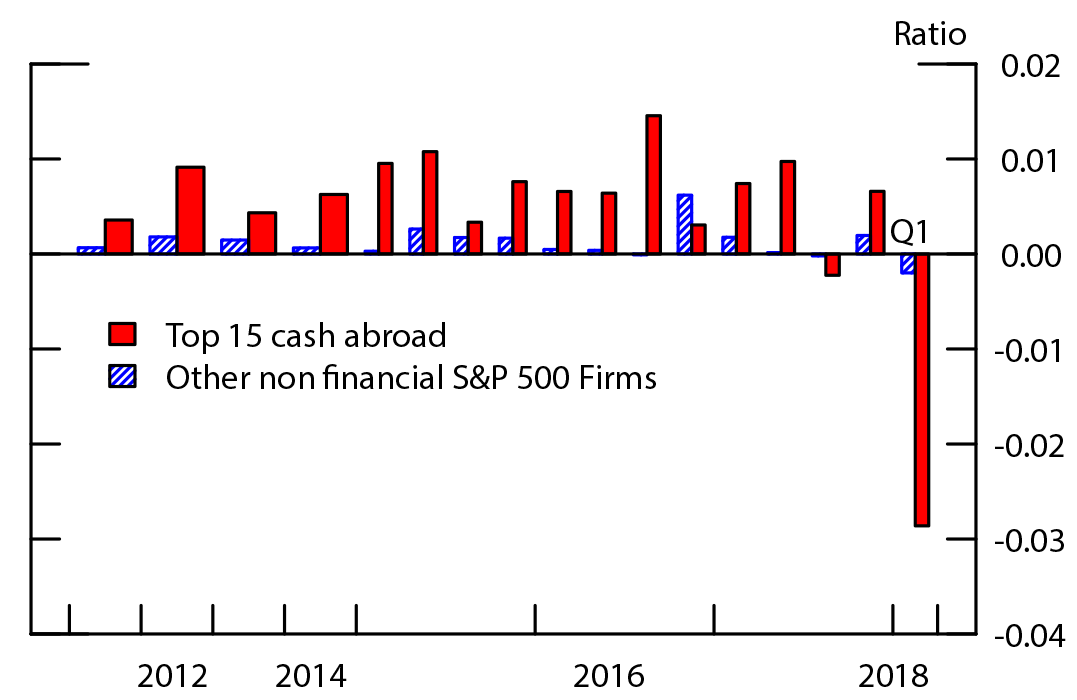
Note: For years before 2015, annual averages of quarterly values are shown.
Source: Compustat; Bloomberg.
The sale of securities following repatriation may also have been used to pay down debt; however, the aggregate debt of the top 15 cash holders declined only about $15 billion, or 2 percent of their total debt outstanding, suggesting limited paydowns so far. Consequently, figure 5 shows that the debt-to-assets ratio of the top 15 cash holders was little changed in 2018:Q1 (remaining at 32 percent).10
Note: For years before 2015, annual averages of quarterly values are shown.
Source: Compustat; Bloomberg.
References
Dhammika Dharmapala, C. Fritz Foley, and Kristin J. Forbes (2011), "Watch What I Do, Not What I Say: The Unintended Consequences of the Homeland Investment Act," Journal of Finance, vol. 66 (June), pp. 753–87.
Permanent Subcommittee on Investigations of the Committee on Homeland Security and Governmental Affairs U.S. Senate (2011), "Repatriating Offshore Funds: 2004 Tax Windfall for Select Multinationals".
Zoltan Pozsar (2018), "Repatriation, the Echo-Taper and the €/$ Basis," Global Money Notes #11 (New York: Credit Suisse, January).
1. Board of Governors of the Federal Reserve System. We thank Daniel Beltran, Carol Bertaut, Stephanie Curcuru, Thomas Laubach, Steve Sharpe, Michael Palumbo, and Beth Anne Wilson for comments and suggestions. Nathanael Coffey and Stephen Paolillo provided excellent research assistance. The views in this document do not necessarily reflect those of the Federal Reserve System, its Board of Governors, or staff. Return to text
2. Cash held abroad is calculated by Board staff based on Bloomberg data for nonfinancial S&P 500 firms and refers to cash and cash equivalents, which include both cash and liquid assets held abroad and excludes overseas profits that are permanently reinvested in the companies' overseas operations. Estimates suggest that most of the cash held abroad is invested in dollar-denominated fixed-income assets (see Pozsar (2018)). Return to text
3. This transition tax is detailed in Section 965 of the TCJA. The one-time tax rate is 15.5 percent on liquid assets and 8 percent on illiquid assets. For comparison, the TCJA lowered the statutory corporate tax rate from 35 percent to 21 percent. Return to text
4. The 2004 Homeland Investment Act (HIA) provided a one-time reduction in the tax rate on repatriated earnings from the statutory rate of 35 percent to 5.25 percent for a one-year period in the November 2004 – December 2006 window. Most companies repatriated the funds in 2005 and a total of $312 billion were brought back that year by a total of 843 corporations, with the top 15 firms accounting for 52 percent of total repatriation (see U.S. Senate (2011)). Return to text
5. Under the pre-TCJA regime, using offshore funds for domestic investment or shareholder payouts would have been deemed a repatriation and thus subject to U.S. taxes. Return to text
6. Our analysis therefore examines the near-term effect associated with the repatriation of cash held abroad, and is not designed to speak to the broader effects of tax reform, which could also affect corporate financing patterns and investment. Return to text
7. Compustat data via Wharton Research Data Services, http://wrds.wharton.upenn.edu/. Return to text
8. This preliminary analysis does not capture other potential benefits of the corporate tax changes on aggregate investment expenditures. For example, it is possible that stock market investors redeploy the funds they receive from share repurchases to buy stocks in other firms that are pursuing capital expenditures. Return to text
9. Net purchase of securities is defined as the purchase of securities minus the proceeds from the sale and maturity of securities. Return to text
10. The large drop in the debt-to-assets ratio in 2015:Q4 reflects GE's exit from GE Capital. Return to text
Smolyansky, Michael, Gustavo Suarez, and Alexandra Tabova (2018). "U.S. Corporations' Repatriation of Offshore Profits," FEDS Notes. Washington: Board of Governors of the Federal Reserve System, September 4, 2018, https://doi.org/10.17016/2380-7172.2239.
Disclaimer: FEDS Notes are articles in which Board staff offer their own views and present analysis on a range of topics in economics and finance. These articles are shorter and less technically oriented than FEDS Working Papers and IFDP papers.