Report on the Economic Well-Being of U.S. Households in 2013
- Preface
- Executive Summary
- Introduction
- Household Economic Well-Being
- Housing and Household Living Arrangements
Household Economic Well-Being
The survey asked households how they were faring, generally and in some specific ways, and also asked about how they were faring relative to several years ago.
Current Situation versus Five Years Ago
When asked how they were currently managing financially, 23 percent of respondents reported that they were "living comfortably," while 37 percent reported that they were "doing okay." A further 25 percent reported that they were "just getting by" financially, and the remaining 13 percent indicated that they were "finding it difficult to get by."
The vast majority of households also appear to be living within their means, with 38 percent reporting that they spent less than their income over the course of 2012 and an additional 38 percent reporting that their spending was equal to their income. Only 22 percent reported that they had spent more than their income. (Given that over half of respondents report having saved some money in 2012, a significant fraction of those reporting that their spending was equal to their income may be deducting savings through pension or 401(k) plans at work from their income before comparing it to their spending.)
Although majorities of individuals report doing okay or being financially comfortable and most individuals are living within their means, a number of respondents report living with others in order to save money. For instance, among the 16 percent of respondents who live with their adult children, their extended family, or a roommate, a little more than half say they are doing so to save money, and 73 percent would move out on their own if they could afford to do so.
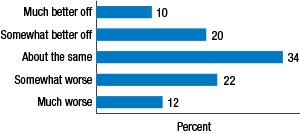
When asked to compare their current financial situation to their financial situation five years prior, 34 percent reported doing somewhat or much worse financially, 34 percent reported doing about the same financially, and 30 percent reported that they were either somewhat or much better off (figure 1). Given that respondents were being asked to compare their incomes to 2008, when the United States was in the depths of the financial crisis, the fact that over two-thirds of respondents reported being the same or worse off financially highlights the uneven nature of the recovery. (For a discussion of how households responded to the recession, see box 1.)

Note: Here and in subsequent figures, totals may not add to 100 percent due to rounding and question non-response.
Box 1. Household Responses to the Great Recession
Among the motivating factors for conducting the Survey of Household Economics and Decisionmaking was obtaining a better understanding of the challenges and decisions facing households as a result of the Great Recession and its aftermath. Some questions ask survey respondents to compare their present state to that in 2008, a point in time five years prior to the survey, and at the onset of the recession.1 For these types of questions, inferences can be made about the possible influence of the recession, but causation cannot be known with any certainty.
Survey respondents were also asked some specific questions about actions that they took and directly attribute to the recession. When asked, "Did you delay any major expenses or purchases because of the recession that began in 2008?," 42 percent said they had. Of those people, foregoing a vacation (67 percent) was the most common action cited. Other actions commonly cited by those who said they had delayed a major expense were buying a car (57 percent), making home improvements (44 percent), buying a major appliance (31 percent), or buying a home (20 percent). Five percent reported other expenses foregone. (Respondents could cite more than one delayed expense.)
The survey also asked, "Did you delay any major life decisions because of the recession that began in 2008?" Eighteen percent of people said they had. Of those people, buying a home was far and away the most common decision delayed (45 percent). Other decisions mentioned were moving to a new city or state (34 percent), changing jobs (21 percent), having a child (18 percent), retirement (16 percent), and marriage (15 percent). Another 9 percent cited other major life decisions that were delayed.
The survey indicates that many households have been providing assistance to one another during periods of financial distress. When asked about providing or receiving financial assistance to/from friends or family members, 22 percent of respondents said they had received such help since 2008, and 34 percent said they had provided such help during that time.
1. The National Bureau of Economic Research finds that the recession officially began in December 2007.Return to text
Return to textFinancial Expectations and Stability
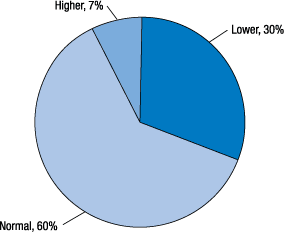
Expectations among most individuals in the U.S. adult population were that their incomes will be stable over the coming 12 months, with 61 percent reporting that they expected their total income to stay about the same as it had been over the prior 12 months, 21 percent believing it would be higher, and 16 percent believing it would be lower. A significant fraction of respondents (30 percent) reported that their household's income for 2012 was lower than what they would consider "normal" (figure 2). Of the 30 percent who view their 2012 income as below "normal," about half were not optimistic about their incomes recovering quickly. Among these respondents, 28 percent expected their income in the next 12 months to decline, while only 20 percent expected their income to increase in the next 12 months (table 2).
| Lower | About the same | Higher | |
|---|---|---|---|
| 2012 income lower than normal | 27.9 | 51.5 | 19.8 |
| 2012 income was normal | 10.2 | 68.3 | 20.7 |
| 2012 income higher than normal | 20.8 | 46.4 | 31.0 |
| Overall | 16.1 | 60.5 | 20.7 |
| Total number of respondents | 4,134 | ||
Figure 2. Was your total household income in 2012 higher or lower than what you would expect in a normal year?

The survey also asked questions to better understand how steady and predictable households' income streams are. While two-thirds of respondents reported that their income is roughly the same from month to month, 21 percent said that they occasionally experience months with unusually high or low incomes, and 10 percent said that their income varies quite a bit from month to month. For those whose income varies, 42 percent reported that it was due to an irregular work schedule, and 15 percent said it was due to periods of unemployment. This was followed by bonuses and seasonal employment, which were each cited as reasons for month-to-month income variance by 12 percent of respondents. Of the 42 percent with an irregular work schedule, 58 percent worked full time, 30 percent worked part time, and 11 percent were self-employed.
Self-Reported Financial Challenges
In addition to asking specific questions about their financial situation, the survey invited respondents to describe their current financial challenges and economic concerns in their own words. About 45 percent chose an option labeled "none." This group may include some people who had no concerns and others who simply chose not to provide an answer. The remaining 55 percent of respondents provided some response to the open-ended question. These responses underwent text analysis in order to identify broad themes under which the respondents' financial challenges and economic concerns could be grouped.
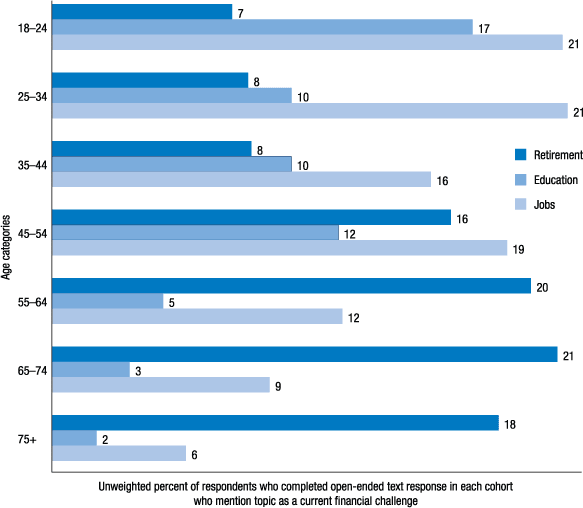
Among the most prominent themes to emerge from the text analysis of the open-ended question were retirement, education, and employment.2 Among those who opted to describe their financial challenges and concerns, there were differences by age cohort in the frequency with which each of these themes was mentioned (figure 3). Not surprisingly, the frequency of retirement concerns was highest among the older age cohorts. Of the respondents ages 45 or older who provided a text response, 19 percent described retirement concerns. This compares to just 8 percent with similar concerns among those under age 45. In contrast, the younger to mid-age cohorts had the highest frequency counts for concerns regarding college and education. Respondents also expressed high levels of concern regarding jobs and employment across all cohorts of working-age individuals. This concern was particularly acute among those ages 18 to 24 and 25 to 34, where 21 percent of each cohort reported concerns about jobs and employment. However, high levels of employment concerns were also prevalent among those ages 35 to 44 and those ages 45 to 54.
Figure 3. Most frequently cited concerns about retirement, college, and employment in open-ended text responses (by age)

References
2. Sentences in which the respondent mention any of the terms retire, pensions, old age, Medicare, Supplemental Security Income, IRAs, 401(k), or Social Security were grouped into the "retirement" theme. Those that mentioned any of the terms college, school, education, tuition, degree, or university were grouped into the "education" theme. The "employment" theme included any mention of the terms jobs, employment, employed, laid off, part time, hours, full time, cutback, and skills. Return to text
