Report on the Economic Well-Being of U.S. Households in 2014
- Preface
- Executive Summary
- Introduction
- Overall Economic Well-Being
- Housing and Household Living Arrangements
Overall Economic Well-Being
Respondents to the survey are asked a range of questions relating to their financial well-being, including how they are currently faring overall, the change in their economic well-being in recent years, and their expectations for the future. The survey finds that individuals and their families showed only mild improvements in their overall economic well-being relative to 2013. The results also suggest that a number of workers either wish that they could work more hours at their current wage, or are piecing together employment by working multiple jobs. However, while some respondents are struggling economically, most respondents still believe that they are better off than their parents were, and a plurality expect that their children will be better off than they are.
Current Economic Circumstances
When asked how they are currently managing financially, 25 percent of respondents report that they are "living comfortably," while 40 percent report that they are "doing okay." However, just over one-third of respondents report that they are experiencing some level of financial stress, as 24 percent report that they are "just getting by" financially, and a further 10 percent indicate that they are "finding it difficult to get by" ( figure 1).2 This level of overall well-being is only marginally improved from that seen in the 2013 survey, where 25 percent said they were living comfortably and 38 percent said they were doing okay.3
Figure 1. Which one of the following best describes how well you are managing financially these days? (by household income)

Note: Here and in subsequent figures, percents may not sum to 100 due to rounding and question non-response.
Return to textPerceptions of overall economic well-being are closely linked to household income. Among respondents in households making less than $40,000 per year, 53 percent indicate that they are either finding it difficult to get by or are just getting by.4 This fraction changes inversely with income, with just 16 percent of those earning more than $100,000 reporting the same.
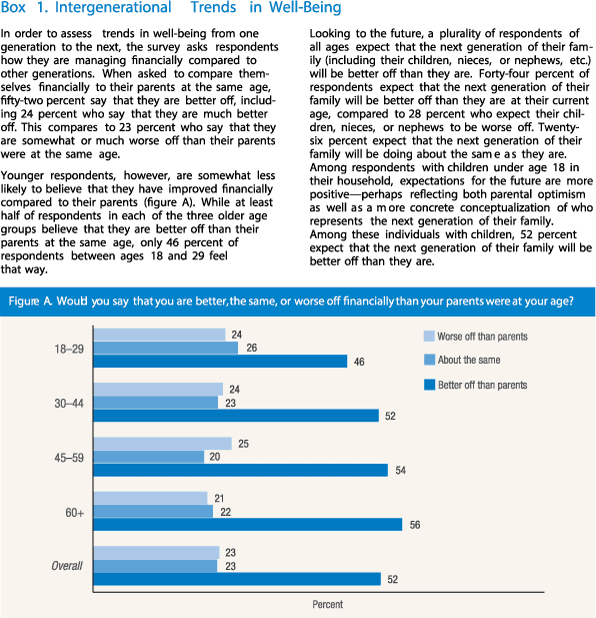
When asked to compare their current financial situation to their situation five years prior (2009), 40 percent report that they are either "somewhat better off" or "much better off," while 31 percent report doing "about the same" financially and 28 percent report being somewhat or much worse off financially. Providing some optimism about the pace of recovery, the fraction reporting that they are somewhat or much better off than five years prior increased by 9 percentage points from the 2013 survey (table 2). (For a discussion of longer-term intergenerational trends in well-being, see box 1.)
To assess the extent to which the recovery has reached different segments of the population, these responses are analyzed by the educational attainment and race/ethnicity of the respondent. Among respondents with at least a bachelor's degree, 48 percent say that they are better off than they were five years earlier. This compares to 37 percent of respondents with less than a bachelor's degree who feel that their financial situation improved over the prior five years. This provides some evidence that the recovery is being experienced to a greater degree for individuals with higher educational backgrounds. However, when comparing results by race, no similar differences emerge: 39 percent of white respondents report being better off than they were in 2009, while 43 percent of both black and Hispanic respondents indicate that they are now better off. This lack of difference in trends of well-being by race is consistent with the results from the 2013 SHED, which also observed that a slightly lower fraction of whites (30 percent) than blacks (33 percent) or Hispanics (34 percent) felt that they were better off than they had been five years prior.
| 2013 | 2014 | |
|---|---|---|
| Much worse off | 11.6 | 8.8 |
| Somewhat worse off | 21.5 | 18.8 |
| About the same | 34.7 | 30.9 |
| Somewhat better off | 20.7 | 26.7 |
| Much better off | 10.1 | 13.5 |
| Total number of respondents | 4,134 | 5,896 |
Employment
Closely related to overall economic well-being is the employment status of respondents. In the survey, 55 percent of respondents report being employed, while 19 percent are retired, 7 percent are homemakers, 7 percent are disabled and not working, and 7 percent are not employed (including both those looking and not looking for work) or are on temporary layoff.5
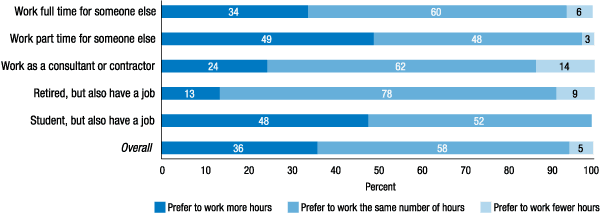
In addition to the rate of unemployment, the level of underemployment is an important measure of labor market slack. One measure of underemployment is the fraction of individuals who are working but would like to work more if they had the opportunity to do so. To gauge the size of this population, the survey asks non-self-employed workers whether they would prefer to work more, less, or the same amount that they currently work if their hourly wage was unchanged. Thirty-six percent of these respondents indicate that they would prefer to work more hours at their current wage. Among those whose current job is part time, the fraction is even higher, with 49 percent responding that they would prefer to work more hours at their current wage (figure 2).
Figure 2. Would you prefer to work more, less, or about the same amount as you currently work at your current wage? (by employment status)

Note: Among respondents who are currently employed.
Return to textOne way that some workers fill this desire for additional income is by working multiple jobs. Among employed respondents, 15 percent report having at least two jobs. This includes 21 percent of respondents who work part time at multiple jobs.
Working multiple jobs is slightly more common among respondents with less income. Conditional on having at least one job, 18 percent of employed respondents whose household income is less than $40,000 per year have at least two jobs, whereas 15 percent of those whose income is between $40,000 and $100,000 and 14 percent of those with a household income over $100,000 have at least two jobs (table 3).6
| Income categories | Yes, I have another full-time job | Yes, I have another part-time job | No |
|---|---|---|---|
| Less than $40,000 | 3.0 | 15.1 | 81.8 |
| $40,000-$100,000 | 2.3 | 12.7 | 85.0 |
| Greater than $100,000 | 1.5 | 12.2 | 86.3 |
| Overall | 2.2 | 13.0 | 84.7 |
| Total number of respondents | 2,871 |
Note: Among respondents who are currently employed and are not a student
or retiree.
Financial Expectations
In addition to asking about the current economic situation of respondents and the recent trajectory of their well-being, the survey asks respondents about their expectations for the future. Expectations for future income growth are improved relative to that seen in the 2013 survey. Twenty-nine percent of respondents report that they expect their income to be higher in the year following the survey than it was in the preceding 12 months, compared to 9 percent who expect it to be lower.7 In contrast, in 2013, only 21 percent of respondents expected their income to be higher in the year following the survey. Despite this improvement, there are still 60 percent of respondents who expect their income to remain about the same in the next 12 months, which may reflect a continued lack of optimism about future wage growth.
Optimism about future income growth is also correlated with both age and income. Younger individuals are the most optimistic about their future income trajectory, with 39 percent of those under age 30 believing their income will increase in the year after the survey, and 37 percent of those between ages 30 and 44 expecting income growth over the same period. Expectations about income growth then decline with age (table 4).
However, survey results also indicate that those with lower incomes are the least optimistic about rising incomes going forward. Among those in the lowest income group, a smaller 22 percent of respondents expect that their income will be higher in coming months. Expectations about income growth then rise with current income (table 5).
| Age categories | Lower | About the same | Higher |
|---|---|---|---|
| 18-29 | 7.3 | 49.5 | 39.3 |
| 30-44 | 6.3 | 55.1 | 37.2 |
| 45-59 | 11.0 | 61.6 | 26.5 |
| 60+ | 11.4 | 72.1 | 16.0 |
| Overall | 9.1 | 60.2 | 29.2 |
| Total number of respondents | 5,896 |
| Income categories | Lower | About the same | Higher |
|---|---|---|---|
| Less than $40,000 | 12.0 | 64.5 | 21.6 |
| $40,000-$100,000 | 8.4 | 60.1 | 30.0 |
| Greater than $100,000 | 6.9 | 55.3 | 36.5 |
| Overall | 9.1 | 60.2 | 29.2 |
| Total number of respondents | 5,896 |
References
2. Throughout this report, percentages are calculated as a share of all those who were asked a question, including those who did not respond. Refusal rates for each question can be found in appendix 3. Return to text
3. These results for 2013, and others mentioned in this report, may deviate slightly from those presented in the Report on the Economic Well-Being of U.S. Households in 2013. This reflects a change in weighting criteria for the 2014 survey to included income brackets when weighting respondents to match the U.S. population. To ensure that any changes since 2013 reflect actual trends, rather than methodological differences, the 2013 data were re-weighted using the same weighting criteria as the 2014 survey for the purposes of comparisons within this report. Return to text
4. Lower-income households are considered throughout this report as those with a household income under $40,000, which is the cutoff for the income-based oversample. Thirty-two percent of respondents have an annual income under $40,000 and 15 percent have an annual income over $100,000. Return to text
5. In addition to the 55 percent of respondents who report being employed, 2 percent of respondents indicate that they are primarily a student but also have a full-time or part-time job, and 2 percent indicate that they are primarily retired but also have a full-time or part-time job. Overall, 59 percent of respondents report having a job of any kind, which closely matches the Bureau of Labor Statistics' estimate for the adult employment-population ratio. Respondents who primarily identify as having any employment status besides "employed now," including students and retirees, are not asked about the number of jobs. Return to text
6. Income is measured in the survey at the household level, so all references to the income level of individuals in this report refer to the total income of all individuals in their household. Return to text
7. Since the survey was fielded in late October 2014, questions regarding the coming 12 months reflect respondents' opinions on their incomes through approximately October 2015. Responses about the previous year should reflect the period from approximately November 2013 through October 2014. Return to text

