Report on the Economic Well-Being of U.S. Households in 2014
- Preface
- Executive Summary
- Introduction
- Overall Economic Well-Being
- Housing and Household Living Arrangements
Retirement
Just as education and student loans are important for the financial well-being of individuals entering adulthood, retirement savings and retirement planning are important for the economic well-being of respondents later in life. To assess respondents' preparedness for their retirement years, the survey asks questions that probe their retirement plans, their retirement savings, and their expected path toward retirement. In general, the results demonstrate that many individuals want to save for retirement, but also that many individuals--especially those with lower incomes--are failing to do so. Additionally, even among those who are saving for retirement, a majority of respondents indicate that they have no or limited confidence in their ability to manage their retirement investments.
Planning for Retirement
The survey asks respondents about their planning for retirement and their progress toward saving for retirement. Although the long-term shift from defined-benefit (e.g., pension) to defined-contribution (e.g., 401(k)) plans places significant responsibilities on individuals to plan for their own retirement, many respondents are not saving for retirement, lack confidence in their ability to invest their retirement savings, or appear ill-informed about their retirement accounts.18
Only 13 percent of respondents who are not currently retired report that they have given "a lot" of thought to financial planning for their retirement, while an additional 21 percent have given it "a fair amount" of thought. Thirty-nine percent of respondents say that they have thought only "a little" or "none at all" about financial planning for retirement.
As might be expected, the amount of thought given to retirement planning varies considerably by age. The proportion of those ages 18 to 29 who say they have given no thought at all to retirement planning was the highest of any age group, at 31 percent. Those closer to retirement age are more likely to indicate that they have given thought to retirement planning. That said, slightly less than half of non-retired respondents ages 45 and above say they have given "a fair amount" or "a lot" of thought to retirement planning.
The extent to which individuals have planned for retirement appears to be closely related to their income (table 17). Of those with a six-figure income, for instance, 21 percent report that they have given financial planning for retirement "a lot" of thought, roughly double the rate for those making under $40,000.
| Less than $40,000 |
$40,000- $100,000 |
Greater than $100,000 | Overall | |
|---|---|---|---|---|
| None at all | 28.8 | 14.0 | 10.0 | 17.1 |
| A little | 22.6 | 24.5 | 19.3 | 22.4 |
| Some | 26.1 | 26.5 | 21.3 | 24.8 |
| A fair amount | 10.9 | 24.2 | 27.6 | 21.4 |
| A lot | 10.4 | 9.6 | 20.7 | 13.1 |
| Total number of respondents | 4,414 |
Note: Among respondents who are not currently retired.
Individuals also express a range of expectations for their path to retirement. Among those who have not yet retired and do not indicate that they are out of work due to a disability, only 22 percent anticipate that they will experience the traditional notion of retirement, which is working full time until a retirement date and then no longer working at all. Conversely, for 26 percent of this population, their "retirement plan" was to keep working as long as possible. An additional 12 percent indicate that they do not plan to retire. Many respondents plan to ease out of the labor force, with 12 percent planning to retire from their current career but then find a different part-time job, 9 percent planning to reduce their hours as they approach retirement, 8 percent planning to retire and then work for themselves, and an additional 3 percent planning to retire and then find a different full-time job.
Responses to the question about the path to retirement also vary by income, indicating that expectations around retirement are closely linked to financial circumstances. Fifty-five percent of those with a household income less than $40,000 per year (who are not retired and not out of the labor market due to a disability) indicate that they either plan to keep working as long as possible or do not plan to retire. Only 27 percent of the parallel group making $100,000 or more say the same (table 18). Conversely, 28 percent of those with a six-figure income report that they intend to work full time until a retirement date and then stop working, whereas only 11 percent of those making less than $40,000 intend to do so.
| Less than $40,000 | $40,000-$100,000 | Greater than $100,000 | Overall | |
|---|---|---|---|---|
| I do not plan to retire | 17.0 | 11.3 | 7.5 | 11.5 |
| Work fewer hours as I get close to retirement | 9.4 | 10.4 | 7.6 | 9.3 |
| Retire from my current career, but then find a different full-time job | 2.5 | 2.5 | 3.0 | 2.6 |
| Retire from my current career, but then find a different part-time job | 8.6 | 12.2 | 15.8 | 12.5 |
| Retire from my current career, but then work for myself | 4.9 | 7.6 | 11.3 | 8.1 |
| Work full time until I retire, then stop working altogether | 11.2 | 23.1 | 28.1 | 21.6 |
| Keep working as long as possible | 37.8 | 24.6 | 19.9 | 26.5 |
| Other | 7.2 | 6.4 | 5.3 | 6.3 |
| Total number of respondents | 3,894 |
Note: Among respondents who are not currently retired or out of work due to a disability.
Saving for Retirement
A lack of preparedness for retirement is not signaled by a lack of planning alone. Many respondents, particularly those with limited incomes, indicate that they simply have few or no financial resources available for retirement. When asked what types of retirement savings or pension they have, 31 percent of non-retired respondents report that they have no retirement savings or pension whatsoever.
Those who do have retirement savings were asked to indicate all the ways they are saving for retirement. The most commonly reported form of retirement savings is a defined contribution plan, such as a 401(k) or 403(b) plan, which 47 percent of people possess. This is more than double the 22 percent of respondents who participate in a traditional defined benefit pension plan through an employer. Twenty-nine percent of respondents report that they have an individual retirement account (IRA), and 37 percent indicate that they have savings outside of a formal retirement account. Additionally, 15 percent of respondents report having real estate or land that they plan to sell or rent to generate income during retirement, and 7 percent report having retirement savings through the ownership of a business.
Patterns of retirement savings also differ substantially, and predictably, by age. The percentage of people indicating that they lack retirement savings decreases with age. Nearly half of those ages 18 to 29 report that they have no retirement savings or pension, whereas approximately three-quarters of non-retirees over age 45 have at least some savings.
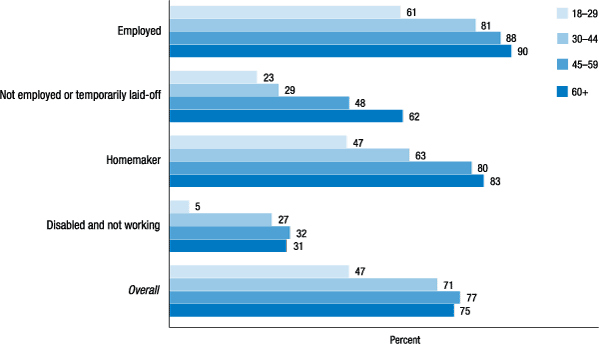
However, whether respondents have retirement savings as they approach retirement is highly dependent on their employment status (figure 20). While almost 90 percent of respondents over age 45 have retirement savings, less than a third of those who are out of work due to a disability do. Since 12 percent of non-retired respondents ages 45 to 59 and 20 percent of non-retired respondents over age 60 report having a disability, these individuals compose a sizeable fraction of the respondents who lack savings as they approach retirement age.

Note: Among respondents not currently retired.
Return to textThe reported frequency of having retirement savings also increases sharply with income (table 19). Eighty-two percent of respondents making over $100,000 per year report having at least some retirement savings, and 74 percent of those making between $40,000 and $100,000 per year have savings. But among respondents making under $40,000 per year, only 42 percent have any retirement savings.
| Less than $40,000 | $40,000-$100,000 | Greater than $100,000 | Overall | |
|---|---|---|---|---|
| 401(k), 403(b), thrift, or other defined contribution pension plan through an employer |
21.0 | 54.0 | 61.2 | 46.6 |
| Defined benefit pension through an employer | 8.8 | 22.0 | 34.1 | 21.8 |
| Individual Retirement Account (IRA) or Roth IRA | 12.8 | 29.7 | 43.4 | 28.9 |
| Savings outside a retirement account | 17.3 | 38.3 | 54.7 | 37.1 |
| Ownership of real estate or land that you plan to sell or rent to generate income in retirement | 8.2 | 12.8 | 25.2 | 15.2 |
| Ownership of my business | 4.0 | 4.9 | 11.2 | 6.5 |
| Other retirement savings | 6.2 | 9.0 | 18.9 | 11.2 |
| Total number of respondents | 4,414 |
Note: Among respondents who are not currently retired.
Since saving for retirement varies by employment status, individuals in lower-income households are less likely to have savings in part because they are less likely to be working. However, full-time workers in lower-income households are still much less likely to have savings (60 percent) than full-time workers in households with an income over $40,000 (89 percent). This suggests that a portion of the gap is also due to either differences in retirement benefits for the types of jobs held by individuals lower in the income distribution, or the fact that even these low-income individuals who work full time lack the financial capacity to save and contribute to retirement accounts.
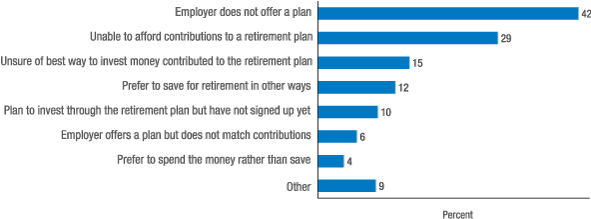
To better understand why some individuals are not saving for their retirement, the survey asks employed respondents who do not participate in a 401(k) plan (or similar) through work to state all of the reasons why they do not participate. Forty-two percent of respondents who do not participate in a plan indicate that they do not participate because their employer does not offer a plan, and 6 percent say that their employer offers a plan but does not match contributions (figure 21). The frequency of these responses is almost identical for workers of all three income levels. Twenty-nine percent of all workers, including 35 percent of workers with incomes under $40,000, say that they do not participate in a plan because they cannot afford to contribute to the plan. Additionally, 15 percent say that they do not participate in such a plan because they are unsure of the best way to invest their money in the plan, and 10 percent say that they plan to invest but have not yet signed up.
Figure 21. Please select all the reasons below for why you do not currently invest in a 401(k), 403(b), thrift, or other defined contribution plan from work.

Note: Among respondents not currently retired who do not have 401(k), 403(b), or thrift retirement savings.
Return to textMany respondents also express a lack of knowledge about both the amount they are contributing to their retirement plan and the level of the 401(k) match provided by their employer. When asked what fraction of their paycheck they contribute to their 401(k) plan, 23 percent of respondents who have a 401(k) retirement account say that they do not know what portion of their salary they contribute. Additionally, 41 percent of respondents whose employer offers a plan say they do not know the maximum fraction of their salary that their employer will match. This includes 73 percent of those who do not have savings in a 401(k) type account, but also 30 percent of those who do.
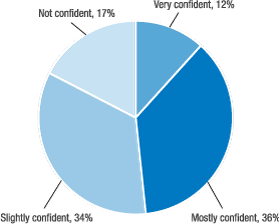
A number of respondents also indicate that they lack confidence in their ability to manage their investments. Just over half of respondents with self-directed retirement accounts (including 401(k), IRA, and savings outside retirement accounts) are either "not confident" or only "slightly confident" in their ability to make the right investment decisions when investing money in these accounts (figure 22).
Figure 22. How confident are you in your ability to make the right investment decisions when managing and investing the money in your retirement accounts?

Note: Among respondents with retirement savings in a self-directed retirement account.
Return to textEven when respondents do have established retirement savings accounts, a subset of non-retired respondents report drawing on these resources. Six percent of those with retirement savings report that they borrowed money from a retirement account during the year before the survey. Moreover, 5 percent of those with such accounts report that they cashed out (permanently withdrew) some of their retirement savings in the prior 12 months, and 1 percent indicate that they both borrowed money from and cashed out retirement accounts in that time. Additionally, 6 percent of non-retirees without retirement savings say that they borrowed from and/or cashed out their retirement savings, reflecting that some individuals previously had savings but have depleted the funds in those accounts.19
Expectations in Retirement
In addition to asking respondents about the retirement savings that they currently hold, the survey asks respondents about the sources of income that they plan to use to pay for expenses in retirement. There are differences by age in the sources of funds that respondents expect to use to pay for retirement expenses. This is especially apparent with respect to Social Security. Only 44 percent of those under age 30 say that they anticipate that Social Security benefits will be part of their plan to pay for expenses in retirement. This percentage steadily increases by age cohort, up to 92 percent of those over age 60 expecting to receive Social Security income in retirement. It is unclear whether these differences simply highlight the fact that older adults are likely to be thinking more actively about Social Security or if they represent diminishing levels of confidence among younger people about the future availability of Social Security benefits. Similarly, traditional defined-benefits pension plans are less common as an expected source of retirement funding among younger respondents. Thirty-six percent of those ages 60 and older are counting on income from a defined-benefit pension, while only 22 percent of those ages 18 to 29 plan on receiving income from a defined-benefit pension.
Many respondents expect continued employment to be a significant source of retirement income, with 45 percent of all respondents expecting to continue working in some capacity to cover their expenses and 26 percent expecting their spouse to continue working (table 20). Forty-six percent of respondents plan to rely on savings they hold outside formal retirement accounts to cover their expenses, while 37 percent plan to draw on savings in an IRA and 20 percent expect to sell or rent land or real estate to pay for retirement expenses.
| 18-29 | 30-44 | 45-59 | 60+ | Overall | |
|---|---|---|---|---|---|
| Social Security | 44.3 | 56.6 | 79.5 | 91.7 | 64.7 |
| I will continue working | 43.3 | 48.0 | 43.1 | 47.3 | 45.1 |
| Spouse/partner will continue working | 26.0 | 30.3 | 23.8 | 18.6 | 25.8 |
| Defined benefit pension from work | 22.5 | 27.4 | 43.5 | 36.3 | 32.3 |
| 401(k), 403(b), thrift or other defined contribution pension plan from work | 44.4 | 60.5 | 60.8 | 38.1 | 54.0 |
| Individual Retirement Account (IRA) | 31.6 | 37.5 | 41.5 | 35.8 | 37.0 |
| Savings outside a retirement account | 45.6 | 46.8 | 47.4 | 44.9 | 46.5 |
| Income from real estate or the sale of real estate | 14.9 | 20.8 | 20.8 | 23.7 | 19.6 |
| Income from a business or the sale of a business | 6.2 | 7.8 | 6.4 | 7.8 | 6.9 |
| Rely on children, grandchildren, or other family | 4.7 | 5.2 | 4.4 | 6.1 | 4.9 |
| Rely on inheritance | 8.6 | 9.0 | 7.6 | 5.1 | 8.0 |
| Other retirement savings | 12.2 | 12.4 | 19.0 | 15.7 | 14.8 |
| Total number of respondents | 3,838 |
Note: Among respondents who are not currently retired and plan to retire.
Experiences in Retirement
The survey asks respondents who are currently retired about their experiences in retirement and about how they manage their expenses. The most common age to retire is 62, with 20 percent of retirees who recall their retirement age stopping work at that age, followed by age 65, when 11 percent stopped working. Eighty-one percent of these current retirees report that they had stopped working by age 65. In contrast, among non-retirees who plan to retire and provided an expected retirement age, only 56 percent expect to retire by age 65 whereas 28 percent plan to work to age 70 or later.20
In terms of their path to retirement, a majority of current retirees (51 percent) say that they followed the traditional model of working full time until they retired, and then stopped working altogether. (This is more than double the percent of the non-retired reporting that this is the path they expect to follow.) However, many others followed less traditional paths. Seventeen percent eased into retirement, working fewer hours as they approached their retirement date. Others continued to work at some point after retirement. Six percent had retired from their previous career but later worked a full-time job, and 17 percent worked at a part-time job. Nine percent had retired from their previous career but then started working as self-employed.
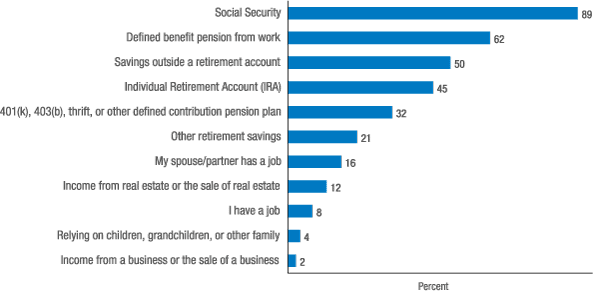
When it comes to sources of funds in retirement, 89 percent of those in retirement are drawing Social Security benefits (figure 23). Sixty-two percent are drawing a traditional defined benefit pension. Half draw on savings outside a retirement account, 45 percent use savings from an IRA, and nearly a third draw on a defined contribution plan. Twelve percent use income from real estate or the sale of real estate to fund expenses in retirement, and 8 percent currently earn wages from a job. Only 4 percent indicate that they are relying on children, grandchildren, or other family members to pay for their expenses.

Note: Among respondents who are currently retired.
Return to textReferences
18. For a summary of how the distribution of such plans has changed over time, see www.dol.gov/ebsa/pdf/historicaltables.pdf. Return to text
19. Some of these non-retired respondents may be cashing out from their retirement account to pay for retirement expenses as they near retirement. However, only 18 percent of respondents who cashed out a retirement account, 14 percent of those who borrowed money, and 7 percent of those who both borrowed and cashed out are over age 60, suggesting that may are doing so for other purposes. Return to text
20. This may overestimate the fraction of non-retirees who plan to retire by age 65, given that 12 percent of all non-retired respondents indicate that they do not plan to retire and an additional 9 percent say that they "will never stop working" when asked about their planned retirement age. Results for expected retirement age are similar if restricting non-retirees to those under age 60, indicating that the results are not driven by the selection into retirement among older adults. Return to text
