
FEDS Notes
 Print
PrintOctober 31, 2014
Accounting for Mortgage Charge-offs in the Financial Accounts of the United States
James Kennedy, Maria Perozek, and Paul Smith1
Introduction
The level of outstanding home mortgage debt in the United States has declined about $1.5 trillion, or 13 percent, since its peak six years ago. This large drop in mortgage debt has been the primary driver of the reduction in household liabilities often referred to as "household deleveraging" and frequently measured by statistics such as aggregate household debt relative to income. About 70 percent of the decline in mortgage debt has occurred as a consequence of banks and other entities that held residential mortgages "charging off" certain loan balances, i.e., removing them from their balance sheets as uncollectable, after borrowers defaulted on their payments and lenders foreclosed. In this note we describe recent changes in how mortgage charge-offs are accounted for in the Financial Accounts of the United States, and their effect on measures of net mortgage borrowing and personal saving in the Financial Accounts.
Prior to the June 2014 publication of the Financial Accounts, charge-offs were subtracted from mortgage originations in calculating net borrowing (or the flow of home mortgage debt, using Financial Accounts terminology). Beginning with the June 2014 publication, we now exclude charge-offs from the calculation of aggregate borrowing, and instead allow charge-offs to negatively affect the level of mortgage debt through another entry referred to as "other changes in volume." In Financial Accounts terms, we no longer include charge-offs in the flow of mortgage debt, though charge-offs still, of course, lower the level of debt outstanding. As a result, relative to previous publications, the new treatment increases the reported flow of mortgage debt (and hence reduces personal saving), but does not affect the estimated level of mortgage debt or household net worth.2
The change makes our treatment of mortgage charge-offs consistent with the System of National Accounts (SNA), which prescribes international guidelines for how to parse a change in the level of debt into three components: transactions (called "flows" in the Financial Accounts), revaluations due to changes in market prices, and a catch-all called other changes in volume.3 According to SNA guidelines, transactions should only include changes in claims resulting from mutual contractual agreement, and unilateral cancellation of debt by the lender, such as a charge-off, should be categorized as other changes in volume.4
Background: Changes in the Level of Home Mortgage Debt
The change in the level of home mortgage debt over a given period is affected by three factors: new mortgages being originated, existing mortgages being paid down or extinguished through amortization or prepayment (including those associated with home sales and refinancing), and existing mortgage debt being charged off due to nonperformance (typically the final step in a foreclosure proceeding). That is, the aggregate change in the level of mortgage debt is defined as originations less pay-downs less charge-offs. In the Financial Accounts, the decline in the level of mortgage debt can be seen on table L.218 (PDF).5
Prior to the June 2014 publication of the Financial Accounts, mortgage flows (shown on table F.218 (PDF)) were calculated as changes in the level of mortgage debt.6 As a result, charge-offs were effectively treated as part of the flow, and thus had the effect of reducing the quarterly measure of the aggregate flow of mortgage borrowing.
Beginning with the June 2014 publication, charge-offs are excluded from the flow of mortgage borrowing because unlike a prepayment from a home sale or refinancing, a charge-off is considered to be a unilateral cancellation of debt rather than a transaction between parties. As a result, charge-offs are now accounted for separately from other factors affecting the level of mortgage debt.
Home Mortgage Charge-Offs in the Financial Accounts
We report home mortgage charge-offs in each sector in the Financial Accounts that holds home mortgages as an asset, beginning in 2007q1.7 As shown in the table below, charge-offs of home mortgages increased dramatically during the financial crisis, from about $32 billion in 2007 to $239 billion in 2009, representing around 2 percent of mortgage debt outstanding in that year. Charge-offs have been declining gradually since 2009 but remain elevated, amounting to about $31 billion (at a semi-annual rate) in the first half of 2014. In total, about $1 trillion of home-mortgage debt has been charged off since 2007. Looking across sectors, mortgage charge-offs have been concentrated in U.S. depository institutions (e.g., banks and thrifts), government-sponsored enterprises (GSEs), and non-GSE issuers of asset-backed securities (ABS).8 This last category, which we refer to as "ABS issuers," has accounted for the largest share (about half) of cumulative charge-offs, as many of these mortgages were of lower credit quality than those in banks and thrifts or GSEs.
| Table 1: Charge-offs of Home Mortgage Debt by Sector ($ Billions) |
|---|
| Sector | 2007 | 2008 | 2009 | 2010 | 2011 | 2012 | 2013 | 2014H1 | Cumulative 2007-2014H1 |
|---|---|---|---|---|---|---|---|---|---|
| Total (quarterly rate) | 32.1 | 137.8 | 239.0 | 187.6 | 155.4 | 143.6 | 93.0 | 30.6 | 1,019.2 |
| US Depositories | 9.1 | 42.5 | 65.3 | 55.8 | 40.0 | 34.5 | 18.8 | 8.2 | 274.0 |
| GSEs | 2.7 | 10.4 | 43.0 | 39.8 | 36.5 | 29.1 | 18.2 | 6.2 | 186.1 |
| ABS Issuers | 19.0 | 79.7 | 121.7 | 84.6 | 74.0 | 75.9 | 53.6 | 15.4 | 523.8 |
| Other1 | 1.4 | 5.2 | 9.0 | 7.4 | 4.9 | 4.2 | 2.4 | 0.8 | 35.3 |
| Memo: | |||||||||
| Level of Mortgage Debt | 11,239 | 11,153 | 10,938 | 10,445 | 10,203 | 9,983 | 9,894 | 9,854 |
Source: Financial Accounts of the United States
1. Includes credit unions, REITs, and finance companies.
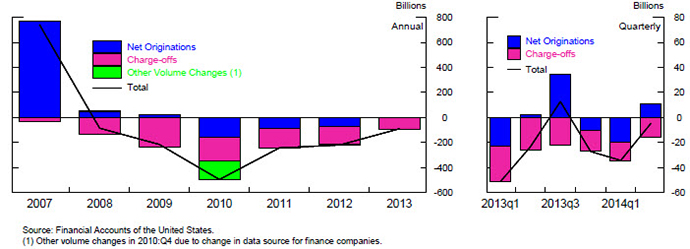
The figure below shows that charge-offs (the pink-shaded portion of the bars) have been the primary drivers of the changes in the level of mortgage debt over the past six years. In total, the level of mortgage debt contracted by about $1.5 trillion from year-end 2007 through the second quarter of 2014, with charge-offs accounting for about 70 percent of that decline. Net originations of home mortgages (the blue portion of the bars) were also sharply curtailed after 2007, as mortgage underwriting tightened considerably, home prices fell, and the share of home purchases made with cash increased substantially. Although net originations of home mortgages (excluding charge-offs) have yet to return to positive territory in any sustained way, they did edge up to zero over 2013 as a whole.
Effect of Charge-offs on Household Debt Growth
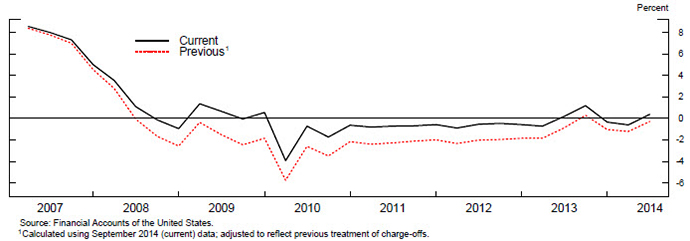
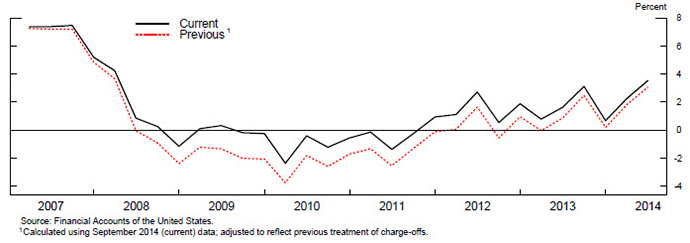
Debt growth in the Financial Accounts (shown in table D.1 (PDF)) is defined using the flow of debt (i.e., borrowing), rather than the change in the level of mortgage debt. As a result, removing charge-offs from the mortgage flow results in higher rates of debt growth, as shown in the figures below.9
Effect of Charge-offs on Personal Saving
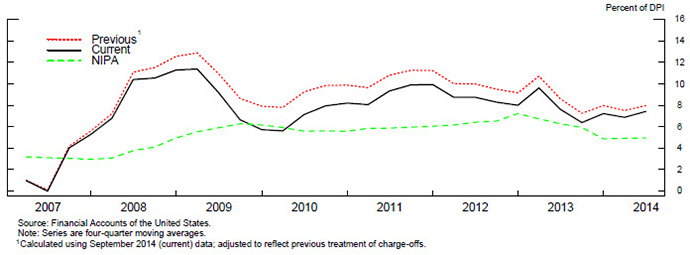
Personal saving in the Financial Accounts is defined as the net acquisition of assets in the household sector less the net increase in liabilities (or the flow of household borrowing). Removing charge-offs from home mortgage flows increases the measure of household borrowing, which decreases estimated personal saving. The effect can be seen in the figure below as the difference between the solid black line, which shows the current (September 2014) measure of personal saving (scaled by disposable personal income), and the dotted red line, which shows what the savings rate would have been under the previous treatment of charge-offs (i.e., including them in the mortgage flow). For reference, the dashed green line shows the measure of personal saving from the National Income and Product Accounts (NIPA).10 The figure shows that removing charge-offs from mortgage flows generally moves the Financial Accounts saving rate closer to the NIPA personal saving rate, and in some years accounts for a substantial share of the difference between the two measures, particularly in 2009 and 2010. This is not surprising, because the NIPA savings rate also conceptually excludes charge-offs, so our new accounting for mortgage charge-offs brings these independently measured series closer together in a conceptual sense.
In addition to this "direct effect" on the liability side of the household balance sheet, charge-offs also affect saving by raising the flows on certain types of MBS that are held on the asset side of the household balance sheet. Both GSEs and non-agency issuers of MBS hold mortgages as assets and issue MBS as liabilities.11 However, GSEs guarantee payments to holders of their MBS even if the underlying mortgages are in default, while non-agency issuers do not. As a result, charge-offs do not affect the book value of agency MBS, but they reduce the book value of non-agency MBS because they eliminate the unpaid balance of the non-performing loans. Thus, charge-offs result in a reduction in the book value of assets reported by the holders of non-agency MBS, including households and institutional investors such as mutual funds, life insurers, and pension funds.
As before, the SNA guidelines recommend accounting for this reduction in value as an "other change in volume" rather than a negative flow. In theory, these "other changes in volume" due to charge-offs on non-agency MBS should be allocated across all sectors in the Financial Accounts that hold non-agency MBS. Unfortunately, owing to data limitations, we are not able to assign charge-offs to institutional holders of non-agency MBS. As a result, by residual calculation, our current treatment results in an overstatement of household asset flows, and therefore personal saving, in the Financial Accounts.
Work is underway to collect data that will allow us to improve our estimates of asset flows and personal saving in the Financial Accounts. While we do not yet know exactly how much our estimates of personal saving will change after we remove charge-offs from the non-agency MBS flows of institutional holders, we can say that household saving will be revised down by no more than the total amount of non-agency MBS charge-offs in each year (shown in the "ABS Issuers" line of the table above), and likely some amount less.12
Appendix: Data Sources and Method for Estimating Mortgage Charge-offs by Sector
This appendix describes the source data we use to estimate sector-by-sector charge-offs of single-family mortgage debt (also known as "one-to-four" mortgage debt) in the Financial Accounts. In general, lenders typically report their gross charge-offs, recoveries, and net charge-offs (defined as gross charge-offs less recoveries). Gross charge-offs, which typically occur at the time of foreclosure, are defined as the unpaid balance of the mortgage. Recoveries include proceeds from the sale of the property, as well as payments to the lender from primary mortgage insurance, pool insurance, and seller/servicer repurchases of impaired loans.
In the Financial Accounts, the level of mortgage debt is measured at book value--i.e., the unpaid balance of outstanding mortgages. Gross charge-offs directly reduce MDO, because they eliminate the unpaid balance of nonperforming loans. Recoveries do not affect MDO, because they do not alter the unpaid balance, although recoveries do affect lenders through other channels. The expenses associated with foreclosing on a loan (for example, legal fees and property maintenance) also have no effect on MDO, because they do not alter the unpaid balance. Thus, the charge-offs reported in the Financial Accounts are gross (not net) charge-offs.
The source data for charge-offs of home mortgages by sector are described below.
Banks and thrifts
Charge-off data come from the FDIC website and cover all FDIC-insured banks and thrifts.13 The website includes a convenient utility that we use to extract data on charge-offs of first liens, closed-end junior liens, and home equity lines of credit (HELOCS), shown on lines 4 to 6 of the table. The FDIC utility does not allow us to extract charge-offs of single-family construction loans.14 However, we are able to compile single-family construction-loan charge-offs from the Call Report data.
GSEs
Fannie Mae and Freddie Mac report gross charge-offs in their 10-Q and 10-K SEC filings.15
Non-Agency MBS
The source data for charge-offs of non-agency MBS are from Moody's Analytics, which provides quarterly data on charge-offs and the unpaid balance for four types of mortgage pools: jumbo, Alt-A, sub-prime, and HELOC loans.16 The source data for the MDO of non-agency MBS are from the Vector Securities Summary Report, provided by LoanPerformance, a division of CoreLogic. We estimate non-agency-MBS charge-offs in the Financial Accounts by applying the charge-off rate from the Moody's data to the MDO of non-agency MBS in the Financial Accounts (which are based on source data from CoreLogic).17
Credit unions
The charge-off data are from the National Credit Union Association (NCUA) Report of Condition and Income for Credit Unions.
Other Lenders
For other lenders, including REITs and finance companies, we estimate charge-offs by applying the charge-off rate from other sectors to the unpaid balance of these sectors. These other lenders account for about 2.5 percent of total MDO.
1. Thank you to Liz Holmquist for helpful comments and Priya Punatar for excellent assistance with the data and charts. Return to text
2. Thus, for example, this change in accounting did not affect the ratio of aggregate household debt to income mentioned earlier. Return to text
3. The System of National Accounts, 2008, was jointly produced by the United Nations, the European Commission, the Organization for Economic Co-operation and Development, the International Monetary Fund and the World Bank Group, and can be found at http://unstats.un.org/unsd/nationalaccount/docs/SNA2008.pdf  . Return to text
4. The category "other changes in volume" is also recommended for changes in levels due to disaster losses such as those resulting from an earthquake or hurricane, and statistical breaks in a series due to changes in data sources or methodology. Return to text
5. The Financial Accounts publication can be found at http://www.federalreserve.gov/releases/z1/Current/. The Financial Accounts Guide, which describes the data sources and methods used to construct the statistics, can be found at http://www.federalreserve.gov/apps/fof/. Return to text
6. Revaluations due to changes in prices are not a factor for mortgages because in the Financial Accounts mortgages are measured at book value--i.e., the unpaid balance of the loans--rather than at market value. Return to text
7. The appendix provides details on the data sources and methodology used for measuring home mortgage charge-offs in each sector. Return to text
8. The GSEs Fannie Mae and Freddie Mac issued a large volume of mortgage-backed securities, often called "agency MBS," over this period. Various special purpose entities related to other (non-GSE) institutions, such as investment banks, also issued a large volume of MBS in the years before the crisis; these securities are sometimes referred to as "non-agency MBS" or "private-label securities" (PLS). Return to text
9. Note that the difference between the red and black lines is not entirely driven by charge-offs, but also reflects other data revisions between the March and September publications, especially in the most recent quarters. Return to text
10. The NIPA savings data come from the July 30, 2014 release. Return to text
11. In particular, we are referring to residential MBS in this Note; we are not including commercial MBS. Return to text
12. The size of the additional revision to saving will be limited by the amount of non-agency MBS charge-offs (about $54 billion in 2013, or 0.4 percent of disposable personal income). In fact, it will likely be somewhat less, because a (currently unknown) portion of outstanding non-agency MBS is held by the household sector itself, either directly or indirectly through other investments, such as mutual funds and pension funds. Return to text
13. See http://www2.fdic.gov/sdi/main.asp Return to text
14. The FDIC utility only shows total charge-offs of construction loans, an aggregation of single-family, multifamily and commercial loans. Return to text
15. Note that Ginnie Mae does not hold mortgages and therefore there are no charge-off data for this entity. Return to text
16. Sub-prime includes closed-end junior liens. Return to text
17. The Moody's measure of the unpaid balance of non-agency MBS is within a few percentage points of the CoreLogic measure. Return to text
Please cite as:
Kennedy, James E., Maria Perozek, and Paul A. Smith (2014). "Accounting for Mortgage Charge-Offs in the Financial Accounts of the United States," FEDS Notes. Washington: Board of Governors of the Federal Reserve System, October 31, 2014. https://doi.org/10.17016/2380-7172.0032
Disclaimer: FEDS Notes are articles in which Board economists offer their own views and present analysis on a range of topics in economics and finance. These articles are shorter and less technically oriented than FEDS Working Papers.
