
FEDS Notes
 Print
PrintMay 22, 2014
Assessing the Change in Labor Market Conditions
Hess Chung, Bruce Fallick, Christopher Nekarda, David Ratner1
The U.S. labor market is large and multifaceted. Often-cited indicators, such as the unemployment rate or payroll employment, measure a particular dimension of labor market activity, and it is not uncommon for different indicators to send conflicting signals about labor market conditions. Accordingly, analysts typically look at many indicators when attempting to gauge labor market improvement. However, it is often difficult to know how to weigh signals from various indicators. Statistical models can be useful to such efforts because they provide a way to summarize information from several indicators. This Note describes a dynamic factor model of labor market indicators that we have developed recently, which we call the labor market conditions index (LMCI). Details of the data, model, and estimation will be presented in a forthcoming FEDS working paper.
Estimating the labor market conditions index
A factor model is a statistical tool intended to extract a small number of unobserved factors that summarize the comovement among a larger set of correlated time series.2 In our model, these factors are assumed to summarize overall labor market conditions.3 What we call the LMCI is the primary source of common variation among 19 labor market indicators. One essential feature of our factor model is that its inference about labor market conditions places greater weight on indicators whose movements are highly correlated with each other. And, when indicators provide disparate signals, the model's assessment of overall labor market conditions reflects primarily those indicators that are in broad agreement.
The included indicators are a large but certainly not exhaustive set of the available data on the labor market, covering the broad categories of unemployment and underemployment, employment, workweeks, wages, vacancies, hiring, layoffs, quits, and surveys of consumers and businesses. Table 1 lists the 19 indicators and provides some basic information about each indicator. All are measured at a monthly frequency and have been seasonally adjusted.
| Table 1: Labor Market Indicators Included in the LMCI |
|---|
| Indicator | Source | Units | Series Start | Correlation with LMCI, 12-month changes |
|---|---|---|---|---|
| Unemployment and underemployment | ||||
| Unemployment rate | CPS | Percent of labor force | 1976m7 | -0.96 |
| Labor force participation rate | CPS | Percent of population | 1976m7 | 0.36 |
| Part time for economic reasons | CPS | Percent of labor force | 1976m7 | -0.91 |
| Employment | ||||
| Private payroll employment | CES | Percent of population | 1976m7 | 0.91 |
| Government payroll employment | CES | Percent of population | 1976m7 | 0.03 |
| Temporary help employment | CES | Percent of population | 1982m1 | 0.88 |
| Workweeks | ||||
| Average weekly hours (production) | CES | Hours | 1976m7 | 0.69 |
| Average weekly hours of persons at work | CPS | Hours | 1976m7 | 0.75 |
| Wages | ||||
| Average hourly earnings (production) | CES | $/hour, 12-month percent change | 1976m7 | 0.38 |
| Vacancies | ||||
| Composite help-wanted index | CB/authors | Index | 1976m7 | 0.93 |
| Hiring | ||||
| Hiring rate | JOLTS | Percent of payroll employment | 1990m4 | 0.78 |
| Transition rate from unemployment to employment | CPS | Percent of unemployment | 1976m7 | 0.76 |
| Layoffs | ||||
| Insured unemployment rate | ETA | Percent of covered employment | 1976m7 | -0.93 |
| Job losers unemployed less than 5 weeks | CPS | Percent of CPS employment | 1976m7 | -0.77 |
| Quits | ||||
| Quit rate | JOLTS | Percent of payroll employment | 1990m4 | 0.88 |
| Job leavers unemployed less than 5 weeks | CPS | Percent of CPS employment | 1976m7 | 0.42 |
| Consumer and business surveys | ||||
| Jobs plentiful v. hard to get | CB | Diffusion index | 1986m1 | 0.93 |
| Hiring plans | NFIB | Diffusion index | 1978m1 | 0.65 |
| Jobs hard to fill | NFIB | Diffusion index | 1986m1 | 0.83 |
Sources: CB = Conference Board, Help Wanted OnLine  and Consumer Confidence Survey ; CES = Bureau of Labor Statistics, Current Employment Statistics; CPS = Bureau of Labor Statistics, Current Population Survey; ETA = Department of Labor, Employment and Training Administration; JOLTS = Bureau of Labor Statistics, Job Openings and Labor Turnover Survey; NFIB = National Federation of Independent Business, Small Business Economic Trends .
Notes: Some series have been adjusted for methodological changes, data revisions, or calculated from underlying source data by the authors. Composite help-wanted index was estimated by authors following Barnichon (2010). JOLTS hiring and quit rate series were backcasted by authors using estimates from Davis, Faberman, and Haltiwanger (2012).
Because the various indicators are available for different time periods, and some are only available with a lag, we estimate the model on an unbalanced panel, a situation for which factor models are well suited. We begin our estimation sample in July 1976, when data are available for a majority of the indicators. The inputs to the factor model are detrended using a time-series filter.
To give some sense of which indicators are most influential for the LMCI, the last column of Table 1 reports the correlation of the 12-month change in each indicator with the 12-month change in the index. The unemployment rate and private payroll employment are most strongly related to the LMCI. The composite help-wanted index, the insured unemployment rate, the quit rate, and persons working part-time for economic reasons are also highly correlated with the index. In contrast, government employment, the participation rate, and average hourly earnings are relatively uncorrelated with the LMCI.
Changes in labor market conditions over the past 35 years
Chart 1 plots the average monthly change in the LMCI since 1977.4 Except for the final bar, which covers the first quarter of 2014, each of the bars represents the average over a six-month period. Changes in the LMCI align well with business cycles as defined by the National Bureau of Economic Research (NBER). The LMCI generally declines during recessions (the grey shaded areas) and typically rises during expansions.
| Chart 1: Average Monthly Change in LMCI |
|---|
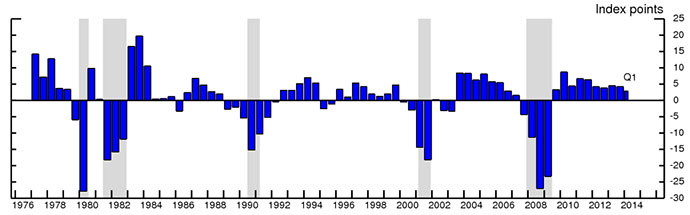 |
Table 2 reports the cumulative and average monthly change in the LMCI during each of the NBER-defined contractions and expansions since 1980. Over that time period, the LMCI has fallen about an average of 20 points per month during a recession and risen about 4 points per month during an expansion. In terms of the average monthly changes, then, the labor market improvement seen in the current expansion has been roughly in line with its typical pace. That said, the cumulative increase in the index since July 2009 (290 index points) is still smaller in magnitude than the extraordinarily large decline during the Great Recession (over 350 points from January 2008 to June 2009).
| Table 2: Change in LMCI during Contractions and Expansions |
|---|
| Start | End | Phase | Cumulative Change | Average monthly change |
|---|---|---|---|---|
| February 1980 | July 1980 | Contraction | -167 | -28 |
| August 1980 | July 1981 | Expansion | 68 | 6 |
| August 1981 | November 1982 | Contraction | -281 | -18 |
| December 1982 | July 1990 | Expansion | 319 | 3 |
| August 1990 | March 1991 | Contraction | -126 | -16 |
| April 1991 | March 2001 | Expansion | 150 | 1 |
| April 2001 | November 2001 | Contraction | -149 | -19 |
| December 2001 | December 2007 | Expansion | 206 | 3 |
| January 2008 | June 2009 | Contraction | -370 | -21 |
| July 2009 | April 2014 | Expansion | 290 | 5 |
| Memo: Average | ||||
| Contraction | -219 | -20 | ||
| Expansion | 207 | 4 | ||
Changes in labor market conditions since 2007
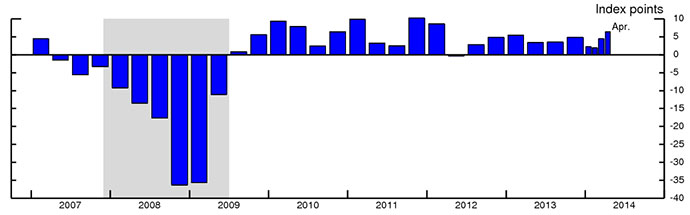
Chart 2 zooms in on the Great Recession and ongoing recovery, reporting the average monthly change for each quarter since 2007. The LMCI began falling in the second quarter of 2007 and deteriorated sharply in late 2008 and early 2009, as the financial crisis reached its height. The LMCI started improving in the second half of 2009, and the uneven pace of the ongoing labor market recovery is apparent at this time scale. Indeed, the LMCI captures several periods of sluggish improvement in the early parts of 2010, 2011, and 2012, which some dubbed the "spring swoons."5 The particularly marked slowdown in labor market improvement in the second quarter of 2012 stands out, as does the subsequent pick-up. Gains in the LMCI slowed a touch in the beginning of this year, likely reflecting unseasonably cold and snowy weather this winter, but the pace has picked up in recent months.
| Chart 2: Average Monthly Change in LMCI since 2007 |
|---|
 |
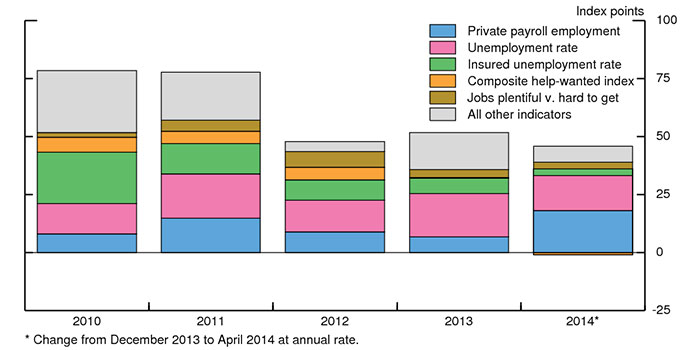
Over the recovery, as is typical, a few indicators account for the bulk of the increase in the LMCI. We can see this by decomposing the change in the LMCI into contributions from each indicator, holding the remaining indicators constant. Chart 3 shows the annual change in the LMCI and the contributions of 5 key indicators plus the sum of all other indicators. In the first two years of the recovery, the insured unemployment rate (the green portion of the bars) made a large contribution to the improvement in the LMCI, reflecting a substantial slowing in layoffs; this contribution has since diminished. Gains in private payroll employment (the blue portion of the bars) and declines in the unemployment rate (the pink portion of the bars) have been consistent contributors to the improvement, although more in some years than in others. So far in 2014, private employment and the unemployment rate have been the primary sources of improvement in the LMCI.
| Chart 3: Decomposition of Annual Change in LMCI |
|---|
 |
Closing remarks
Overall, the LMCI appears to be a useful tool for assessing the change in labor market conditions based on a broad array of labor market indicators. Of course, any purely statistical procedure may be sensitive to the many choices one must make in specifying the model, and will not take into account idiosyncratic events, at the one extreme, or changes in economic structures, on the other. A single model is, therefore, no substitute for judicious consideration of the various indicators. Nevertheless, such a model provides a summary that can usefully inform those deliberations.
References
Barnes, Michelle, Ryan Chahrour, Giovanni Olivei, and Gaoyan Tang. 2007. "A Principal Components Approach to Estimating Labor Market Pressure and Its Implications for Inflation." Federal Reserve Bank of Boston Public Policy Brief No.07-2.
Barnichon, Regis. 2010. "Building a Composite Help-Wanted Index." Economics Letters 109(3): 17578.
Davis, Steven J., R. Jason Faberman, and John Haltiwanger. 2012. "Labor Market Flows in the Cross Section and over Time." Journal of Monetary Economics 59(1): 118.
Hakkio, Craig S., and Jonathan L. Willis. 2013. "Assessing Labor Market Conditions: The Level of Activity and the Speed of Improvement." The Macro Bulletin, Federal Reserve Bank of Kansas City, July 18.
Stock, James H., and Mark W. Watson. 2011. "Dynamic Factor Models." In The Oxford Handbook of Economic Forecasting, edited by Michael P. Clements and David F. Hendry. Oxford University Press.
1. We are grateful to Gary Burtless for helping us account for changes in the unemployment insurance system. Dennis Mawhirter and Erik Larsson provided outstanding assistance on this project. Return to text
2. See Stock and Watson (2011) for a survey of dynamic factor models. Other examples of factor models of the labor market include Barnes and others (2007) and Hakkio and Willis (2013). Return to text
3. Technically, our model includes three latent factors; a single factor summarizes the bulk of the comovement of the 19 indicators. We report the two-sided estimate of the factor. The LMCI has mean zero and we normalize the standard deviation to 100 for clarity; an increase indicates an improvement in labor market conditions. Return to text
4. The level of the index itself has no obvious economically-meaningful interpretation. This is so for two reasons. First, the model's trends were not constructed to be informative about the full-employment levels of each series. Second, the index captures common movements only among the cyclical deviations of the indicators from their estimated trends, neglecting any common movements in those trends. Therefore, we present only the change in the index, rather than its level. Because the common components of the trends are slow moving in our specification, short-run changes in the index are informative about movements in overall labor market conditions. Return to text
5. For instance, see Rich Miller and Shobhana Chandra's April 21, 2013 article "Spring Swoon Sequel No Reason for Economic Growth Scare" (www.bloomberg.com/news/2013-04-21/spring-swoon-sequel-no-reason-for-economic-growth-scare-in-u-s-.html). Return to text
Please cite as:
Chung, Hess, Bruce Fallick, Christopher J. Nekarda, and David Ratner (2014). "Assessing the Change in Labor Market Conditions," FEDS Notes. Washington: Board of Governors of the Federal Reserve System, May 22, 2014. https://doi.org/10.17016/2380-7172.0019
Disclaimer: FEDS Notes are articles in which Board economists offer their own views and present analysis on a range of topics in economics and finance. These articles are shorter and less technically oriented than FEDS Working Papers.
