
FEDS Notes
 Print
PrintJune 24, 2014
Deleveraging: Is it over and what was it?
Claudia Sahm
Anyone who has followed the commentary on consumer spending in recent years has heard a lot about household deleveraging. In my opinion, much of the deleveraging talk shifts the focus from spending to debt without adding much new on what is driving household behavior. Yet, there are some aspects of debt that I do think economists' models of consumption often miss. Economists generally think of debt (or savings) as a way to move consumption from one point in time to another, but it is not so simple in an uncertain world. Leverage amplifies shocks (good and bad). If you buy a house with little money down and then house prices rise rapidly, your "return on investment" is great. If you do the same thing and house prices suddenly drop or worse you lose your job, it is a financial disaster. As these two examples illustrate, leverage (or debt) is not always bad, but it can magnify shocks. The rest of this post summarizes three new research papers that shed a bit more light on deleveraging.
When will deleveraging be over?
Economists or market analysts frequently point to deleveraging as a reason for the slow economic recovery rather than as a response to the economic environment, which seems unnecessary or even unhelpful to me. These arguments usually lack a sense of what the target amount of leverage is and why the target has changed so much. A new paper (PDF)  (and summary ) by Albuquerque, Baumann, and Krustev tries to address this issue empirically. The authors analyze state-level data on household debt and some likely conditioning factors (including the cost and supply of credit, demographics, and expectations). Figure 1 compares the actual ratio of debt to income (the solid line) to their estimate of the equilibrium level of leverage (the dashed line).1
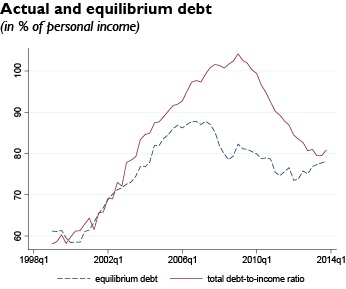
The authors argue that the current levels of leverage are close to equilibrium and thus deleveraging--and its likely drag on spending--may largely be over. I think it is also worth noting that the most pronounced gap between actual and equilibrium leverage did not appear until after house prices began declining and the recession was in full force.
What do households do when they can't repay their debts?
"Deleveraging" encompasses many different actions: 1) households pay off their prior debts 2) households take on (or have access to) less new debt and 3) households are unable to repay debts and banks then write off these bad debts. Households in this third category, who either could not repay their debts or decided to walk away from bad debts (so called "strategic defaults"), received some media attention during the recession, though there was not much academic research on these households at the time. A recent paper by Calem, Jagtiani, and Lang (PDF) examines the balance sheets of households who were going through a foreclosure.2 Given the increase in mortgage defaults in this recession, it took unusually long (averaging up to 3 years in some states) to go from initial delinquency to a completed foreclosure on a home. During the foreclosure process, households typically lived "rent free" in their homes. So what did these households do with the extra cash? The authors find a significant improvement in the performance of credit card debt (reduced delinquency and lower balances). Although these households were under considerable financial stress and were already facing a huge hit to their credit scores due to a foreclosure, they used some of the freed up money to pay off their other debts. (And many of these households became delinquent again on these non-mortgage debts after the foreclosure was completed.) Normally economists think that if you give cash to households who are financially constrained they will spend it not use it to service debt.3 The authors do not have measures of spending so it may have increased too, but it does seem many households were also making good on their prior debt contracts to the extent that they could. Households, who had experienced a big negative shock, appear to be prioritizing debt service (spending commitments made in the past) over current spending. You would need a careful model to know if it is financially "optimal" for a household in foreclosure to still focus on their other debts, but I find these results quite interesting.
And whose decision is deleveraging anyway?
If you listen to talk about deleveraging, it often suggests that indebted households are in the driver seat. And yet, lenders who are less willing to supply credit can also be a source of deleveraging. Sorting this out is tricky, but Gropp, Krainer, and Laderman (PDF) argue that reduced supply of credit from lenders (or a reduced willingness to lend) is actually a key driver of deleveraging. They examine changes in debt from 2008 to 2011 for households in counties that experienced large and small house price declines. Their innovation is to pay attention to whether a household started with mortgage debt (that is, whether the decline in house prices actually reduced their wealth).4 They find that being in a county that experienced a large house price decline was associated with relatively more deleveraging even for households without mortgages. They argue this is a sign of reduced credit supply rather than less demand for credit. I suspect it is near impossible to disentangle the demand and supply factors in this period--the spillovers to the local labor market alone make me skeptical. Still, their results underscore how tricky it is to interpret deleveraging--the relevant actor is not always the household (it may be the lender), and the eventual impact can extend to households who did not start with a lot of debt.
So have we learned anything?
I see these three new papers and many others in this growing literature as broadly consistent with the view that deleveraging is an adjustment to shocks in the Great Recession. There was a big hit to "permanent income" (households' expected lifetime income and net worth) and credit availability. Thus the level of spending and debt that made sense for households changed dramatically with the recession. Economists already understood this adjustment in the standard consumption framework even if the size and persistence of the shocks have been surprising. So in this sense "deleveraging" is simply a new way to frame the issue rather than a new behavior. And yet, we saw that the debt obligations that households made when everyone thought they were richer could not be easily undone. Our understanding of the ways in which debt constrains households who experience shocks is probably better now. For example, some research implies that when indebted households got some extra cash in the recovery it partly went to repay debts as opposed to new spending--which may also inform our thinking about the effects of fiscal stimulus. And there still appear to be some gaps to investigate between the ways households and economists think about debt. Deleveraging may (or may not) be over, but we still have more to learn from this episode.
1. The authors use the FRBNY Consumer Credit Panel (http://www.newyorkfed.org/microeconomics/ccp.html with Equifax credit records) to create a panel of state-level observations from 1999:Q1 to 2012:Q4. The 'pooled mean group' estimator they use is a panel error correction model (to deal with unit roots in debt and income). They also take into account the common variation across states at a particular point in time, trying to address a shortfall of many micro studies of the Great Recession, which focus only on the cross-sectional variation. Return to text
2. The authors use data on foreclosures that were started from 2004:Q1 to 2010:Q4. They merge mortgage-loan level data to the FRBNY Consumer Credit Panel. They focus households undergoing a foreclosure who were delinquent (at least 60 days past due) on at least one credit card at the start of the foreclosure. Return to text
3. Moreover, the amount of extra liquidity from living "rent free" during the foreclosure process was large. In 2011 Michael Feroli, an economist at JP Morgan estimated that the "squatter's rent" would be about $50 billion that year--roughly half the size of the payroll tax cut that year. http://www.bloomberg.com/news/2011-05-06/-squatter-rent-may-boost-spending-as-u-s-mortgage-holders-bail.html Return to text
4. These authors also use the FRBNY Consumer Credit Panel and the Senior Loan Officer Survey. Their identification is a "differences in differences" approach (non-mortgage versus mortgage households in boom versus non-boom counties). They use propensity score matching to implement the approach and there are controls to soak up some of the other demand-related covariates. Their measures of de-leveraging do not include mortgage debt (for an obvious reason) but that does miss the component of debt that has decreased the most. Return to text
Please cite as:
Sahm, Claudia R. (2014). "Deleveraging: Is it Over and What Was It?" FEDS Notes. Washington: Board of Governors of the Federal Reserve System, June 24, 2014. https://doi.org/10.17016/2380-7172.0022
Disclaimer: FEDS Notes are articles in which Board economists offer their own views and present analysis on a range of topics in economics and finance. These articles are shorter and less technically oriented than FEDS Working Papers.