
FEDS Notes
 Print
PrintJuly 21, 2014
The Recent Decline in Long-Term Unemployment
Tomaz Cajner and David Ratner1
In this FEDS Note we take a deeper look at the sizeable decline in long-term unemployment seen over the first half of 2014 and find a number of reasons to be optimistic about this development: (1) the drop in the rate of long-term joblessness since December has coincided with a stable labor force participation rate and a rising employment/population ratio, (2) job-finding rates of the long-term unemployed have edged up recently, (3) their ability to find stable employment appears to be improving along with the short-term unemployed, and (4) their attachment to the labor force does not appear to differ substantially from that of the short-term unemployed.
As frequently noted by economic analysts, one of the worrisome features of the Great Recession was the unprecedented increase in the share of individuals unemployed for more than six months (henceforth, long-term unemployed). During the depths of the recent cyclical downturn, the long-term share of unemployment peaked at 45 percent; it remained elevated at 33 percent through June. For comparison, the previous peak reached by this share in the aftermath of the 1982 recession was just 26 percent. As Figure 1 illustrates, in many ways the fight against unemployment during the recent recovery has been mainly one of bringing down the long-term unemployment rate. By the end of 2010, short-term unemployment rates (the blue and green lines) were only 1/2 percentage point above their pre-recession levels, while the long-term unemployment rate (in red) was markedly elevated.2 Since then, about two-thirds of the decline in the aggregate unemployment rate can be accounted for by a retracing of the long-term unemployment rate.
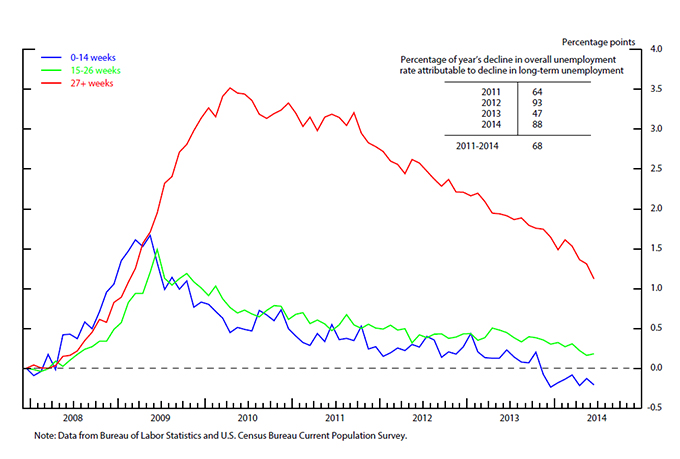
The same patterns are evident over the first half of 2014. Since December 2013, the long-term unemployment rate dropped 0.5 percentage point, thereby accounting for almost the entire decline in the aggregate unemployment rate. At the same time, the aggregate labor force participation rate remained unchanged, on net, at 62.8 percent and the aggregate employment-population ratio rose 0.4 percentage point. These encouraging developments appear consistent with rising employment of those previously reported as long-term unemployed.
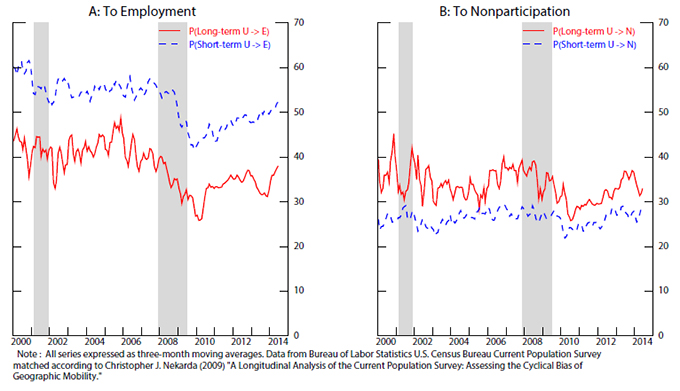
Perhaps surprisingly, improvement in the job-finding prospects of the long-term unemployed has not been readily evident in some standard measures of labor market flows. As shown in Panel A of Figure 2, their monthly probability of moving from unemployment to employment has recovered only modestly and still remains depressed relative to its pre-recession level.3 Moreover, Panel B of Figure 1 indicates that the long-term unemployed are about twice as likely to move to nonparticipation (that is, to drop out of the labor force) as to employment.
The interpretation of these monthly transitions is challenging. Indeed, the monthly transition rate from unemployment to nonparticipation for the long-term unemployed, currently around 25 percent, would imply that the stock of the long-term unemployed should have vanished long ago (given that layoffs have fallen sharply in recent years). So there's more going on than meets the eye. Our analysis of the labor flows data indicates that long-term unemployed are frequently moving between unemployment and nonparticipation, possibly due to a lower search intensity which doesn't always qualify them as unemployed from the viewpoint of the BLS (in order to be classified as unemployed, one needs to actively search in the four weeks preceding the CPS survey).4 Moreover, when interpreting the recent increase in the exit rate to nonparticipation, one has to keep in mind recent research showing that this is expected in a recovery. In particular, during recessions the composition of the unemployment pool adjusts towards individuals with greater labor market attachment, leading to a fall in the exit rate from unemployment to nonparticipation. Over a recovery, the composition effect naturally unwinds, causing the exit rate to rise.5 Indeed, a similar pattern appeared during and after the 2001 recession.
We next look at yearly labor market transition rates, in particular, at the share of individuals that were unemployed one year ago but are employed or nonparticipants today.6 As depicted in Panel A of Figure 3, the yearly unemployment-employment transition rate for the long-term unemployed has recovered substantially. Currently, a person who was classified as long-term unemployed one year ago has a 38 percent probability of being employed today, which is only a touch below the same probability before the recession; moreover, in relative terms it is only moderately below the probability that someone who was short-term unemployed a year ago is employed today (slightly above 50 percent). Importantly, at the yearly frequency, the long-term unemployed are currently more likely to transition to employment than to nonparticipation, in stark contrast with the monthly flows data. This is consistent with the interpretation that the labor market status of long-term unemployed is blurred by their frequent monthly transitions into nonparticipation and back.
There are reasons to believe that yearly labor market transition rates can provide additional information above that in the monthly rates when examining the long-term unemployed. Importantly, even if the monthly job-finding rate of the long-term unemployed does not improve at all, but the probability of subsequent job loss is falling, this will be reflected in the yearly job-finding rate. Secondly, if the long-term unemployed are more likely to temporarily exit the labor force (or become misclassified as such) and then move to employment directly from nonparticipation, monthly job-finding rates will miss those transitions, but the yearly rate will capture them. Lastly, measurement error in estimated monthly job-finding rates is substantial but can potentially wash out over the yearly horizon.
The CPS also offers another view into the labor market attachment of the long- and short-term unemployed by tracking the experiences of individual survey respondents. In particular, we track individuals who were unemployed in their first month in the CPS, and follow their labor market outcomes 12-15 months later.7 The message sent by these data also paints a somewhat more encouraging picture for the labor market outcomes of the long-term unemployed than do the monthly transition rates. As panel A of Figure 4 shows, the probability that the long-term are "stably" employed--defined as being employed in all months 13 to 16 after their initial participation in the CPS--is typically lower than for the short-term unemployed, but in relative terms only by about one third on average; moreover their prospects of finding stable employment have not deteriorated relative to the short-term over the last year. Finally, panel B of Figure 4 shows that the long-term unemployed do not drop out of the labor market "persistently"--which we define as being out of the labor force in all months 13 to 16--at a substantially higher rate than do the short-term unemployed.


1. We thank Dennis Mawhirter and Tyler Petersen for excellent research assistance. Return to text
2. For analysis of cross-state variation in the recovery of short- and long-term unemployment see the FEDS Note by Christopher L. Smith (2014) "Using cross-state variation to assess the potential for additional improvement in measures of labor market conditions." Return to text
3. All transition rates presented in Figures 2 through 4 start in January, 2000 and end in June, 2014. Return to text
4. Theoretically, every time an individual moves out of unemployment, his unemployment duration should be reset to zero. However, the CPS data show that many individuals that transition to unemployment from employment or nonparticipation actually report high unemployment durations. See also Michael W.L. Elsby, Bart Hobijn, Aysegül Sahin, and Robert G. Valletta (2011) "The Labor Market in the Great Recession--An Update to September 2011." Return to text
5. See Michael W.L. Elsby, Bart Hobijn, and Aysegül Sahin (2013), "On the Importance of the Participation Margin for Labor Market Fluctuations," FRBSF Working Paper, 2013-05. Return to text
6. More precisely, we look at longitudinally matched individuals in the CPS data that can be observed in periods that are 12 months apart. For a similar approach, see Alan B. Krueger, Judd Cramer, and David Cho (2014): "Are the Long-Term Unemployed on the Margins of the Labor Market? (PDF)"  This paper averages data from 2008 to 2013, while we focus here on the time variation and recent developments. Return to text
7. The structure of the CPS determines the period of time over which one can track a worker. In particular, individuals are in the CPS survey for four months, followed by eight months off, and then four months back in. Thus, we can track an individual for at most 16 months. Return to text
Please cite as:
Cajner, Tomaz, and David Ratner (2014). "The Recent Decline in Long-Term Unemployment," FEDS Notes. Washington: Board of Governors of the Federal Reserve System, July 21, 2014. https://doi.org/10.17016/2380-7172.0024
Disclaimer: FEDS Notes are articles in which Board economists offer their own views and present analysis on a range of topics in economics and finance. These articles are shorter and less technically oriented than FEDS Working Papers.