
FEDS Notes
 Print
PrintJune 2, 2014
Using cross-state variation to assess the potential for additional improvement in measures of labor market conditions
Christopher L. Smith
Introduction
While the national unemployment rate and the monthly change in payroll employment receive considerable attention among analysts seeking to assess the current state of the labor market, a broader range of labor market indicators are potentially also useful. For example, Chair Yellen has recently pointed to additional indicators such as the number of long-term unemployed, the labor force participation rate, the quit rate, the hiring rate, the share of workers part-time for economic reasons, and wage growth--all of which have continued to show sizable deviations from their pre-recession levels.1 One interpretation of these measures remaining weak relative to their pre-recession levels is that there is still significant slack in the labor market. Alternatively, these measures may be weak for structural reasons.
In this Note, I use cross-state variation to address the question: "As a state's labor market returns to its pre-recession norm by some measures, what happens to other indicators of labor slack and labor market health?" By assessing the co-movement of improvement in various labor market measures across states, this approach can possibly provide insight into the reasons (cyclical or structural) why some labor market measures have not yet returned to their pre-recession levels. In particular, I explore whether states that have experienced larger decreases in short-term unemployment have also seen greater improvements in these other labor market indicators; if they haven't, the cross-state evidence could be interpreted as suggesting the existence of strong structural impediments in the labor market that might limit these indicators' usefulness for gauging overall labor slack and the degree of labor market improvement.
Using cross-state variation to assess the potential for additional labor market improvement
Some other recent research has also used cross-state variation to explore reasons behind the relatively weak state of the aggregate labor market. For example, some have noted that long-term unemployment (LTU) rates remain elevated even in areas where their labor market has improved along other dimensions, suggesting the aggregate LTU may be structurally elevated. In contrast, others have found that, once a state's short-term unemployment (STU) rate moves close to its pre-recession level, the LTU rate does appear related to wage growth, suggesting against a purely structural interpretation.2 Relatedly, a recent FEDS working paper uses cross-city data on STU and LTU rates, and CPI price inflation to show that the STU and LTU tend to have the same influence on price inflation3, and in a companion FEDS Note, I use state-level variation to show that the STU and LTU also tend to have the same influence on wage inflation.4
In this Note, the primary measure I use to gauge how far a state's labor market is from full health (the degree of "normalization" in the state's labor market) is the state's STU rate relative to its pre-recession level (specifically, the STU rate in 2013 divided by its 2003-2007 average).5 There are multiple advantages in using the STU rate (relative to pre-recession levels) to gauge the health of a state's labor market:
- The national STU rate has mostly returned to its pre-recession level, suggesting that its behavior is strongly influenced by cyclical labor demand.
- Most arguments about structural labor market issues center around skills-mismatch, skills-depreciation, or employer discrimination, which are less likely to affect the STU.
- There remains significant variation across states in far their STU rates are from their pre-recession levels.
For the other labor market variables, I analogously construct ratios for 2013 averages relative to pre-recession (2003-2007) averages.6 I then estimate the cross-state relationship between the STU rate ratio and ratios for these other labor market variables.
To begin, Figure 1 plots the cross-state relationship between the ratios for the STU and LTU rates.7 The x-axis plots the state's STU rate ratio, and the y-axis plots the state's LTU rate ratio (for each, the ratio is 2013 relative to 2003-2007). A state to the left of the vertical line had an average STU rate in 2013 that was at or below its pre-recession average, whereas a state to the right had a STU rate that was still elevated. I also plot a line from a regression of the LTU rate ratio on the STU rate ratio, weighted by the state's population. The equation for this regression line is provided at the bottom (one, two or three stars indicate statistical significance at the 10, 5 or 1 percent level, respectively).
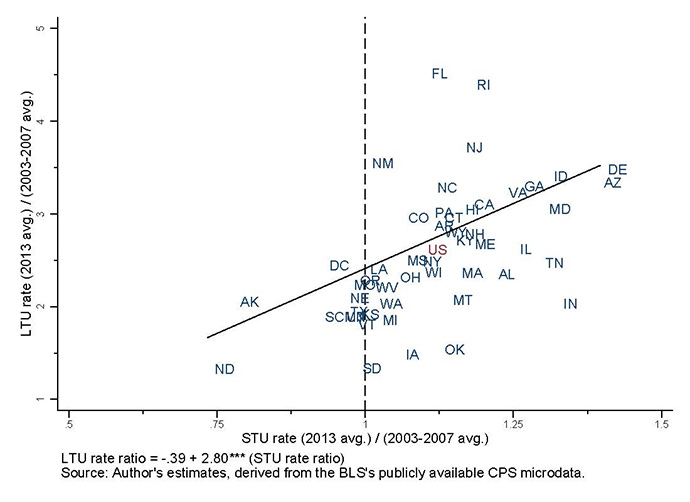
There are two important observations from this figure:
- There is a strong, positive cross-state relationship between these measures: In states where the STU rate has returned near pre-recession levels, the LTU rate has also moved closer to pre-recession levels. This suggests that improvement in the LTU aggregate rate is indeed possible--as a state's labor market improves along the STU margin, the LTU rate also tends to move down.
- However, even for most states in which the STU rate has or nearly has returned to normal, the LTU rate remains elevated. For instance, North Dakota has a STU rate that is only 75 percent of its pre-recession average, whereas its LTU rate is still about 150 percent of its pre-recession average. One interpretation is that the aggregate LTU rate remains somewhat elevated due to structural reasons, because even when a state's STU rate returns to normal, the LTU rate is still high. Alternatively, it may be that, even in these states, labor demand still hasn't recovered enough for firms to hire the LTU in significant numbers--but once labor demand additionally improves, the LTU rate will decline further.
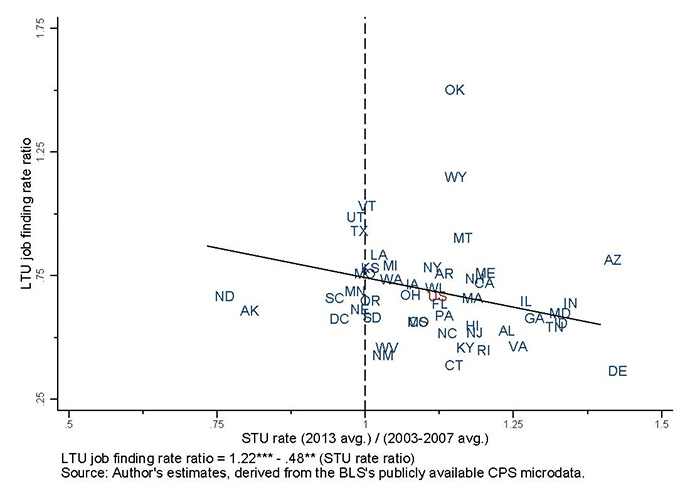
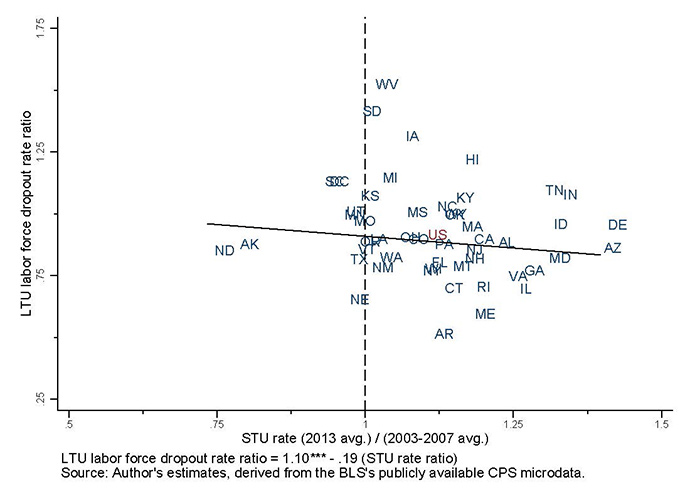
Is this cross-state relationship driven more by an improvement in job finding rates for the LTU, or more by an increase in the rate at which they drop out of the labor force? To investigate, Figures 2a and 2b plot on the y-axis the ratio of the monthly job finding rate for the LTU (the fraction finding employment each month) or labor force dropout rate (the fraction dropping out of the labor force each month), again for 2013 relative to 2003-2007 averages.8 These figures suggest that the job-finding rate for the LTU moves up as the STU rate normalizes, but that the dropout rate for the LTU does not significantly move up to its pre-recession level. In other words, in states where the LTU rate has moved closer to normal, the LTU rate has also moved closer to normal mainly because the LTU are increasingly likely to find jobs.
| Figure 2: Relationship between LTU job finding and LF dropout rates and STU rates |
|---|
Fig 2a: LTU job finding rate
 |
|---|
Fig 2b: LTU LF dropout rate
 |
|---|
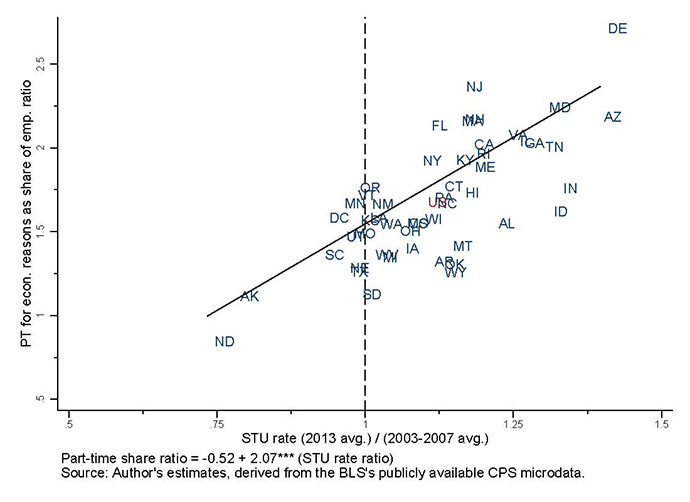
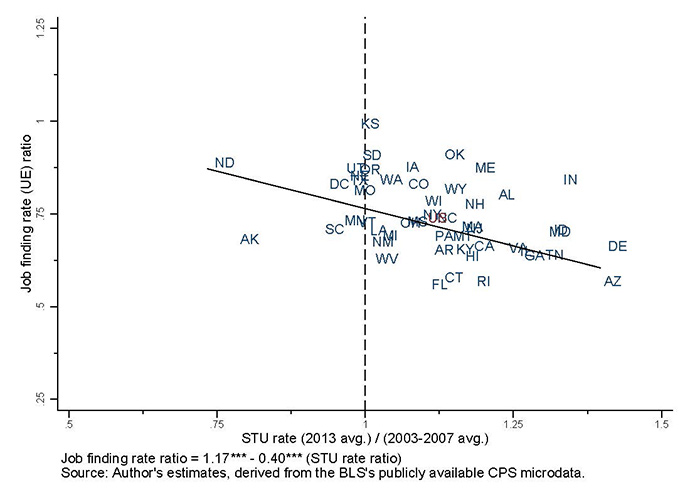
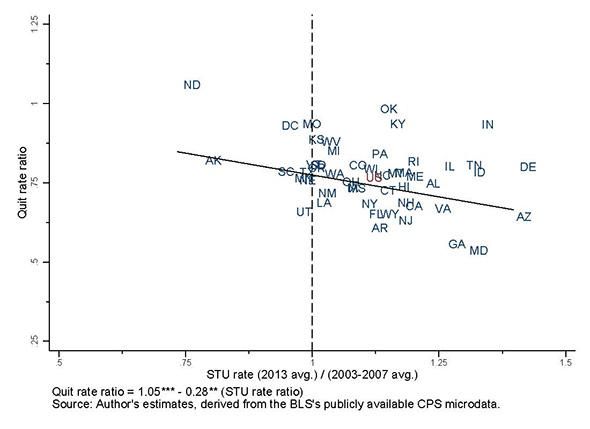
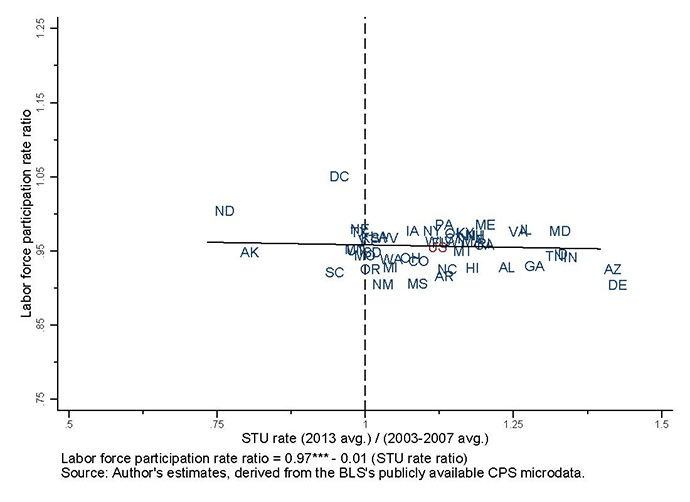
Figures 3a-3d plot the relationship between normalization of the STU rate and normalization of four other labor market measures (all measured as 2013 averages relative to 2003-2007 averages): the share of employment that is part-time for economic reasons (PTER), the CPS-based job finding rate, the CPS-based quit rate, and the labor force participation rate (LFPR).9
| Figure 3: Relationship between other labor market measures and STU rates |
|---|
Fig 3a: PT for econ. reasons
 |
|---|
Fig 3b: CPS job finding rate
 |
|---|
Fig 3c: CPS quit rate
 |
|---|
Fig 3d: Labor force participation rate
 |
|---|
In states where the STU rate is closer to its pre-recession norm, the PTER rate, the job finding rate, and the quit rate have all moved closer to their pre-recession levels (the PTER falling to normal, the other rates rising to normal), whereas there is no apparent cross-state relationship for normalization of the LFPR. This may suggest that structural explanations (such as retirement for older people) could explain a more significant portion of the difference between the LFPR and its pre-recession average, while cyclical weakness may be more important for the other measures.10
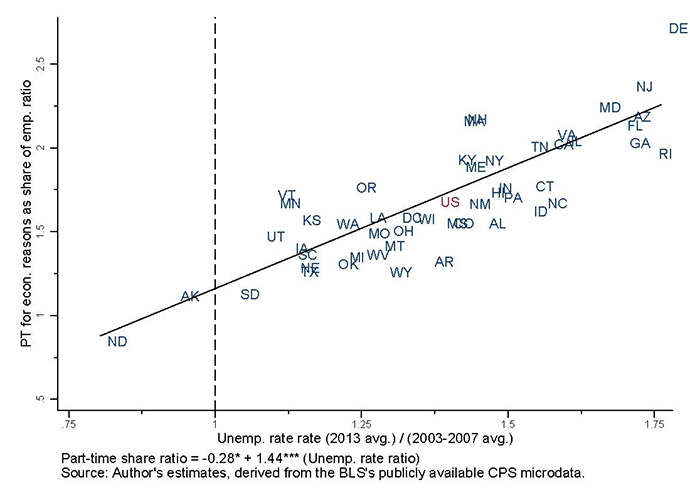
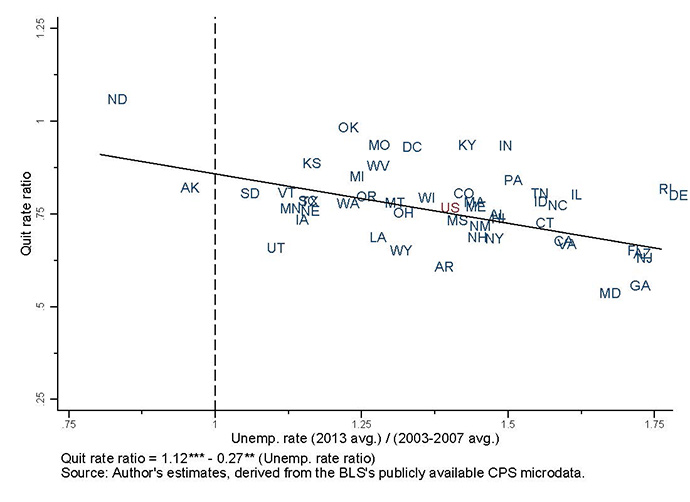
As discussed earlier, the STU rate is a very conservative measure of how much a state's labor market has normalized, and so it is instructive to repeat this analysis using the total unemployment rate in place of the STU rate. Figures 4a and 4b plot the PTER rate and quit rate ratios against the total unemployment rate ratio (again, 2013 relative to 2003-2007). In these figures, when a state's total unemployment rate returns to its pre-recession average (the vertical line), the PTER rate and quit rate have mostly (but not entirely) moved back to normal--further evidence that, as a state's labor market returns to its pre-recession norm, other measures of slack also return close to their pre-recession norms.
| Figure 4: Figure 4: Relationship between labor market measures and unemployment rates |
|---|
Fig 4a: PT for econ. reasons
 |
|---|
Fig 4b: CPS quit rate
 |
|---|
Conclusion
As the unemployment rate moves closer to the FOMC's expectation of its long-run level11 , it becomes increasingly important to consider signals of labor market slack from a variety of measures. If some measures differ from historic norms for primarily structural reasons, comparing them to pre-recession levels may lead one to overestimate the degree of slack remaining in the labor market. However, the analysis in this Note has revealed that across states, most of these measures move toward their pre-recession averages as other measures of labor market slack (the STU rate or the aggregate unemployment rate) move towards normal. Therefore, it seems likely that additional improvements in these other measures are possible, both across states and in the aggregate, in response to additional increases in labor demand. To be sure, this cross-state analysis cannot uncover exactly how much of the differences in these measures from their pre-recession levels are due to cyclical versus structural reasons--but it does suggest that at least part is cyclical, and that additional improvements in these measures are possible.12
1. For example, see: "What the Federal Reserve Is Doing to Promote a Stronger Labor Market," Federal Reserve Chair Janet Yellen, March 31, 2014: http://www.federalreserve.gov/newsevents/speech/yellen20140331a.htm. In a companion note, I focus on what can be learned from state-level variation in wage inflation. Return to text
2. Regarding the first observation, see Figures 15a and 15b from Krueger, Cramer, and Cho, "Are the Long-Term Unemployed on the Margins of the Labor Market?" Brookings Panel on Economic Activity, March 20-21, 2014. Regarding the second, see Charts 15 and 16 from Deutsche Bank's Global Economic Perspectives Research brief on April 10, 2014, "The Coming Upturn in US Wage Inflation." Following the BLS definition, I define short-term unemployed as persons unemployed 26 weeks or less, and long-term unemployed as persons unemployed 27 weeks or longer. Return to text
3. Michael T. Kiley, "An Evaluation of the Inflationary Pressure Associated with Short- and Long-term Unemployment," Board of Governors of the Federal Reserve System, Finance and Economic Discussion Series 2014-28. Return to text
4. Christopher L. Smith, "The Effect of Labor Slack on Wages: Evidence from State-Level Relationships." Return to text
5. The STU rate is a very conservative metric for gauging the normality of a state's labor market, because it assumes that all additional unemployment (e.g. the LTU) is structural. Indeed, Figure 1 shows that in states where the STU rate has moved closer to its pre-recession average, the LTU rate also has. Return to text
6. All estimates are derived from the BLS's publicly available microdata for the Current Population Survey (CPS). Return to text
7. The value for the US aggregate, for comparison, is provided in red. I drop Nevada from the plots and regression line, as it is a significant outlier in most cases. Return to text
8. The job finding rate and labor force dropout rates for the long-term unemployed are defined, respectively, as the fraction of LTU finding employment in the next month, and the fraction of the LTU dropping out of the labor force in the next month. These rates are computed using matched CPS microdata. Return to text
9. The CPS-based job finding and quit rates are components of the aggregate hiring rate. The job finding rate is estimated as the fraction of unemployed persons who find employment in the next month. The quit rate is approximated as the number of employed persons who worked at a different employer last month plus the number of unemployed persons who were employed last month and reported quitting their previous job, divided by the current number of employed persons. This is not exactly the "true" quit rate, since it includes persons who are employed at a different employer and may have transitioned jobs involuntarily, and excludes persons who quit and exited the labor force. Return to text
10. Nevertheless, in unreported results, some sub-categories of non-participation, such those who report not looking for a job for discouragement-related reasons, or persons not actively seeking work who would work if a job were offered to them, do normalize as the STU rate normalizes--suggesting that some components of the decline in LFPR may indeed represent cyclical weakness. Return to text
11. The unemployment rate was 6.3 percent in April 2014, whereas the central tendency of the FOMC's assessment of its longer-run level ranged from 5.2 to 5.6 percent (as of the March 2014 Summary of Economic Projections). Return to text
12. One other caution is that my interpretation assumes that, as labor demand recovers further, the STU and aggregate unemployment rates will normalize further in states for which these measures are still elevated. However, if labor markets show continued weakness in some states for structural reasons (e.g. differential impact and recovery from the housing market bust), then the STU and aggregate unemployment rates may remain elevated in these states for structural reasons. If so, then other measures of slack in these states may remain away from their pre-recession norms for longer, and national measures of labor market conditions may be structurally elevated/depressed due to state-specific structural issues. Return to text
Please cite as:
Smith, Christopher L. (2014). "Using Cross-State Variation to Assess the Potential for Additional Improvement in Measures of Labor Market Conditions," FEDS Notes. Washington: Board of Governors of the Federal Reserve System, June 02, 2014. https://doi.org/10.17016/2380-7172.0020
Disclaimer: FEDS Notes are articles in which Board economists offer their own views and present analysis on a range of topics in economics and finance. These articles are shorter and less technically oriented than FEDS Working Papers.
