
FEDS Notes
 Print
PrintOctober 15, 2015
Should you trust things you hear online? Comparing SHED and Census Bureau survey results
Jeff Larrimore, Maximilian Schmeiser, and Sebastian Devlin-Foltz
In the fall of 2013, the Federal Reserve Board began conducting the Survey of Household Economics and Decisionmaking (SHED), which is an annual survey of individual consumers designed to monitor their well-being and identify risks to their financial stability.1 In contrast to other surveys such as the Census Bureau's Current Population Survey (CPS), American Community Survey (ACS), and Survey of Income and Program Participation (SIPP), the SHED is administered online to a preexisting survey sample. Respondents to the SHED are drawn from a large nationally representative online panel of respondents that is administered by the consumer research firm GfK. The participants in GfK's panel are selected using random address based sampling and, as is the case with telephone and face-to-face surveys, respondents must be selected for participation and cannot opt-in to the panel. However, in contrast to surveys using other modes, the SHED survey itself is then administered to a subset of the GfK panel through an online interface.2
Given the substantially lower cost of online surveys relative to phone surveys or face-to-face interviews, online surveys can be a valuable tool if they provide similar responses to surveys conducted using other modes. Although most questions in the SHED are unique to that survey, a number of overlapping questions are included from other surveys that were conducted using other data collection modes. Specifically, we can compare identical or similar questions in the SHED to those in the CPS, ACS, or SIPP with respect to demographics, employment, banking, health insurance, housing, retirement savings, and income stability. If responses to the SHED are consistent with these well-established datasets, it increases our confidence in the quality of the SHED data and the estimates it provides for questions not covered by other surveys. Previous efforts to validate the results of the SHED using other data sources generally yielded similar population estimates for key questions and characteristics. Several of these comparisons to other data were discussed in the Report on the Economic Well-Being of U.S. Households (Board of Governors of the Federal Reserve System 2014, 2015). This paper more thoroughly explores comparisons across datasets, including comparisons of results by age and income groups.
The following sections summarize the results of these comparisons. Except where otherwise noted, all results are based on the 2014 SHED data, the 2014 March CPS, the June 2013 CPS unbanked supplement, the one-year ACS sample, and wave 16 of the 2008 SIPP survey which was conducted in the fall of 2013. The CPS and SIPP data used in this paper were accessed through the National Bureau of Economic Research.3 Reflecting the SHED's sampling of only those respondents age 18 and older, all results from each dataset are restricted to adults age 18 and older.
General Demographics
In Table 1 we start with a basic comparison of the SHED to the ACS, the March CPS, and the SIPP for key demographic characteristics including the income, marital status, age, and race of respondents after the application of population weights. Comparing the demographics across the datasets, the weighted characteristics of respondents in the SHED data are consistent with those seen in each of the Census based datasets. This is to be expected, since the SHED weights responses on several variables to match the CPS.4 Nevertheless, we observe that the similarities in demographics hold both for variables which are explicitly weighted to CPS estimates (income, age, and race) and for those which are not (marital status).
| Table 1: Summary Statistics 1 |
|---|
| SHED (2014) |
CPS (March 2014) |
SIPP (2014) |
ACS (2013) |
|
|---|---|---|---|---|
| Marital status | ||||
| Married | 52.1 | 53.2 | 52.6 | 52.6 |
| Never married (incl. living w/ partner) | 31.8 | 28 | 28.5 | 29.7 |
| Divorced, widowed | 16.1 | 18.8 | 19 | 17.8 |
| Age | ||||
| 18-24 | 11.1 | 12.6 | 12.9 | 13 |
| 25-34 | 19 | 17.7 | 17.5 | 17.5 |
| 35-44 | 16.5 | 16.6 | 16.7 | 16.8 |
| 45-54 | 16.2 | 17.9 | 18.2 | 18 |
| 55-64 | 18.9 | 16.6 | 16.5 | 16.2 |
| 65-74 | 18.3 | 18.6 | 18.3 | 18.4 |
| Race/Ethnicity | ||||
| White, non-Hispanic | 65.8 | 65.5 | 67.6 | 65.5 |
| Black, non-Hispanic | 11.5 | 11.6 | 12 | 11.9 |
| Other, non-Hispanic | 6.4 | 6.5 | 4.8 | 6.1 |
| Hispanic | 15.1 | 15.2 | 15.6 | 15 |
| 2+ races, non-Hispanic | 1.3 | 1.3 | n.a. | 1.8 |
| Income | ||||
| $0-$25k | 17.8 | 17.9 | 18.1 | 21.5 |
| $25k-$50k | 21.9 | 22.5 | 25.4 | 22.1 |
| $50k-$75k | 19 | 18.4 | 19.5 | 17.1 |
| $75k-$100k | 13.6 | 13.6 | 13.5 | 12 |
| $100k+ | 27.7 | 27.7 | 23.5 | 27.3 |
1. SIPP data is based on wave 16 of the 2008 panel, so depending on the survey cycle of each respondent the income information covers a 12 month period between Sept-Dec 2012 and Aug-Nov 2013 Return to text
Source: Author's calculations using the Federal Reserve Board's Survey of Household Economics and Decisionmaking, the U.S. Census Bureau's American Community Survey, the U.S. Census Bureau's Survey of Income and Program Participation accessed from the National Bureau of Economic Research, http://www.nber.org/data/survey-of-income-and-program-participation-sipp-data.html, and the U.S. Census Bureau's March Current Population Survey accessed from the National Bureau of Economic Research, http://www.nber.org/cps
Employment Status
As is the case in the Census-based surveys, the SHED asks its respondents about their current employment status. In the SHED, the options include: employed now, temporarily laid off, not employed (looking), and a range of categories that encompass those not in the labor force (unemployed but not looking for work, student, homemaker, retired, and disabled). These responses can be aggregated into definitions that are consistent with those in the ACS and CPS data to compare results based on similar employment concepts.
Table 2 provides employment statistics for the three datasets. In the 2014 SHED, the employment-population ratio was 59.9 percent, which very closely matches the results from the 2013 ACS (59.7 percent) and is within 1 percentage point of the 60.5 percent employment-population ratio from the 2014 March CPS. Both of these are within the 95 percent confidence interval of the findings from the SHED survey.
| Table 2: Employment Statuses in the SHED, ACS, and CPS |
|---|
| SHED (2014) |
CPS (March 2014) |
ACS (2013) |
|
|---|---|---|---|
| Employed or on temporary layoff | 59.9 | 60.6 | 59.7 |
| (0.8) | (0.2) | (0.03) | |
| Not employed and looking for a job | 5.3 | 3.9 | 5.3 |
| (0.4) | (0.1) | (0.01) | |
| Not in labor force (combined) | 34.7 | 35.6 | 35 |
| (0.8) | (0.2) | (0.03) | |
| Student, homemaker, or not looking for work | 10.8 | 12.2 | -- |
| (0.6) | (0.1) | ||
| Disabled | 6.6 | 5.9 | -- |
| (0.4) | (0.1) | ||
| Retired | 17.3 | 17.5 | -- |
| (0.6) | (0.2) |
Note: Standard errors in parentheses
Source: Author's calculations using the Federal Reserve Board's Survey of Household Economics and Decisionmaking, the U.S. Census Bureau's American Community Survey, and the U.S. Census Bureau's March Current Population Survey accessed from the National Bureau of Economic Research, http://www.nber.org/cps
Banking
In addition to the monthly questionnaire and annual social and economic supplement, the CPS includes a range of supplemental questionnaires for respondents. In June 2013, the CPS included a supplement that asked respondents about whether they have a checking, savings, or money market account as well as their use of alternative financial services. While not identical to the questions on these topics in the SHED, the questions in this supplement can be used to assess the banking responses in the SHED data.5 We observe that the frequency of bank accounts in the two surveys are not statistically different, with the SHED finding that 7.6 percent of adults lack access to a bank account while the CPS observes that 6.9 percent do not have access to a bank account. Additionally, the frequency of lacking a bank account by age group is consistent across the surveys, generally declining as individual's age from approximately 10 percent among 18-24 year olds to approximately 3.1 percent among those over age 65. Any difference in account ownership between the surveys may be attributable to the SHED asking about bank accounts for the respondent and their spouse whereas the CPS asks about bank accounts for anyone in the household.
| Figure 1: Presence of Checking, Savings, and Money Market Accounts in the SHED and CPS surveys |
|---|
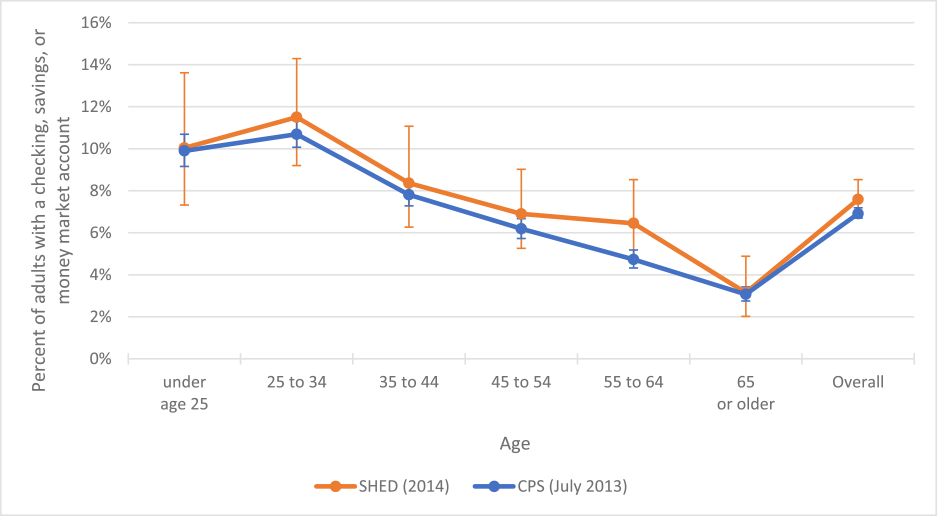 |
Note: Solid vertical line represents the 95 percent confidence interval on responses.
Source: Author's calculations using the Federal Reserve Boards Survey of Household Economics and Decisionmaking and the U.S. Census Bureau's July Current Population Survey accessed from the National Bureau of Economic Research, http://www.nber.org/cps
Health Insurance Status
The SHED also asks about health insurance status in a similar fashion to the American Community Survey. In both surveys, respondents report whether they are currently covered by any of a list of health insurance plans, which includes both private health insurance plans as well as government provided plans such as Medicare and Medicaid.
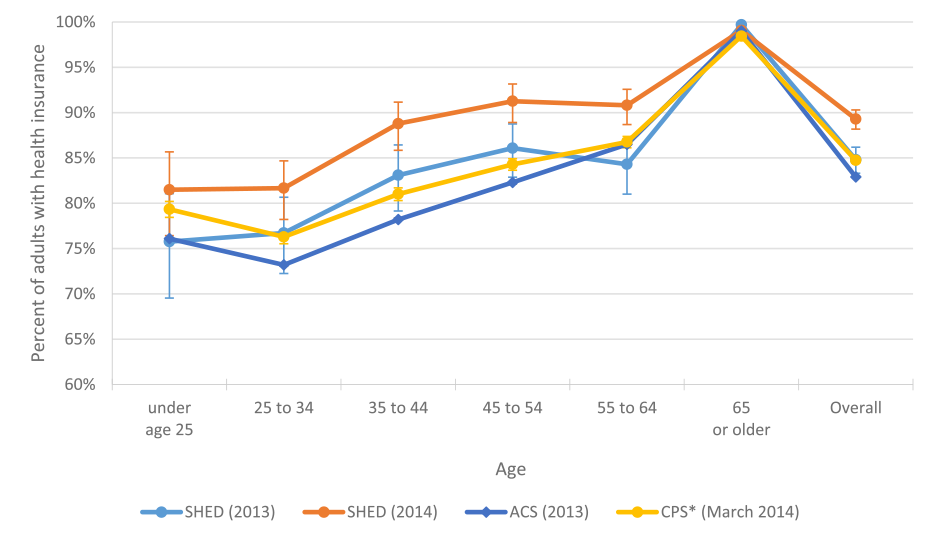
Figure 2 illustrates the insurance rates, by age, across the surveys. Given the substantial impact that the implementation of provisions in the Affordable Care Act had on insurance rates between 2013 and 2014, we focus our comparison here on the 2013 SHED data. When doing so, we observe that coverage rates in the 2013 SHED and the 2013 ACS are similar. The SHED has a population-wide insured rate that is approximately 1.9 percentage points higher than that in the ACS (84.8 percent versus 83.2 percent) and is in line with that from the 2014 March CPS, which asked respondents if they were covered by a range of insurance types in the past year.
| Figure 2: Health insurance coverage in the SHED, ACS, and CPS surveys |
|---|
 |
Note: Solid vertical line represents the 95 percent confidence interval on responses.
*CPS responses are for whether the individual has had health insurance in the past year.
Source: Author's calculations using the Federal Reserve Board's Survey of Household Economics and Decisionmaking, the U.S. Census Bureau's American Community Survey, and the U.S. Census Bureau's March Current Population Survey accessed from the National Bureau of Economic Research, http://www.nber.org/cps
Although the estimates for several age bands are outside of the 95 percent confidence interval for being the same across the datasets, the general age pattern of insurance is largely similar. In each dataset, health insurance coverage is lowest among respondents in their 20s and early 30s, before climbing as respondents approach middle age. Among respondents over age 65, approximately 99 percent in each survey report having health insurance, reflecting the near universality of Medicare coverage.
In 2014, the SHED insurance rates are substantially higher than those seen in 2013, with 89.3 percent of SHED respondents reporting some form of health insurance. However, this increase coincides with implementation of provisions of the Affordable Care Act, which have been found elsewhere to have substantially increased coverage.6 As such, this increase was expected given the broader trends in health insurance coverage in recent years.
Housing
The SHED and ACS also have several overlapping questions on housing and homeownership. These questions ask respondents whether the home is owned or rented by someone in their house and how much they pay in rent or mortgage each month.7 Patterns in homeownership rates by age are generally similar across the two surveys, although the SHED observes homeownership rates that are about 5 percentage points higher than the ACS on average (Figure 3).
| Figure 3: Homeownership Rates in the SHED and ACS surveys |
|---|
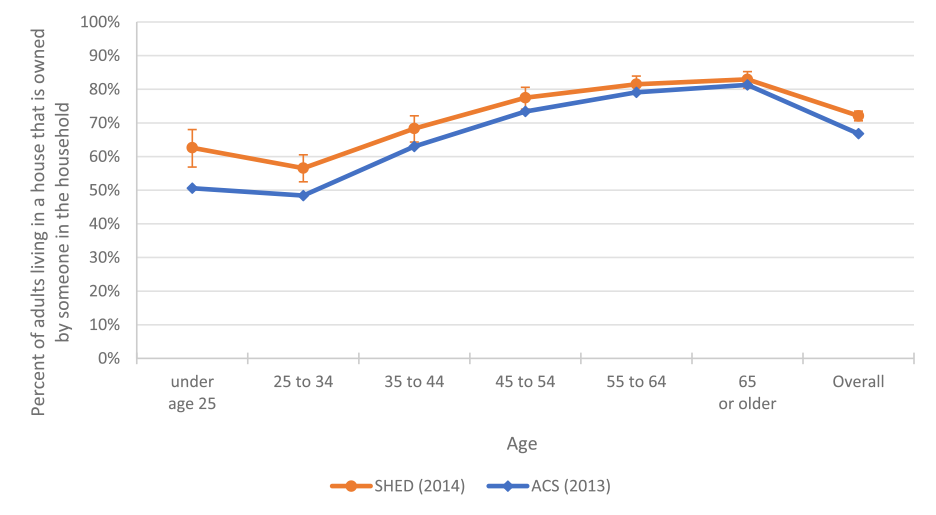 |
Note: Solid vertical line represents the 95 percent confidence interval on responses.
Source: Author's calculations using the Federal Reserve Board's Survey of Household Economics and Decisionmaking and the U.S. Census Bureau's American Community Survey
For respondents who say that either they or their spouse own or rent their home, the SHED asks a follow-up question of how much they pay in mortgage or rent. Considering the monthly expense from rent or a mortgage, the ACS finds higher levels of monthly costs among renters but a lower level among owners. For renters, the ACS finds an average rent payment of $1,020 per month, compared to $808 in the SHED. However, the SHED average rent results are in-line with those from the 2013 Survey of Consumer Finances (SCF), which observed a mean monthly rent of $829. This alleviates concerns that the SHED may be understating monthly rents. For homeowners, the SHED observes a mean mortgage payment of $1,344, compared to $1,214 for the ACS and $1,230 for the SCF. However, the higher SHED result is partially driven by four outliers, who reported that their monthly mortgage payment exceeded $18,000. Excluding these four observations the average mortgage in the SHED is $1,216 which is consistent with both the SCF and ACS.
Retirement Savings
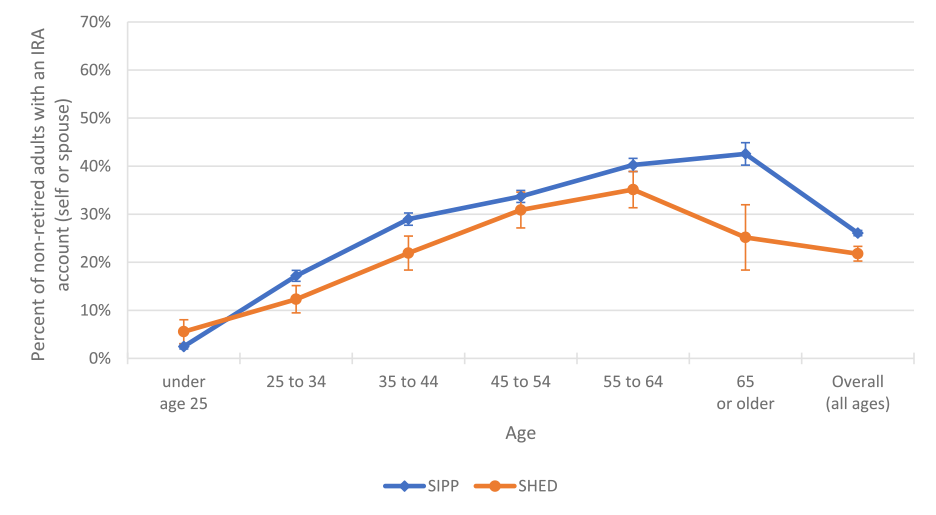
Thus far, comparisons have largely focused on the SHED results relative to data from the ACS and CPS. However, the SHED also contains comparable questions to the SIPP survey. In particular, the SIPP asks respondents whether they have several types of retirement savings accounts including a 401(k) or an IRA. Figures 4 and 5 compare the frequency of these accounts by age in the SIPP to those in 2014 SHED. Looking first at 401(k) accounts, the 2014 SHED survey observes that 46.5 percent of non-retired adults have a 401(k) retirement account (Figure 4). This compares to 42.6 percent of non-retirees with a 401(k) in the SIPP data. IRA accounts are less frequent in both datasets. The SHED found that 21.8 percent of non-retirees hold an IRA, which compares to 25 percent of non-retirees in the SIPP who indicated that they have an IRA (Figure 5).
| Figure 4: Frequency of 401(k), 403(b), and Thrift Retirement Savings in the SHED and SIPP surveys |
|---|
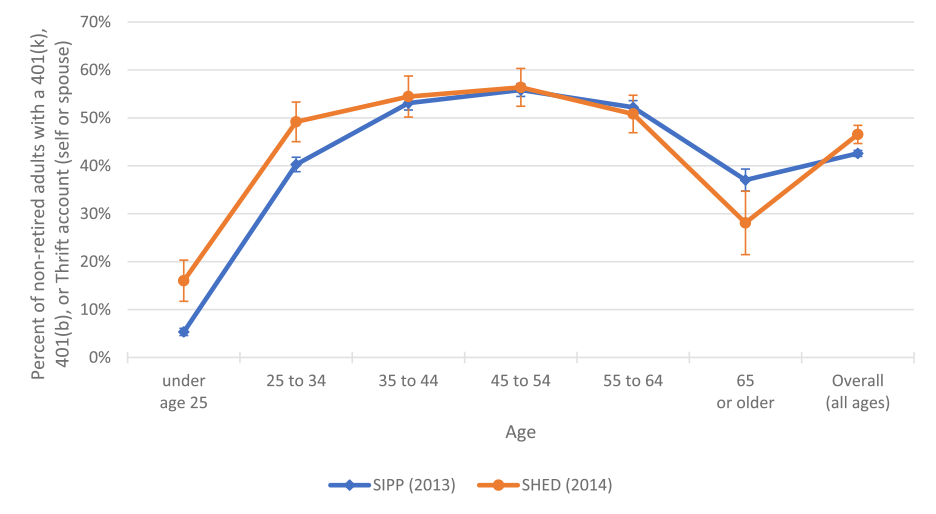 |
Note: Solid vertical line represents the 95 percent confidence interval on responses.
Source: Author's calculations using the Federal Reserve Board's Survey of Household Economics and Decisionmaking and the U.S. Census Bureau's Survey of Income and Program Participation accessed from the National Bureau of Economic Research, http://www.nber.org/data/survey-of-income-and-program-participation-sipp-data.html
When retirement account holdings are disaggregated by age groups, differences emerge in the estimates across surveys. The divergence among respondents over age 65 may reflect differences in the definition of retirees, with the SHED defining a retiree as an individual whose primary employment is retired whereas in the SIPP it is based on whether the respondent has ever retired from a job. However, while there are differences in the presence of these accounts by age across the two datasets, the broad age patterns are similar with older cohorts being most likely to have an IRA account and individuals in their late 30s through early 50s holding 401(k) savings at the highest rate.
Income volatility
A final aspect of individual finances that we compare to Census data is income volatility. The 2013 SHED asked respondents how much their income varied from month to month in the past year. It observed that about one-third of respondents experienced some level of volatility, and greater levels of volatility among lower income respondents.
While the SIPP does not ask individuals to assess the level of income volatility, it does ask respondents to provide their income on a monthly basis. As such, volatility can be compared to the SIPP by observing the number of months for which an individual's monthly income is outside of a 20 percent band of their mean income.8 We consider individuals to have income that is "roughly the same amount each month" if there are no months that fall outside of the 20 percent income band. We then say that their income "has some unusually high or low months" if between 1 and 5 months fall outside of the income band and that it "often varies quite a bit" if 6 months or more are outside of the income band.
When doing so, we observe that if anything the SHED understates the level of income volatility that exists from month-to-month. In the SIPP data, just 54 percent of adults have monthly income that never varies by more than 20 percent.9 In order to lower the volatility to that seen in the SHED, the bands around mean income in the SIPP would need to be approximately 35 percent. This suggests that a number of SHED respondents may be experiencing substantial income volatility but are either unaware of that volatility or perceive it as normal so do not report it as an unusual level of variability. Nevertheless, we do observe that the pattern of volatility across income levels is extremely similar in the two datasets, and when using the 35 percent income bands the volatility measures closely match those in the SHED both at the aggregate level and for each income level.
| Table 3: Income Stability in the SHED and SIPP surveys |
|---|
| SIPP (20% band) | SIPP (35% band) | SHED 2013 | |||||||
|---|---|---|---|---|---|---|---|---|---|
| Roughly the same | Some high/ low months |
Often varies | Roughly the same | Some high/ low months |
Often varies | Roughly the same | Some high/ low months |
Often varies | |
| Under $25,000 | 49.2 | 16.2 | 34.6 | 56.2 | 19 | 24.9 | 63.7 | 17.4 | 18.9 |
| (0.7) | (0.5) | (0.7) | (0.7) | (0.5) | (0.7) | (2.2) | (1.7) | (1.9) | |
| $25K-$50K | 52 | 24.3 | 23.7 | 64.6 | 24.3 | 11.1 | 64.7 | 23.2 | 12.1 |
| (0.6) | (0.5) | (0.5) | (0.6) | (0.5) | (0.4) | (1.9) | (1.7) | (1.3) | |
| 50K-$75K | 53.5 | 27.2 | 19.3 | 69.6 | 23.2 | 7.2 | 69.6 | 23.5 | 6.9 |
| (0.6) | (0.6) | (0.6) | (0.6) | (0.6) | (0.4) | (2.2) | (2) | (1.1) | |
| $75K-$100K | 58.5 | 25 | 16.5 | 73.3 | 20.1 | 6.6 | 70.9 | 22.3 | 6.8 |
| (0.8) | (0.7) | (0.6) | (0.7) | (0.7) | (0.4) | (2.4) | (2.2) | (1.3) | |
| Over $100K | 57.5 | 27.2 | 15.3 | 72 | 21.3 | 6.7 | 73.6 | 20.5 | 6 |
| (0.6) | (0.5) | (0.5) | (0.6) | (0.5) | (0.3) | (1.7) | (1.5) | (1) | |
| Overall | 54 | 24.2 | 21.9 | 67 | 21.9 | 11.2 | 68.7 | 21.3 | 10 |
| (0.3) | (0.3) | (0.3) | (0.3) | (0.3) | (0.2) | (0.9) | (0.8) | (0.6) | |
Notes: SHED results exclude respondents who did not answer the income stability question. Standard errors in parentheses
Source: Author's calculations using the Federal Reserve Board's Survey of Household Economics and Decisionmaking and the U.S. Census Bureau's Survey of Income and Program Participation accessed from the National Bureau of Economic Research, http://www.nber.org/data/survey-of-income-and-program-participation-sipp-data.html
Conclusions
In general, the aggregate responses to the SHED benchmark well against Census data sources. For most of the overlapping questions the overall estimates are extremely close to those in the Census datasets considered. When looking at the responses by age, for each of the questions the overall pattern of responses across the age cohorts are also similar across the datasets, but with less consistency across datasets for the individual age groups than is seen for overall responses.
Overall, this comparison of the SHED data to Census data provides support for the reliability of the estimates generated from the SHED, and suggests that this online mode of data collection can provide accurate and timely insights at significantly reduced cost. However, high quality in-person data collections remain essential for providing regular benchmarks for online survey estimates, as well as for collecting complex information such as specific income data from each income source, that do not lend themselves well to collection via online surveys.
References
Board of Governors of the Federal Reserve System. 2014. Report on the Economic Well-Being of U.S. Households in 2013 (PDF).
Board of Governors of the Federal Reserve System. 2015. Report on the Economic Well-Being of U.S. Households in 2014 (PDF).
1. Additional information about the SHED, including a public version of the survey microdata, is available at: http://www.federalreserve.gov/communitydev/shed.htm Return to text
2. For additional details on the technical details of the SHED survey, see Appendix 1 of The Report on the Economic Well-Being of U.S. Households in 2014 (PDF). Return to text
3. CPS data was accessed from http://www.nber.org/cps/ and SIPP data was accessed from http://www.nber.org/data/survey-of-income-and-program-participation-sipp-data.html Return to text
4.The SHED uses a post-stratification weighting process to match Current Population Survey (CPS) estimates for gender, age, race/ethnicity, education, Census region, residence in a metropolitan area, and access to the Internet. Return to text
5. The unbanked and underbanked supplement to the CPS is sponsored by the FDIC. This supplement has a slightly different coverage of banking than the SHED, with the SHED asking respondents if they or their spouse have a bank account, whereas the CPS supplement asks respondents if they or anyone in their household has a bank account. Return to text
6. A quarterly survey by Gallup-Healthways, for example, observed the fraction lacking insurance falling to 12.9 percent in the 4th quarter of 2014 from 18 percent in the 4th quarter of 2013. Return to text
7. The SHED also asks respondents whether they or their spouse own the home, with 61.4 percent saying that they do. This definitional difference most impacts respondents in the 18-24 age group. Return to text
8. In order to avoid having a single outlier month dramatically alter the mean, we actually compare monthly incomes to a censored mean, dropping the highest and lowest months of income. Return to text
9. Some respondents who are paid on a bi-weekly basis may have two months that are more that are more than 20 percent above average due to the timing of paychecks but consider their income to be regular without much fluctuation. However, when adjusting the definition of non-volatile income to allow for two months are at least 20 percent above average we still observe that just 60 percent of SIPP respondents have income that does not vary from month to month. Return to text
Please cite as:
Larrimore, Jeff, Maximilian Schmeiser, and Sebastian Devlin-Foltz (2015). "Should You Trust Things You Hear Online? Comparing SHED and Census Bureau Survey Results," FEDS Notes. Washington: Board of Governors of the Federal Reserve System, October 15, 2015. https://doi.org/10.17016/2380-7172.1619
Disclaimer: FEDS Notes are articles in which Board economists offer their own views and present analysis on a range of topics in economics and finance. These articles are shorter and less technically oriented than FEDS Working Papers.
