
FEDS Notes
 Print
PrintDecember 3, 2015
Credit-to-GDP Trends and Gaps by Lender- and Credit-type
William Bassett, Ainsley Daigle, Rochelle Edge, and Gazi Kara
The one-sided credit-to-GDP gap -- measured as the difference between the level of private nonfinancial sector credit-to-GDP and its one-sided Hodrick-Prescott (HP) filtered trend (with λ=400,000) -- is a prominent variable in the decision-making framework proposed by the BCBS for the Basel III countercyclical capital buffer (CCyB). In particular, the BCBS (2010, page 3) "Guidance for national authorities operating the countercyclical capital buffer" emphasizes the credit-to-GDP gap as a common reference point that authorities should take into account in formulating and explaining their CCyB decisions. In addition, the BCBS CCyB Guidance (page 3) states the need for national authorities to disclose their jurisdiction's credit-to-GDP gap on a regular basis. The credit-to-GDP gap is also prominent in the CCyB frameworks of jurisdictions that are implementing Basel III. For example, the European Union's Capital Requirements Directive (CRD) IV, which implements Basel III in the European Union, requires each E.U. country to calculate and publish the gap each quarter, along with the associated CCyB that the gap would imply, using the framework of the Basel III agreement. The final joint interagency rule implementing Basel III in the United States includes the credit-to-GDP ratio among many variables that might be used to inform CCyB decisions. Although the rule does not mention the gap.
In all contexts (that we are aware of) in which credit-to-GDP gap is discussed as a measure to inform the setting of the Basel III CCyB, it is the gap for aggregate private nonfinancial sector credit-to-GDP that is mentioned.1 Indeed, the BCBS CCyB Guidance (to which we refer the reader for the calculation of the gap, page 13) emphasizes including all private nonfinancial credit independent of the type of credit and of the type of lender that supplies the credit. Focusing on the aggregate credit-to-GDP ratio may obscure underlying developments in the evolution of credit that may aid our understanding of the gap. We investigate this issue by disaggregating the numerator of the credit-to-GDP ratio by type of lender and by type of credit and then decomposing these disaggregated ratios into their trend and gap components.
1. The credit-to-GDP ratio disaggregated by type of lender and type of credit
Panels A and B of Figure 1 show the two dimensions along which we disaggregate the private nonfinancial credit-to-GDP ratio. The first dimension is by the type of institution that is supplying credit; that is, by (1) banks; (2) insurance companies, pension-funds, and long-term mutual funds (IC.PF.MF); (3) government sponsored enterprises (GSEs); (4) other nonbanks (largely accounted for by finance companies, private label ABS issuers, and mortgage REITS); and (5) the nonfinancial sector (which is primarily Federal Government student loans). The second dimension is by type of credit; that is, by (1) home mortgages, (2) commercial mortgages (including multifamily residential and farm mortgages), (3) consumer credit, (4) nonfinancial business credit, and (5) nonfinancial corporate bonds and commercial paper.2
Before presenting the trend and gap results we remind the reader that the HP filtered trends that we calculate for the disaggregated credit-to-GDP ratios will sum exactly to the trend that would be calculated from the aggregate series. Likewise, the gaps that we calculate for our disaggregated credit-to-GDP ratios -- provided we express them as the simple difference of the level from their trend -- will also sum exactly to the gaps that would be calculated from the aggregate series.3 (See, Baxter and King, 1999, section 5.2 for a description of the weighted moving average properties of the one- and two-sided HP filter that allow these aggregations.)
| Figure 1: Private Nonfinancial Credit-to-GDP Ratio |
|---|
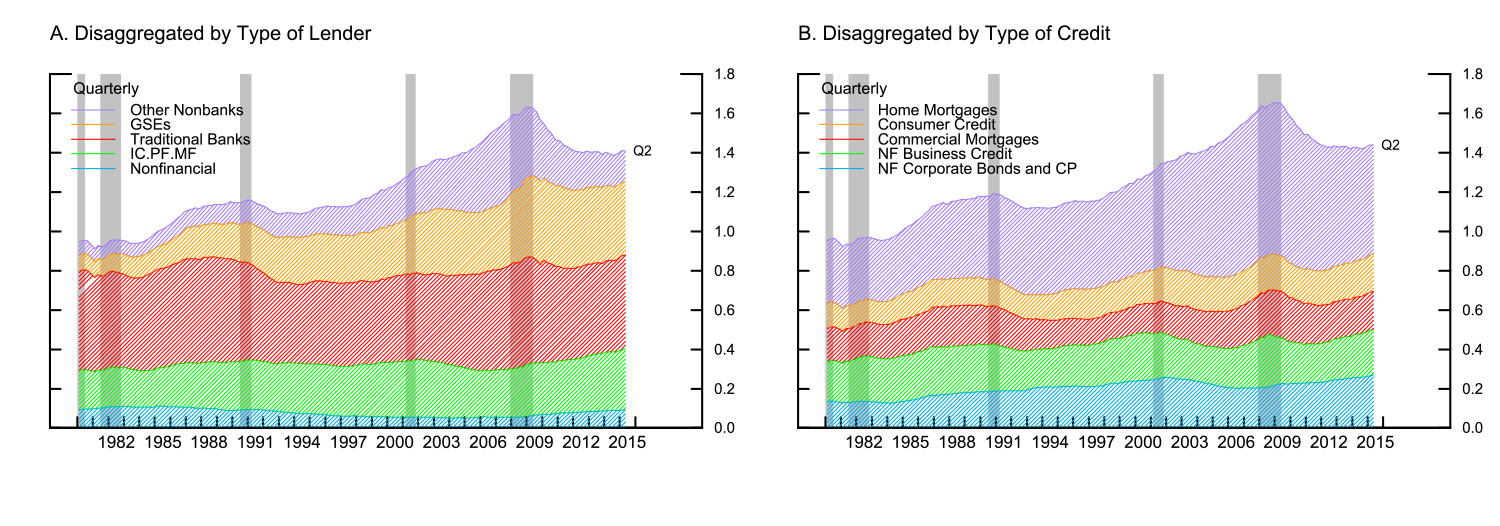 |
Note: IF.PF.MF denotes insurance companies, pension funds, and long-term mutual funds. Other Nonbanks consists of finance companies, private label ABS issuers, mortgage REITS, funding
corporations and broker-dealers.
Source: Federal Reserve Board, Financial Accounts of the United States (FAUS) (formerly known as Flow of Funds Accounts, or FoFA), http://www.federalreserve.gov/releases/z1/current/data.htm; and U.S. Department of Commerce, Bureau of Economic Analysis (BEA), National Income and Product Accounts (NIPA), http://www.bea.gov/national/nipaweb/DownSS2.asp
2. The credit-to-GDP trend disaggregated by type of lender and type of credit
As can be seen from Panel A of Figure 2, two types of institutions -- specifically, GSEs and other nonbanks -- account for essentially all of the increase in the one-sided trend of the credit-to-GDP ratio. When the one-sided gap is used to guide the setting of the CCyB, all of the series' trend is extracted and removed from policy consideration. The BCBS CCyB Guidance (see page 13) argues that this is appropriate, since the trend credit-to-GDP ratio can be interpreted as approximating the sustainable level of credit to which the CCyB should not respond.
The central role played by the GSEs and other nonbanks in the lead-up to the financial crisis suggests that for the U.S. economy it may not always be appropriate to view the HP-filtered trend component of the credit-to-GDP ratio as being sustainable. The sizable growth in GSE portfolios in the lead-up to the crisis was underpinned by a significant and unsustainable increase in leverage at these institutions. (See Acharya et al, 2011, section 1.4 for further description.) Likewise, the rapid increase in the other nonbank sector's holding of credit was underpinned by the growth of a highly vulnerable system of liabilities funding. (See Bernanke, 2010a, for further description.) Because the increase in GSE and other nonbank credit persisted for a reasonably long period they are reflected in the trend and are consequently excluded from the gap and policy considerations.
| Figure 2: Private Nonfinancial Credit-to-GDP One-Sided Trend |
|---|
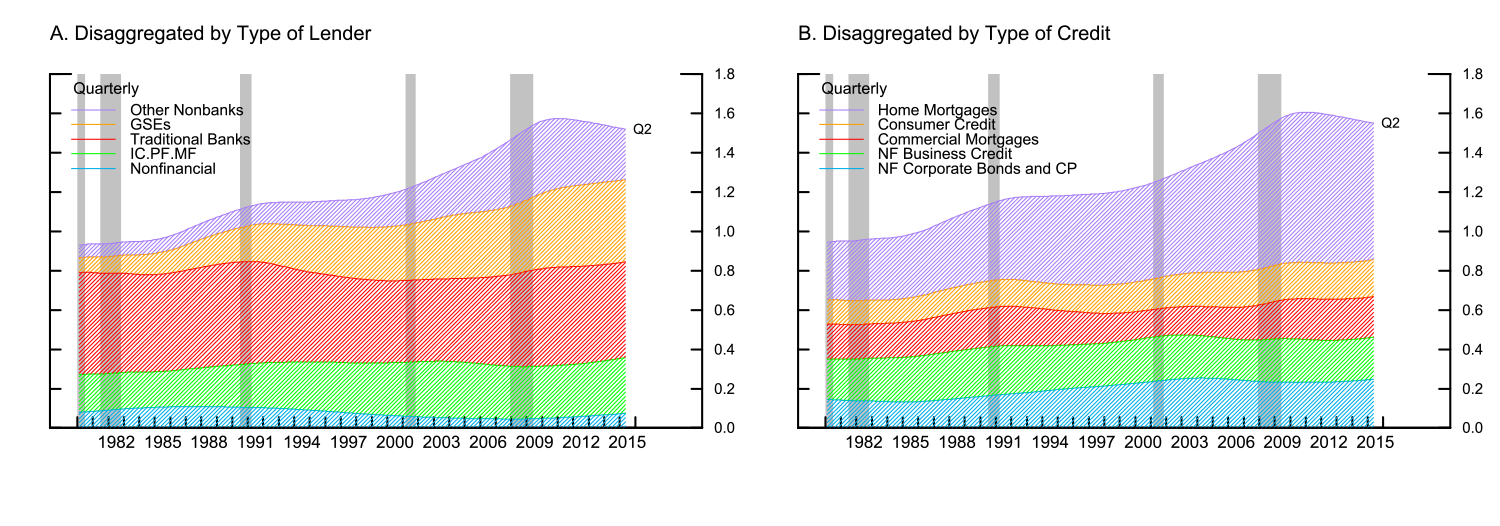 |
Note: IF.PF.MF denotes insurance companies, pension funds, and long-term mutual funds. Other Nonbanks consists of finance companies, private label ABS issuers, mortgage REITS, funding
corporations and broker-dealers. Calculated using an HP filter with lambda=400,000.
Source: FAUS, NIPA, and staff calculations.
As can be seen from Panel B of Figure 2, one type of credit -- specifically, home mortgages -- accounts for essentially all of the increase in the one-sided trend in the credit-to-GDP ratio, which, as noted above, is interpreted as approximating the sustainable level of credit and is, therefore, extracted when the gap is constructed. The housing-price bubble and substantial deterioration in underwriting standards associated with this increase in credit again suggests that for the U.S. economy it is not always appropriate to interpret the trend component as being sustainable (see Bernanke, 2010b, and Dokko et al., 2009, for further discussion).
We would also note that developments in the credit-to-GDP ratio are included by the HP-filter trend (and excluded from the gap) quite quickly. This is due to the fact (noted also in the BCBS CCyB Guidance, page 13) that the HP filter gives higher weights to more recent observations. The Guidance views this feature to be an advantage of using the HP filter, since it allows the filter "to deal more effectively with structural breaks." This view takes a very favorable and uncritical interpretation of any persistent increase in the credit-to-GDP ratio. Moreover, it arrives at this interpretation well before the full consequences of the increase in credit have been seen. This interpretation might be appropriate for economies that are still experiencing financial deepening, though even here it could arguably still be premature. But it is less appropriate for economies like the United States where there is already considerable depth to the financial system and where a reasonably persistent increases in the credit-to-GDP ratio may just as equally reflect building vulnerabilities underpinned by rising leverage, increasing maturity transformation, surging asset prices, or declining credit underwriting standards.
3. The credit-to-GDP gap disaggregated by type of lender and type of credit
Panels A and C of Figure 3 show the one-sided estimates of the credit-to-GDP gaps that correspond to the one-sided trends in Panels A and B of Figure 2. As can be seen from these panels there is variability across the components of the gap when broken down by type of lender and by type of credit. Panel B and D of Figure 3 show the two-sided counterparts to the one-sided gap estimates shown in Panel A and B of Figures 3. Two-sided gap estimates give more accurate decompositions of the trend and cyclical components of the credit-to-GDP ratio relative to their one-sided counterparts.4 Because two-sided gap estimates require data after the reference period, they are estimated only out to 2012:Q1 (albeit using data to the end of 2015:Q1).
Although the two-sided gap estimates shown in Panels B and D of Figure 3 are not timely enough to be used for policy decisions, they show interesting differences in the cyclical properties of credit supplied by different types of lenders and different types of credit. Across the different types of institutions, credit supplied by the IC.PF.MF sector moves counter to the overall credit cycle; credit supplied by banks, GSEs, and other nonbanks move with the overall credit cycle; and credit supplied by the nonfinancial sector (excluded from the chart) is broadly acyclical. Across different types of credit, bond-market credit moves counter to the overall credit cycle; consumer credit (excluded from the chart) is broadly acyclical; and all other forms of intermediated credit move with the overall credit cycle. Of course, some of these credit-cycle features are only evident over the last credit cycle and it is somewhat premature to view them as truly stylized credit facts.
| Figure 3: Private Nonfinancial Credit-to-GDP |
|---|
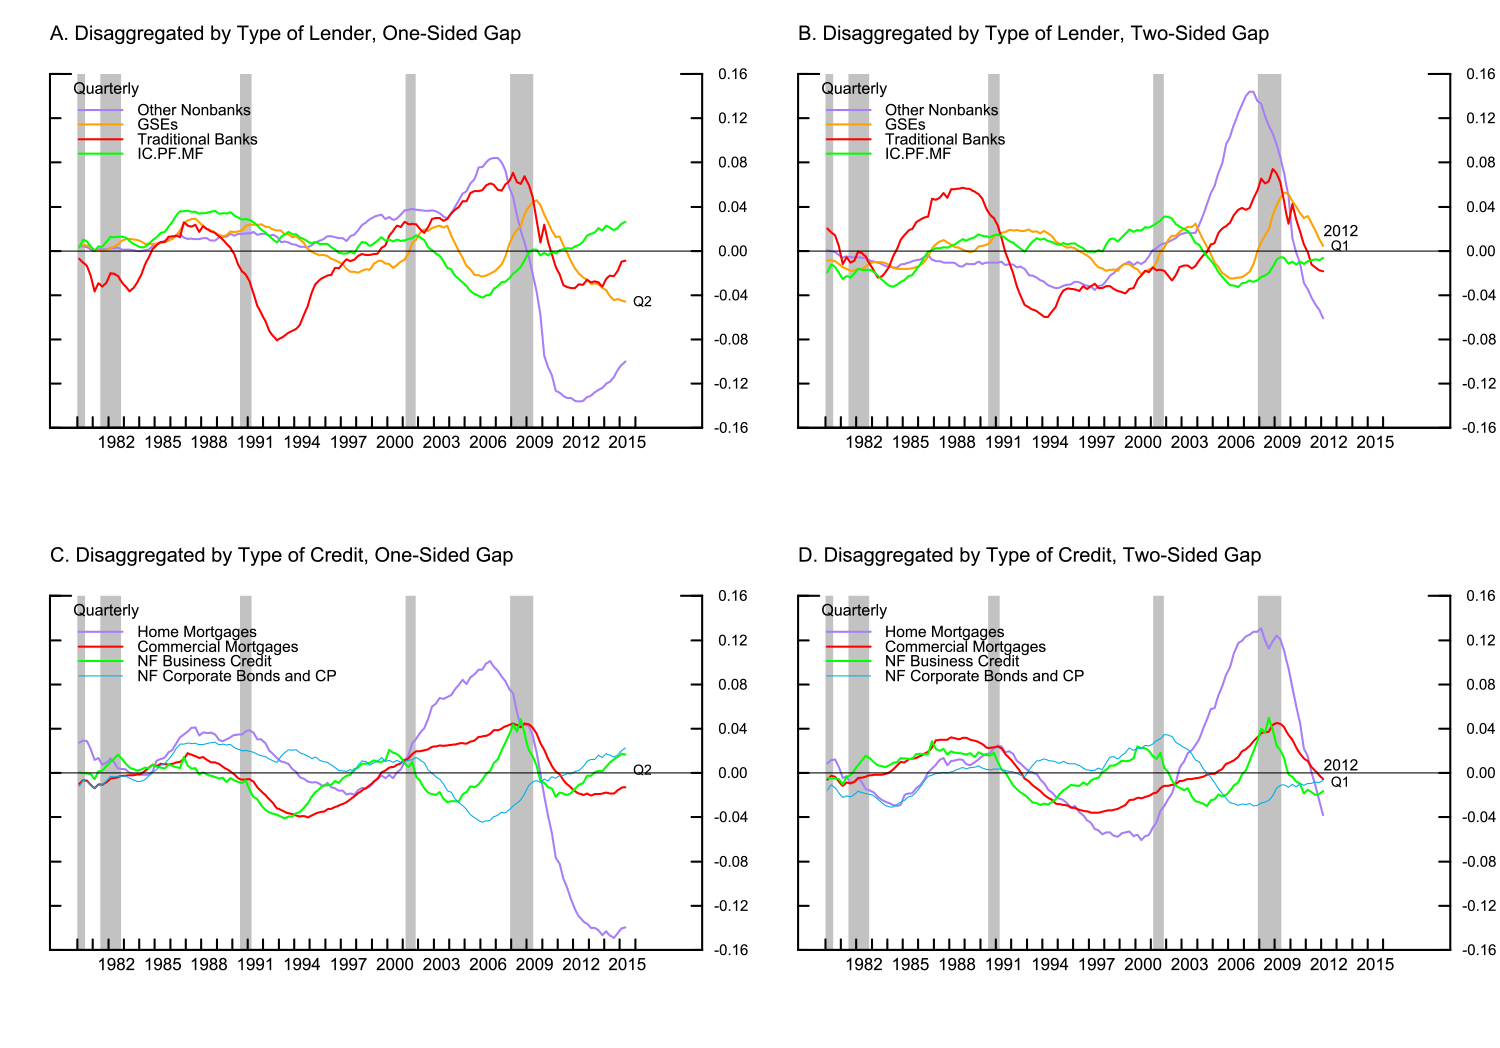 |
Note: IF.PF.MF denotes insurance companies, pension funds, and long-term mutual funds. Other Nonbanks consists of finance companies, private label ABS issuers, mortgage REITS, funding
corporations and broker-dealers. Calculated using an HP filter with lambda=400,000.
Source: FAUS, NIPA, and staff calculations.
The two-sided gap estimates by lender provide information on which institutions are contributing to the aggregate gap. As is evident from Panel B of Figure 3 in the lead-up to the crisis U.S. banks contributed to only a moderate portion of the aggregate gap. If the CCyB applies only to banks, these results raise doubts about the ability of the CCyB "to lean against the wind" with any effectiveness. However, one motivation for activating the CCyB -- indeed, the main motivation for most jurisdictions -- is to build resilience in the financial system to heightening vulnerabilities and even though banks are not contributing to building vulnerabilities they could be exposed to them. That said, gap estimates do not provide any information on whether banks are exposed to building vulnerabilities.
A comparison of Panels A and C and of Panels B and D of Figure 3 shows a number of differences between the one- and two-sided gap estimates. For example, the one-sided gap in Panel A gives no indication of any disproportionate build-up of credit provision by the other nonbank sector in the lead-up to the crisis, though the two-sided gap in Panel B shows this build-up clearly. Likewise, in Panel C the one-sided gap shows a much smaller cyclical build-up in home-mortgages in the lead-up to the crisis than the two-sided gap in Panel D. Such problems are also evident in the late 1980s during the lead-up to the U.S. savings and loans (S&L) crisis, which was associated with a sizable run-up and drop in commercial real estate prices and a boom in commercial mortgage lending by banks. (See FDIC, 1997 for a discussion of the S&L crisis.) In this episode, the one-sided gaps in Panels A and C give no indication of large build-ups of bank credit and commercial mortgages, though these developments are clearly shown by the two-sided gaps in Panels B and D. These comparisons highlight a concern with using one-sided trend and gap estimates to inform policy, which is that these estimates can change substantially after subsequent data becomes available and in real-time miss salient developments. (See Edge and Meisenzahl, 2010, for a discussion of this issue for the aggregate credit-to-GDP ratio and Orphanides and Van Norden, 2002, for the initial discussion of this issue in the context of real GDP.)
4. Discussion
The revisions between the one- and two-sided gap estimates evident between Panels A and B and Panels C and D of Figure 3 also highlight the problems associated with determining the sustainable and unsustainable components of a series by applying a statistical filter to its actual path. The reason why the two-sided gaps for other nonbank credit and home mortgages in the lead-up to the crisis are notably higher than their one-sided counterparts -- and more in line with generally-accepted views on this episode -- is that these components of credit plummeted in the crisis so revising down estimates of their past trends and revising up estimates of their past gaps. As such, one may also question the rigor with which the two-sided estimates gauge (even ex-post) the sustainable and unsustainable components of credit. To be sure, two-sided estimates use more information and, in particular, information about the full consequences of the increase in credit. However, two-sided estimates also give an overly favorable interpretation of the sustainable part of the increase in the credit-to-GDP ratio prior to the crisis. As shown by Panels A and B of Figure 4 two-sided trends also view a large portion of the increase in GSE and other nonbank sector credit and the increase in home mortgage credit in the lead-up to the crisis as sustainable, despite the roles that rising leverage, increasing maturity transformation, surging asset prices, or declining credit underwriting standards had on these developments.
Our results suggest that any assessment of sustainable credit activity made to inform time-varying macroprudential policy decisions should also consider financial-system vulnerabilities related to leverage, maturity transformation, asset-prices, and/or underwriting standards. Such an approach could be a model-based approach, which could then deliver a more structurally-founded credit-to-GDP ratio gap estimate, or it could involve adjustments to a statistically-generated trend of the credit-to-GDP ratio based on observed levels of these vulnerabilities. Of course, an assessment of sustainable credit activity need not be based around a summary credit gap measure only. An assessment could be made by monitoring a large number of quantitative indicators for both credit and other financial-system vulnerabilities and aggregating them into a single measure quantitatively (such as, in Aikman et al., 2015). Or an assessment could be made by considering quantitative indicators but then forming an overall evaluation of credit sustainability in a more qualitative way (such as, in Adrian et al., 2013).5 What seems most crucial is the consideration of additional vulnerabilities, since, as the episode preceding the crisis suggests, a persistent increase in the U.S. credit-to-GDP ratio should not automatically be assumed to be a favorable, or even benign, financial deepening.
| Figure 4: Private Nonfinancial Credit-to-GDP Two-Sided Trend |
|---|
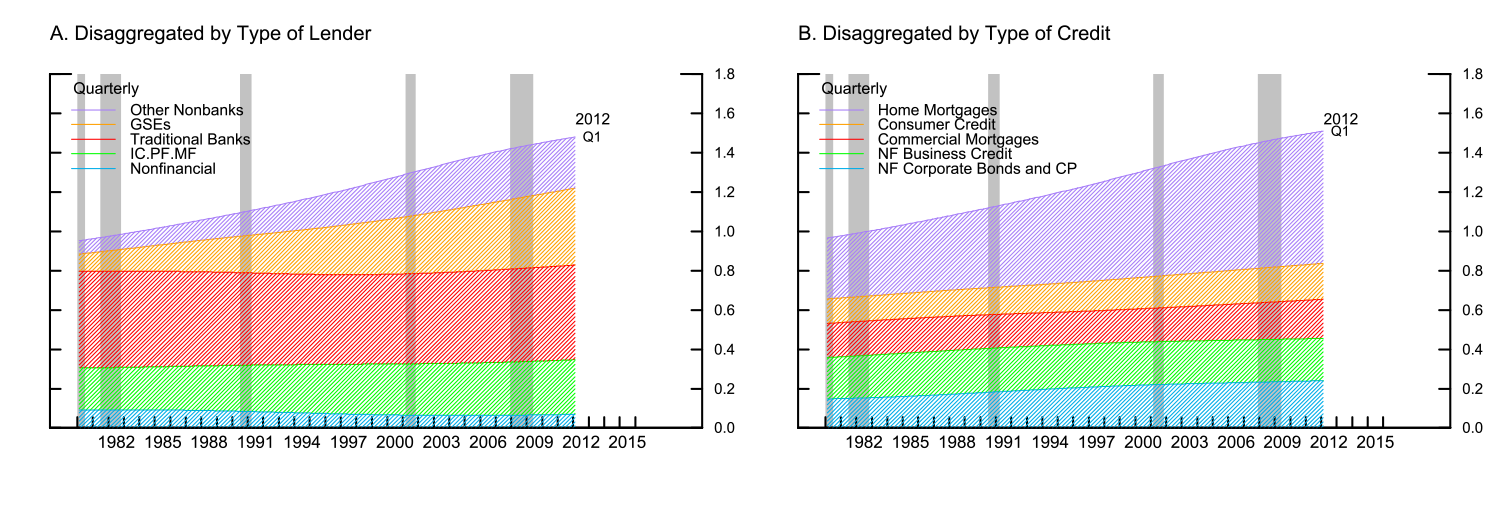 |
Note: IF.PF.MF denotes insurance companies, pension funds, and long-term mutual funds. Other Nonbanks consists of finance companies, private label ABS issuers, mortgage REITS, funding
corporations and broker-dealers. Calculated using an HP filter with lambda=400,000.
Source: FAUS, NIPA, and staff calculations.
5. References
Acharya, Viral V. Matthew Richardson, Stijn van Nieuwerburgh, and Lawrence J. White, (2011). "Guaranteed to Fail: Fannie Mae, Freddie Mac, and the Debacle of Mortgage Finance," Princeton University Press.
Adrian, Tobias, Daniel Covitz, and Nellie Liang (2013). "Financial Stability Monitoring," FEDS Working Paper No. 2013-21.
Aikman, David, Michael Kiley, Seung Jung Lee, Michael Palumbo, and Missaka Warusawithrana (2015). "Mapping Heat in the U.S. Financial System: A Summary," FEDS Working Paper No. 2015-59.
Baxter, Marianne and Robert King, (1999). "Measuring Business Cycles: Approximate Band-Pass Filters For Economic Time Series", The Review of Economics and Statistics, Vol. 81, No. 4, pp. 575-593.
Basel Committee on Banking Supervision (2010). "Guidance for National Authorities Operating the Countercyclical Capital Buffer", December.
Bernanke, Ben S. (2010a). "Causes of the Recent Financial and Economic Crisis," Statement before the Financial Crisis Inquiry Commission, Washington, September 2.
Bernanke, Ben S. (2010b). "Monetary Policy and the Housing Bubble", Speech at the Annual Meeting of the American Economic Association, Atlanta, January 3.
Detken, Carsten, Olaf Weeken, Lucia Alessi, Diana Bonfim, Miguel M. Boucinha, Christian Castro, Sebastian Frontczak, Gaston Giordana, Julia Giese, Nadya Jahn. Jan Kakes, Benjamin Klaus, Jan Hannes Lang, Natalia Puzanova, and Peter Welz (2014). "Operationalizing the countercyclical capital buffer: indicator selection, threshold identification and calibration options", ESRB Occasional Paper Series, No. 5, June 2014.
Dokko, Jane, Brian Doyle, Michael T. Kiley, Jinill Kim, Shane Sherlund, Jae Sim, and Skander Van den Heuvel (2009). "Monetary Policy and the Housing Bubble," FEDS Working Paper No. 2009-49.
Edge, Rochelle M. and Ralf R. Meisenzahl (2011). "The Unreliability of Credit-to-GDP Ratio Gaps in Real Time: Implications for Countercyclical Capital Buffers," International Journal of Central Banking, Vol. 7, pp. 261-98.
FDIC Division of Research and Statistics (1997). "The Savings and Loan Crisis and Its Relationship to Banking." An Examination of the Banking Crises of the 1980s and Early 1990s. Vol. 1. 167-88. History of the 80s.
Orphanides, Athanasios and Simon van Norden (2002). "The Unreliability of Output-Gap Estimates in Real Time," The Review of Economics and Statistics, Vol. 84, No. 4, pp. 569-583.
Swiss National Bank (2013). "Implementing the countercyclical capital buffer in Switzerland: concretising the Swiss National Bank's role", February.
1. More disaggregated measures of the credit-to-GDP gap do feature as indicators for some foreign central banks that impose sectoral capital risk weights. For example, the Swiss National Bank includes the level of mortgage credit relative to GDP as one of the indicators for Switzerland's mortgage CCyB. (See SNB, 2013.) Return to text
2. We disaggregate private nonfinancial credit by type of credit using the "Sectors" tables of the Financial Accounts of the United States; specifically, tables L.101 and L.102 (albeit excluding municipal securities from table L.101). We disaggregate by type of lender using the "Instruments" tables of the Accounts. The Accounts provide precise information on how mortgages and other loans are held by type of lender; specifically, tables L.215, L.216, L.217, and L.222. The Accounts do not provide precise information on domestic nonfinancial corporate bonds and domestic nonfinancial commercial paper (which are about 18 percent and 1 percent of private nonfinancial credit). We assume that these instruments are held wholly by the IC.PF.MF sector. Information on aggregate corporate and foreign bonds and aggregate commercial paper (L.213 and L.209) suggest that this is a reasonable approximation given that the IC.PF.MF sector holds about three quarters of these instruments. Note also that there are broader concepts of credit, where we can disaggregate credit by lender precisely (see table L.1) and analysis on this data yields qualitatively similar results, suggesting that our approximation is not distorting our results. Return to text
3. If we express the cyclical components as the percent difference of the level from their trends, the components can still be summed to equal the cyclical component of the aggregate series, although first the disaggregated cyclical components need to be weighted by their share of aggregate private nonfinancial credit. Return to text
4. The two-sided HP-filter is more accurate because it only passes through lower frequency movements in the data into the trend and higher frequency movements into the gap. In contrast, the one-sided HP-filter passes through a mixture of different frequencies of the data to the trend and gap and as such does not ultimately yield good representations of the trend and cycle of a series. (See again, Baxter and King, 1999, section 5.2 for a discussion of this issue.) Return to text
5. The ESRB also recommends looking at indicators for multiple categories of vulnerabilities and, in particular, recommend that EU countries have at least one indicator from each of the following six categories: credit developments, overvaluations of property prices, external imbalances, bank balance sheet strength, private sector debt burden, and mispricing of risk. The basis for their recommendation, however, does not stem from concerns as to the ability of the trend credit-to-GDP ratio to measure sustainable credit provision. (See Detken etl al., 2014) Return to text
Please cite as:
Bassett, William F., Ainsley Daigle, Rochelle Mary Edge, and Gazi Ishak Kara (2015). "Credit-to-GDP Trends and Gaps by Lender- and Credit-type," FEDS Notes. Washington: Board of Governors of the Federal Reserve System, December 03, 2015. https://doi.org/10.17016/2380-7172.1653
Disclaimer: FEDS Notes are articles in which Board economists offer their own views and present analysis on a range of topics in economics and finance. These articles are shorter and less technically oriented than FEDS Working Papers.
