
FEDS Notes
 Print
PrintJune 2, 2015
Domestic Electronics Manufacturing: Medical, Military, and Aerospace Equipment and What We Don't Know about High-Tech Productivity
David Byrne
Beginning in the 1990s, Federal Reserve Board staff paid increasing attention to electronics manufacturing in order to advance its understanding of technological innovation, of the role of the domestic industrial sector in global value chains, and of the sources of labor productivity growth.1 To date, with respect to final electronics, which excludes intermediate products such as semiconductors, the primary focus of that effort has been general-purpose computing and communications equipment, but the output of these products from U.S. plants has dramatically declined; at the same time, the domestic production of special-purpose electronics--most notably for medical, military, and aerospace applications--has expanded significantly. This note describes the new composition of the domestic electronics sector and considers some implications for the "high-tech" measurement research agenda.
The Shift from General-Purpose to Special-Purpose Equipment
In 1997, computing and communications equipment accounted for two-thirds of U.S. shipments of final electronic equipment (table 1). At that time, domestic plants produced a substantial share of global output of personal computers (PCs), multi-user computers (such as servers and mainframes), cellular phones, and data networking equipment. However, U.S. production of these products has retreated, including a well-known plunge coinciding with the 2001 downturn and a less well-appreciated drop during the Great Recession (figure 1). All told, the nominal output of general-purpose electronics declined 60 percent from 1997 to 2012.2
Over the same period, the manufacturing of special-purpose electronics increased 51 percent and, by 2012, accounted for two-thirds of domestic electronic equipment manufacturing. Special-purpose electronics includes a diverse array of industry-specific equipment falling into three groups of roughly equal size in 2012 (table 2):
- Medical applications:3 Major electro-medical products include ultrasound machines, CT scanners, and MRI machines; the value of domestic production for each of these product classes was $2 billion in 2012, roughly equal to the U.S. output of desktop PCs.
- Military and aerospace applications: For example, U.S. production of light reconnaissance and surveillance electronic systems and equipment was $8 billion in 2012. The output of electronic warfare countermeasures equipment, a category newly identified in the 2012 Economic Census, was $4 billion.
- Other applications: The remaining one-third of special-purpose electronics production consists of a wide variety of industrial, commercial, and residential electronic equipment.
Measuring Special-Purpose Electronics Production
The recent emergence of special-purpose electronics as the dominant component of the electronics sector heightens our uncertainty about both labor productivity and, relatedly, the rate of innovation in the domestic manufacturing sector--topics of considerable interest at the present time. Furthermore, the contribution to productivity from the use of special-purpose electronics, particularly in the service sector, is an important open question. For example, accurate measures of electro-medical equipment investment, in combination with the recent improvements to the measurement of health care services introduced by the Bureau of Economic Analysis, may yield estimates of the contribution of capital deepening to health care productivity. Also, the rate of price declines for military and aerospace equipment may shed light on the role of the rise of global military expenditures in driving technical change.
Proper measurement of the production of equipment types that are characterized by rapid innovation depends critically on the deflation of nominal output by price indexes that account for the technical advances embodied in new products. One need only observe the imagery currently available for medical diagnosis or the nature of modern military intelligence to see this is a first-order concern for special-purpose electronics, but there has been little research into measuring technical change for these types of equipment--unlike computing and communications electronics, which have been closely examined by statistical agencies and academic economists.4 Prices for the types of computing and communications equipment that have been the subject of careful studies typically fall 10-25 percent per year; in stark contrast, prices for special-purpose equipment decline much more slowly or edge up over time (table 3).
The standard matched-model index methods used by the Bureau of Labor Statistics (BLS) to construct producer price indexes (PPIs) are designed to capture quality change, but the relatively slow BLS PPI declines for special-purpose electronics are surprising. Roughly one-quarter of the value of manufactured intermediate inputs for special-purpose electronics production is accounted for by electronic components, such as memory chips and microprocessors, for which prices fall very rapidly (table 3).5 This share is approximately the same for computing and communications equipment. It appears that in the case of special-purpose equipment, these falling input costs do not pass through to the price index for the final products.
That being said, prices for special-purpose electronics may behave differently from prices for general-purpose electronics due to differences in market structure. Special-purpose electronics producers have less opportunity to exploit scale economies; only a few thousand MRI machines are sold per year, while the global market for PCs is several hundred million units. In addition, the arcane contracting practices of the health care and government sectors surely affect price trends for special-purpose electronics as well. Supplemental research to corroborate or augment the official price series for these products would be a welcome development.
Unfortunately, detailed data appropriate for such analysis is scarce. Because special-purpose electronic equipment is highly customized, is sold in small volumes, is marketed to secretive customers, and is often bundled with other products and services, constructing constant-quality price indexes for this portion of the electronics sector will require a daunting campaign of what Shapiro and Wilcox (1996) called "house-to-house combat."6
1. For the purpose of this note, "electronics" is defined as the output of the Computers and Electronic Product subsector (NAICS 334) excluding Manufacturing and Reproducing Magnetic and Optical Media (NAICS 3346). The focus of this note is final electronics, which excludes electronic components, the output of the Semiconductor and Other Electronic Component Manufacturing industry (NAICS 3344). Return to text
2. This note relies primarily on the detailed product shipments information in the U.S. Census Bureau's quinquennial Economic Census. Return to text
3. Consult note to table 1 for a list of NAICS industries included in each application category. Return to text
4. A 2001 review the literature on quality-adjusted price indexes and found only Trajtenberg's 1990 study of CT scanners (Economic Analysis of Product Innovation: The Case of CT Scanners, Harvard University Press.) To the author's knowledge, that remains the only published study of special-purpose electronics prices. (See Berndt, Ernst R., David M. Cutler, Richard Frank, Zvi Griliches, Joseph P. Newhouse, and Jack E. Triplett, 2001, "Price indexes for Medical Care Goods and Services--An Overview of Measurement Issues.") Return to text
5. The BEA's 2007 Commodity Flows tables indicate that for NAICS 3345 (special-purpose electronics), 23.0 percent of manufactured intermediates come from NAICS 3344, and for NAICS 3341 and 3342 combined (computing and communications electronics), this figure is 26.6 percent. Roughly one-half (48.7 percent) of manufactured intermediates for NAICS 3345 come from NAICS 334 and this figure is roughly four-fifths (79.9 percent) for NAICS 3341 and 3342 combined electronics. Return to text
6. Shapiro, M. and D. Wilcox. 1996. "Mismeasurement in the Consumer Price Index: An Evaluation," NBER Macroeconomics Annual. Return to text
| Table 1: U.S. Production of Final Electronics |
|---|
| Value of Production, $ Billion | 1997-2012 Growth | Share of Production | ||||||||
|---|---|---|---|---|---|---|---|---|---|---|
| 1997 | 2002 | 2007 | 2012 | Total | Per Year | 1997 | 2002 | 2007 | 2012 | |
| Final Electronics | 260.7 | 188.6 | 250.2 | 203.9 | -21.8% | -1.6% | ||||
| Computing and communications | 169.4 | 92.8 | 119.5 | 66.4 | -60.8% | -6.1% | 65% | 49% | 48% | 33% |
| Computers and peripherals | 91.3 | 65.7 | 60.0 | 29.6 | -67.6% | -7.2% | 54% | 71% | 50% | 45% |
| Communications equipment | 78.1 | 42.0 | 59.5 | 36.8 | -52.9% | -4.9% | 46% | 45% | 50% | 55% |
| Special-purpose | 91.3 | 95.8 | 130.7 | 137.6 | 50.7% | 2.8% | 35% | 51% | 52% | 67% |
| Medical | 20.0 | 26.4 | 44.1 | 48.6 | 143.3% | 6.1% | 22% | 28% | 34% | 35% |
| Military & aerospace | 29.8 | 30.3 | 42.8 | 44.1 | 48.1% | 2.7% | 33% | 32% | 33% | 32% |
| Other special-purpose | 41.5 | 39.2 | 43.8 | 44.9 | 8.2% | 0.5% | 45% | 41% | 34% | 33% |
| Memo: | ||||||||||
| Computer and Elec. Prod. Mfg. (NAICS 334) | 410.4 | 305.0 | 372.7 | 319.5 | -22.1% | -1.7% | ||||
| Final Electronics | 260.7 | 188.6 | 250.2 | 203.9 | -21.8% | -1.6% | 64% | 62% | 67% | 64% |
| Electronic Components | 138.8 | 109.0 | 116.8 | 112.5 | -18.9% | -1.4% | 34% | 36% | 31% | 35% |
| Miscellaneous | 11.0 | 7.3 | 5.7 | 3.1 | -71.7% | -8.1% | 3% | 2% | 2% | 1% |
Source: Product shipments from Economic Census, Bureau of Census.
Note: Medical category: Electromedical and electrotherapeutic apparatus manufacturing; analytical laboratory instrument manufacturing; and irradiation apparatus manufacturing.
Military and aerospace category: Search, detection, navigation, guidance, aeronautical, and nautical system and instrument manufacturing.
Other special-purpose category: Automatic environmental control manufacturing for residential, commercial, and appliance use; Instruments and related products manufacturing for measuring, displaying, and controlling industrial process variables; Totalizing fluid meter and counting device manufacturing; Instrument manufacturing for measuring and testing electricity and electrical signals; Other measuring and controlling device manufacturing; and Audio and video equipment manufacturing
| Table 2: 2012 U.S. Production of Special-Purpose Electronics |
|---|
| Medical, therapeutic and laboratory applications | 48.6 |
| Ultrasound scanning | 2.5 |
| Computerized axial tomography (CT or CAT scan) | 1.8 |
| Magnetic resonance imaging (MRI) | 1.8 |
| Defibrillators | 1.3 |
| Digital radiography | 1.2 |
| Military and aerospace applications | 44.1 |
| Light reconnaissance and surveillance | 8.3 |
| Specialized electronic and communications intelligence | 5.9 |
| Missile-borne and space vehicle guidance | 4.6 |
| Electronic warfare countermeasures (jamming, communications, and radar) | 4.3 |
| Search, detection, and acquisition radar, airborne and missile/space | 4.2 |
| Other applications | 44.9 |
| Measuring and testing electricity and electrical signals | 11.1 |
| Industrial process control | 10.4 |
| Physical properties and kinematic testing and inspection | 3.5 |
| Geophysical, meteorological | 3.2 |
| Integrating and totalizing meters for gas and liquids | 2.7 |
| Automatic environmental control | 2.7 |
| Motor vehicle instruments | 2.0 |
| Table 3: Prices for Selected Classes of Electronics |
|---|
| Equipment Type | Average Annual Change, 1997-2012 | Source |
|---|---|---|
| General-Purpose | ||
| Computers (PCs, workstations, servers, etc.) | -13.0 | BLS Producer Price Index |
| Data Storage | -23.0 | Federal Reserve Board |
| Computer Peripherals | -1.4 | BLS Producer Price Index |
| Wireline Communications | -13.5 | Federal Reserve Board |
| Wireless Communications | -13.8 | Federal Reserve Board |
| Other Communications | 0.5 | BLS Producer Price Index |
| Special-Purpose | ||
| Defense & Aerospace | ||
| Search, detection & navigation | 1.6 | BLS Producer Price Index |
| Medical & Laboratory | ||
| Electro-medical | -1.6 | BLS Producer Price Index |
| Analytical laboratory | 1.2 | BLS Producer Price Index |
| Monitoring, process control, testing | BLS Producer Price Index | |
| Automatic environmental Control | 1.3 | BLS Producer Price Index |
| Industrial process Control | 2.2 | BLS Producer Price Index |
| Fluid meter & counting | 1.7 | BLS Producer Price Index |
| Electricity measuring & testing | 1.1 | BLS Producer Price Index |
| Electronic Components | ||
| Semiconductors | ||
| Microprocessors (MPUs) | -46.1 | Federal Reserve Board |
| Memory | -28.5 | Federal Reserve Board |
| MOS Logic excluding MPUs | -24.2 | Federal Reserve Board |
| Optoelectronics & Discretes | -4.5 | Federal Reserve Board |
| Analog | -3.9 | Federal Reserve Board |
| Circuit Boards | 0.4 | BLS Producer Price Index |
| Figure 1: U.S. Shipments for Selected Electronic Equipment |
|---|
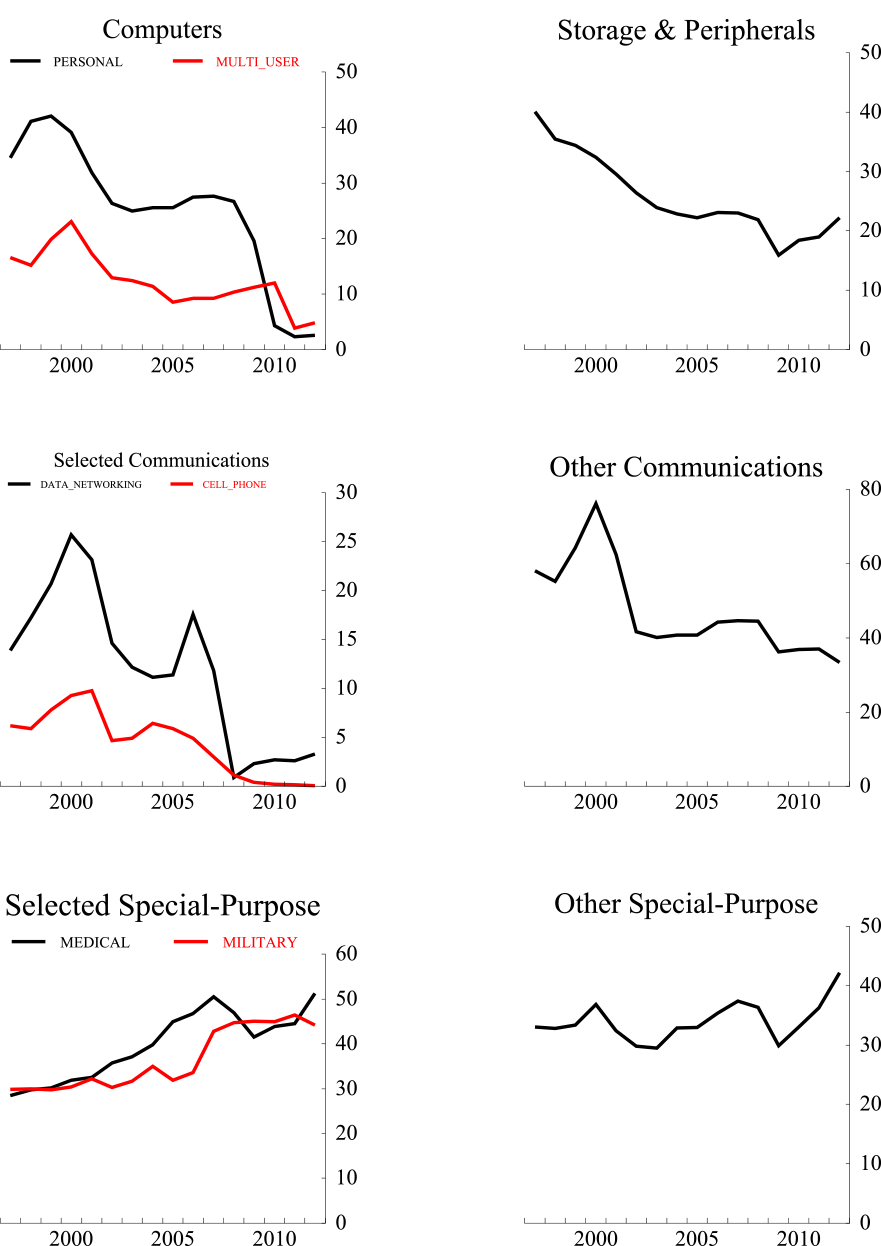 |
Source. Census Bureau, Federal Reserve Board estimates. $ Billion.
Please cite as:
Byrne, David M. (2015). "Domestic Electronics Manufacturing: Medical, Military, and Aerospace Equipment and What We Don't Know about High-Tech Productivity," FEDS Notes. Washington: Board of Governors of the Federal Reserve System, June 02, 2015. https://doi.org/10.17016/2380-7172.1548
Disclaimer: FEDS Notes are articles in which Board economists offer their own views and present analysis on a range of topics in economics and finance. These articles are shorter and less technically oriented than FEDS Working Papers.
