
FEDS Notes
 Print
PrintDecember 21, 2015
Dynamics of Overnight Money Markets: What Has Changed at the Zero Lower Bound?*
Elizabeth Klee, Zeynep Senyuz, and Emre Yoldas
The primary instrument of monetary policy in the U.S. has been the interest rate at which depository institutions (DIs) lend balances to each other overnight, the federal funds rate (FFR). Prior to the 2007-2009 financial crisis, daily open market operations had been conducted to keep the equilibrium FFR near the target rate determined by the Federal Open Market Committee (FOMC). The response of the Federal Reserve to the crisis significantly changed the landscape for implementation of monetary policy. The level of reserves in the banking system reached unprecedented levels as a variety of new facilities and tools were used to provide liquidity to the financial system.1
Against this backdrop, the Federal Reserve started paying interest on excess reserves (IOER) held by DIs at the end of 2008. Money market rates have been near the effective zero lower bound (ZLB) since the target range of 0 to 0.25 percent for the FFR was established in December 2008. In September 2014, the FOMC indicated that during the normalization of the stance of monetary policy, it intends to move the FFR into a target range mainly by adjusting the IOER and use an overnight reverse repurchase (ON RRP) facility and other supplementary tools as needed.2
In this note we provide a comparative analysis of overnight money market dynamics before the crisis and after the target FFR has been lowered to the ZLB. In addition, we also zoom into the ZLB period and analyze the two sub-periods before and after the ON RRP facility test operations have started in September 23, 2013. Overall, we find that the FFR has continued to be interconnected with the other money market rates although the co-movement seems to have declined somewhat. The most notable changes in rate dynamics are observed on calendar days including the financial reporting dates as well as the days of the reserve maintenance period of DIs.3 We show that volatility in the repo market has substantially declined since the inception of the ON RRP facility.
Data and Methodology
The data set consists of five overnight money market rates, namely the FFR, the London Interbank Offered Rate (Libor), the Eurodollar rate (ED), the primary dealer survey repo rate (RP), and the interest rate on AA-rated nonfinancial commercial paper (CP). We use the daily series from January 2, 2001 to August 31, 2015, and exclude the part of the financial crisis episode until the beginning of the ZLB period in December 2008.4 We use vector autoregressions and time-varying volatility models to analyze joint dynamics of the aforementioned interest rates. In particular, the model for the pre-crisis period is a vector error correction (VEC) model that incorporates the long-run equilibrium relationship of the rates as well as changes in the target FFR. For the ZLB period, given the stationary behavior of rates, we estimate a vector autoregressive (VAR) specification in levels of the interest rates. Both models incorporate certain calendar dates as well as the days of the maintenance period that may influence overnight funding rates. The ZLB model does not include target FFR since it is constant for the entire period. In both cases, GARCH models with calendar effects are applied to model residuals to capture time-varying volatility.
Results
Our estimates for the pre-crisis period are consistent with the monetary policy implementation framework in which FFR had been kept near the FOMC target through open market operations, and market activity led to adjustments in other rates consistent with movements in the FFR.5 In particular, we find that changes in the target FFR are highly significant in all rate equations, reflecting pass-through from the policy rate to other overnight rates (Table 1, Panel A). Moreover, the parameters that quantify the adjustment of all interest rates toward long-run equilibrium with the FFR are also highly significant, implying that it has been the other rates, not the FFR, that adjusted in response to market fluctuations. We document significant autocorrelation dynamics in all rates, while cross lags are mostly insignificant when we control for changes in target FFR and incorporate long-run equilibrium dynamics (Table 1, Panel B). At the ZLB, although the FFR continued to provide an anchor for the unsecured overnight rates, the transmission to the repo rate is hampered as implied by the insignificance of the lagged FFR in the RP equation (Table 2).
| Table 1: The Pre-Crisis Model for Overnight Money Market Rates |
|---|
Panel A. FFR Target Change and Error Correction Terms
| FFR | RP | Libor | CP | |
|---|---|---|---|---|
| D(FFR) | 0.454 | 0.406 | 0.337 | 0.416 |
| (0.00) | (0.00) | (0.00) | (0.00) | |
| EC1 | -0.032 | 0.303 | -0.01 | -0.001 |
| (0.39) | (0.00) | (0.72) | (0.98) | |
| EC2 | -0.016 | 0.125 | 0.455 | 0.091 |
| (0.91) | (0.41) | (0.00) | (0.43) | |
| EC3 | -0.005 | 0.021 | -0.1 | 0.431 |
| (0.97) | (0.92) | (0.21) | (0.01) |
Panel B. Sum of Autoregressive Terms
| FFR | RP | Libor | CP | |
|---|---|---|---|---|
| FFR | -0.396 | -0.057 | -0.266 | -0.12 |
| (0.03) | (0.82) | (0.06) | (0.58) | |
| RP | -0.041 | -0.692 | 0.171 | 0.071 |
| (0.65) | (0.00) | (0.02) | (0.42) | |
| Libor | 0.728 | 0.258 | -0.749 | 0.281 |
| (0.04) | (0.48) | (0.00) | (0.22) | |
| CP | -0.767 | 0.143 | 0.506 | -0.65 |
| (0.06) | (0.79) | (0.02) | (0.07) |
Estimates from a VEC model are reported. The daily sample runs from January 2, 2001 to July 31, 2007. P-values based on robust (HAC) standard errors are reported in parenthesis. Lag length selected by Schwarz information criterion is 4. EC1, EC2, and EC3 denote the error correction terms implied by the long-run equilibrium relationship of FFR with RP, Libor, and CP respectively.
| Table 2: The ZLB Model for Overnight Money Market Rates |
|---|
Sum of Autoregressive Terms
| FFR | RP | ED* | CP | |
|---|---|---|---|---|
| FFR | 0.911 | 0.107 | 0.223 | 0.153 |
| (0.00) | (0.21) | (0.00) | (0.02) | |
| RP | 0.032 | 0.809 | 0.014 | -0.011 |
| (0.00) | (0.00) | (0.29) | (0.47) | |
| ED | -0.024 | 0.048 | 0.705 | 0 |
| (0.53) | (0.50) | (0.00) | (1.00) | |
| CP | 0.036 | 0.054 | 0.069 | 0.881 |
| (0.01) | (0.14) | (0.00) | (0.00) |
Estimates from a VAR model are reported. The daily sample runs from December 17, 2008 to August 31, 2015. p-values based on robust (HAC) standard errors are reported in parenthesis. Lag length selected by Schwarz criterion is 4.
*On February 4, 2016, this column header was updated to correct a typo.
The correlations of rates that are estimated after accounting for persistence and volatility dynamics also suggest continued interconnectedness of FFR to other interest rates at the ZLB (Figure 1). The correlations of FFR with RP and CP declined somewhat at the ZLB period, but remained sizable. However, financial reporting dates appear to have substantial effects on the comovement of FFR and RP against the backdrop of abundant bank reserves and changing financial regulations. For example, the correlation of FFR and RP on quarter-ends declined from 0.35 to effectively 0 at the ZLB.6
| Figure 1: Correlations of FFR with the Other Rates: Pre-crisis vs. ZLB |
|---|
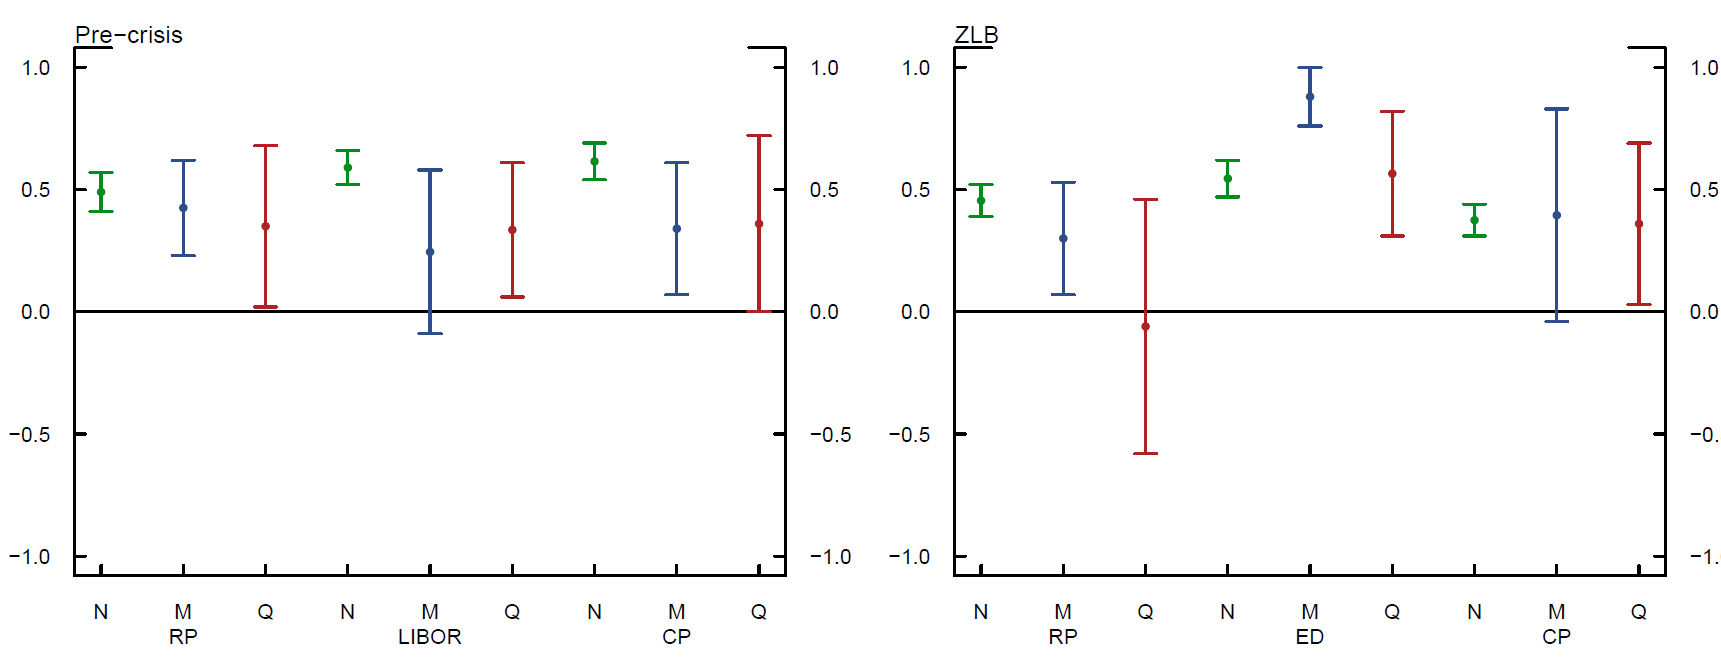 |
Dots indicate point estimates and the surrounding bands are 95% confidence intervals. N denotes normal days that exclude month-end and quarter-end dates. M and Q denote month-end and quarter-end respectively. Pre-crisis sample includes Libor, which is replaced with ED in the ZLB period.
Another notable change in the ZLB period relative to the pre-crisis era has been the disappearance of the day-of-maintenance-period effects on the FFR, likely reflecting the abundance of bank reserves in the system. For example, the FFR used to be firmer on Mondays possibly due to elevated payment flows while softer on Fridays since banks usually try to avoid an excess position over the weekend during which reserves count for three days of requirement.7 In contrast, we find no statistically or economically significant day-of-maintenance-period effects on the FFR in the ZLB period.
The dynamics surrounding financial reporting days changed notably at the ZLB amid abundant reserves in the banking system as well as the introduction of new financial regulations. All rates were subject to modest upward pressure at month-ends prior to the crisis while quarter-end effects had been somewhat more prominent (Figure 2, left). The most notable quarter-end effect had been the decline in the repo rate, which likely reflected window-dressing activity that decreased demand for repo financing on such dates. The unsecured financing rates had exhibited relatively smaller movements on quarter-ends, and in the opposite direction. In contrast, the quarter-end effects turned negative for all unsecured rates at the ZLB amid the announcement and implementation of Basel III capital and liquidity reforms. In particular, the Liquidity Coverage Ratio and leverage requirements seem to have reduced materially banks' demand for short-term unsecured borrowing on reporting days.
| Figure 2: Calendar Effects on Overnight Money Market Rates: Pre-crisis vs. ZLB |
|---|
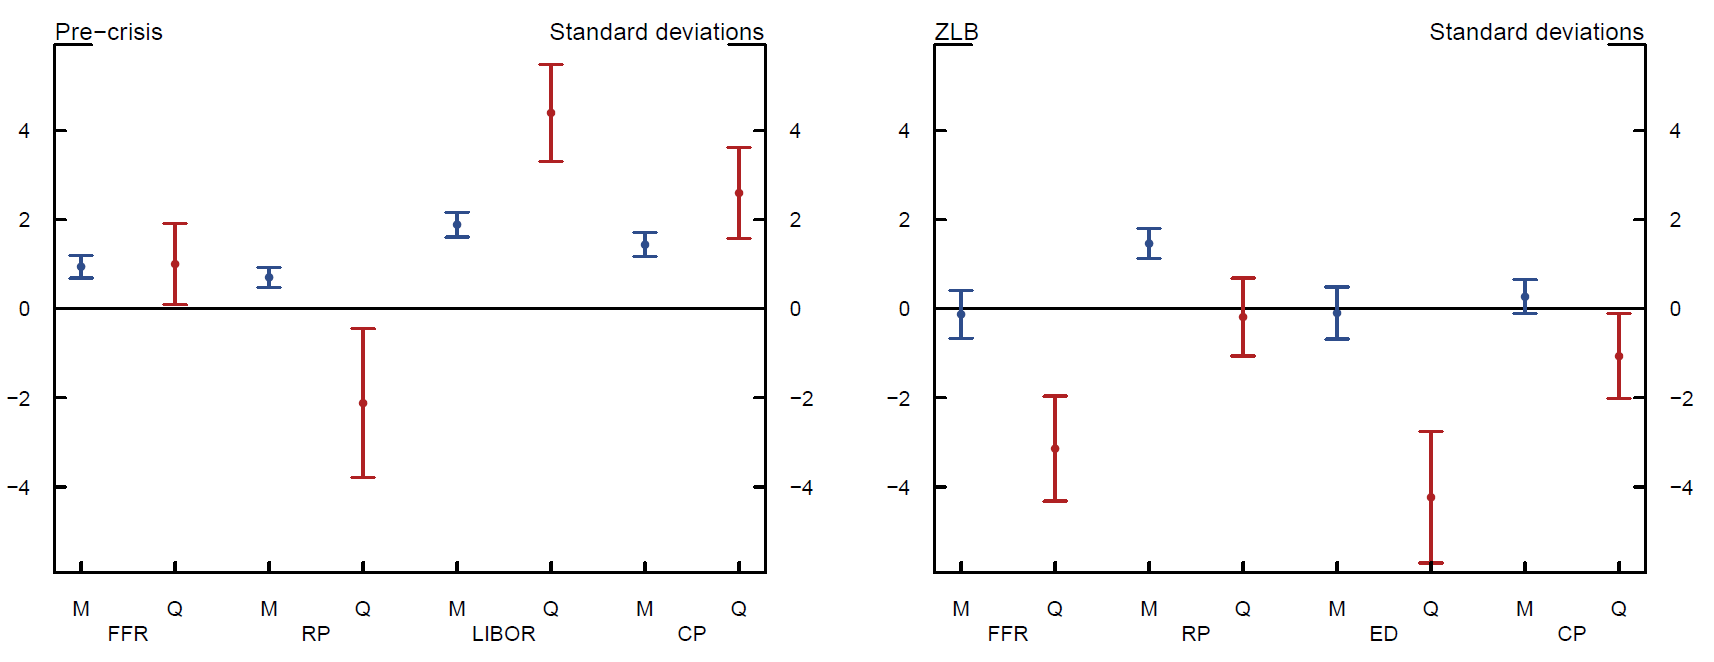 |
Dots indicate point estimates and the surrounding bands are 95% confidence intervals. M and Q denote month-end and quarter-end respectively. Effects are normalized with respect to the standard deviations of model residuals.
| Figure 3: RP Volatility and ON RRP |
|---|
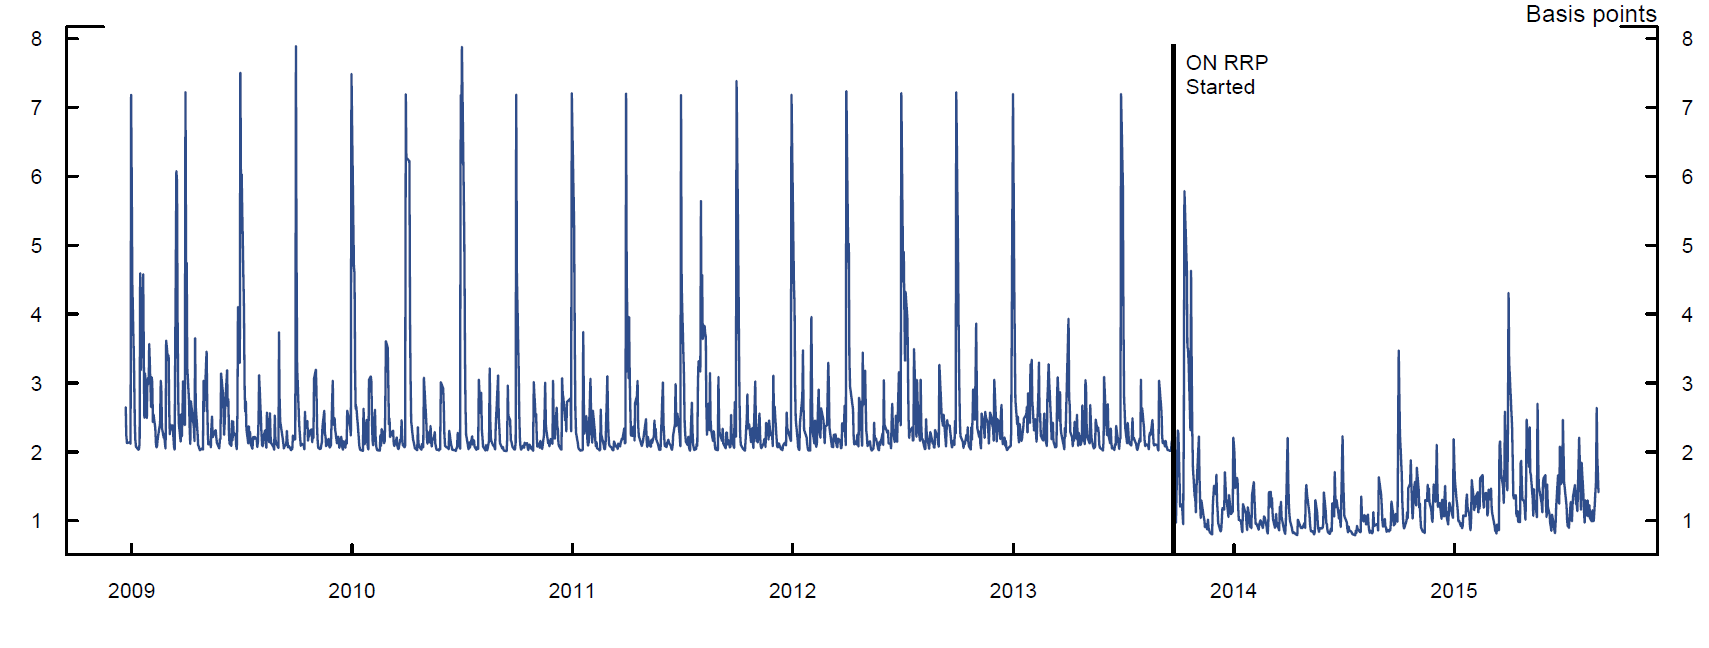 |
Estimated volatility of the RP from a GARCH model with month-end and quarter-end effects.
Contrary to the case of unsecured rates, the quarter-end effect has become insignificant for RP in the ZLB period. This estimate captures the net effect as the ZLB period contains several quarter-end dates with material movements in RP in either direction. Such changes are reflected in the statistically significant quarter-end effect on the volatility of the repo rate during the ZLB, which we estimate to be around 2 basis points. As shown in Figure 3 the decline in RP volatility is strikingly evident both in the level and the volatility of the series. Consistent with the intended effect of ON RRP to set a soft floor for repo rates, volatility in the repo market has substantially dampened after the introduction of the program. We also find that calendar effects on RP volatility largely disappeared after that point. Again, this likely reflects the soft floor placed on repo rates by the ON RRP, which lessen the potential for sharp falls in rates, as well as the availability of the ON RRP as a viable investment, especially on financial reporting dates when other options may not be available. Both results point out to a significant change in the structure of the money markets initiated by the test operations of the ON RRP facility.
References
Bech, M., E. Klee, and V. Stebunovs (2014): "Arbitrage, Liquidity and Exit: The Repo and Federal Funds Market before, during and Emerging from the Financial Crisis', in Developments in Macro-Finance Yield Curve Modelling, ed. by J.S. Chadha, A.C. J. Durr, M.A. S. Joyce, and L. Sarno, Cambridge University Press, 293-325.
Carpenter, S. and S. Demiralp (2006): "The Liquidity Effect in the Federal Funds Market," Journal of Money, Credit and Banking, 38, 901-920.
Hamilton, J. D., (1996): "The Daily Market for Federal Funds," Journal of Political Economy 104, 26-56.
Judson, R. and E. Klee (2010): "Whither the Liquidity Effect: The Impact of Federal Reserve Open Market Operations in Recent Years," Journal of Macroeconomics, 32, 713-731.
* We thank James Clouse, Jane Ihrig, and Josh Louria for helpful comments and Richard Sambasivam for research assistance. Return to text
1. The reserve balances of depository institutions currently stand close to $3 trillion compared to the pre-crisis level of about $25 billion. Return to text
2. See "Policy Normalization Principles and Plans" issued by the Federal Reserve on September 17, 2014 www.federalreserve.gov/newsevents/press/monetary/20140917c.htm. Return to text
3. An institution is responsible for satisfying its reserve balance requirement by holding balances on average over a 14-day maintenance period in an account at the Federal Reserve. For details of reserve maintenance, see www.federalreserve.gov/monetarypolicy/files/reserve-maintenance-manual.pdf. Return to text
4. The daily effective FFR is calculated as the volume-weighted average of rates on trades arranged by major brokers and is available from the FRBNY. The Treasury general collateral repo rate is a volume-weighted average on overnight repo transactions where the underlying collateral is U.S. Treasury security and it is obtained from the primary dealer survey of the FRBNY. We use the ED data that the FRBNY started to publish in March 2010. Prior to that date, the ED data are obtained from ICAP. For the pre-crisis period, Libor is substituted for the ED since the latter is not available. The CP rate is from the Federal Reserve Board's CP release which is derived from data supplied by The Depository Trust and Clearing Corporation (DTCC). Return to text
5. See Bech et al. (2014) for a detailed analysis of repo and federal funds markets. Return to text
6. We also observe substantially lower correlations of the secured RP with other unsecured rates on financial reporting dates at the ZLB (not shown). Return to text
7. See for example, Hamilton (1996), Carpenter and Demiralp (2006) and, Judson and Klee (2010). Return to text
Please cite as:
Klee, Elizabeth, Zeynep Senyuz, and Emre Yoldas (2015). "Dynamics of Overnight Money Markets: What Has Changed at the Zero Lower Bound?" FEDS Notes. Washington: Board of Governors of the Federal Reserve System, December 21, 2015. https://doi.org/10.17016/2380-7172.1676
Disclaimer: FEDS Notes are articles in which Board economists offer their own views and present analysis on a range of topics in economics and finance. These articles are shorter and less technically oriented than FEDS Working Papers.
