
FEDS Notes
 Print
PrintNovember 24, 2015
Financial Well-Being of Individuals Living in Areas with Concentrated Poverty
Jeff Larrimore
Much of the attention to income inequality and poverty is focused on individual level circumstances. However, researchers have also observed that living in an area of concentrated poverty may result in additional disadvantages to individuals beyond that which results from their own individual poverty status. This can be due to higher crime, fewer public and private sector investments, and dilapidated housing stocks in neighborhoods where poverty is concentrated (see e.g. Kneebone, Nadeau, and Berube 2011). As a result, poor individuals who live in an area with concentrated poverty face an additional layer of deprivation beyond that experienced by those who are poor but living in a more affluent area (Perkins and Sampson Forthcoming).
Recognizing that individuals living in these areas of concentrated poverty may be at greater risk of hardships across a range of dimensions, this note uses the Federal Reserve Board's Survey of Household Economics and Decisionmaking (SHED) to consider the financial well-being of individuals in these areas relative to those living in areas with lower poverty rates. The SHED is an annual survey that has been conducted by the Federal Reserve Board since 2013. It asks adults age 18 and older about a range of topics related to their financial situation, including their savings, access to credit, and retirement plans. In 2014 the survey included an oversample of low income individuals, which--along with geographic identifiers in the survey--makes it well suited to consider the financial well-being of those living areas of concentrated poverty.1
Characteristics of Concentrated Poverty Areas
Using the Census Bureau's definition that an area has concentrated poverty if at least 20 percent of residents live below the poverty threshold (Bishaw 2014), Figure 1 illustrates the zip codes with concentrated poverty from 2008-2013 American Community Survey (ACS).2 Of the 32,457 zip codes for which the ACS has poverty information, 8,229 of them are considered to be areas of concentrated poverty.3 These zip codes are geographically dispersed, but with heavy concentrations in the Appalachian region, the southwest, and the Deep South. In the 2014 SHED survey, 25.4 percent of weighted respondents live in these zip codes with concentrated poverty, which is consistent with the Census Bureau's finding that, in 2010, 25.7 percent of the entire U.S. population lived in census tracts with concentrated poverty (Bishaw 2014).
| Figure 1: Zip codes with concentrated poverty in the United States |
|---|
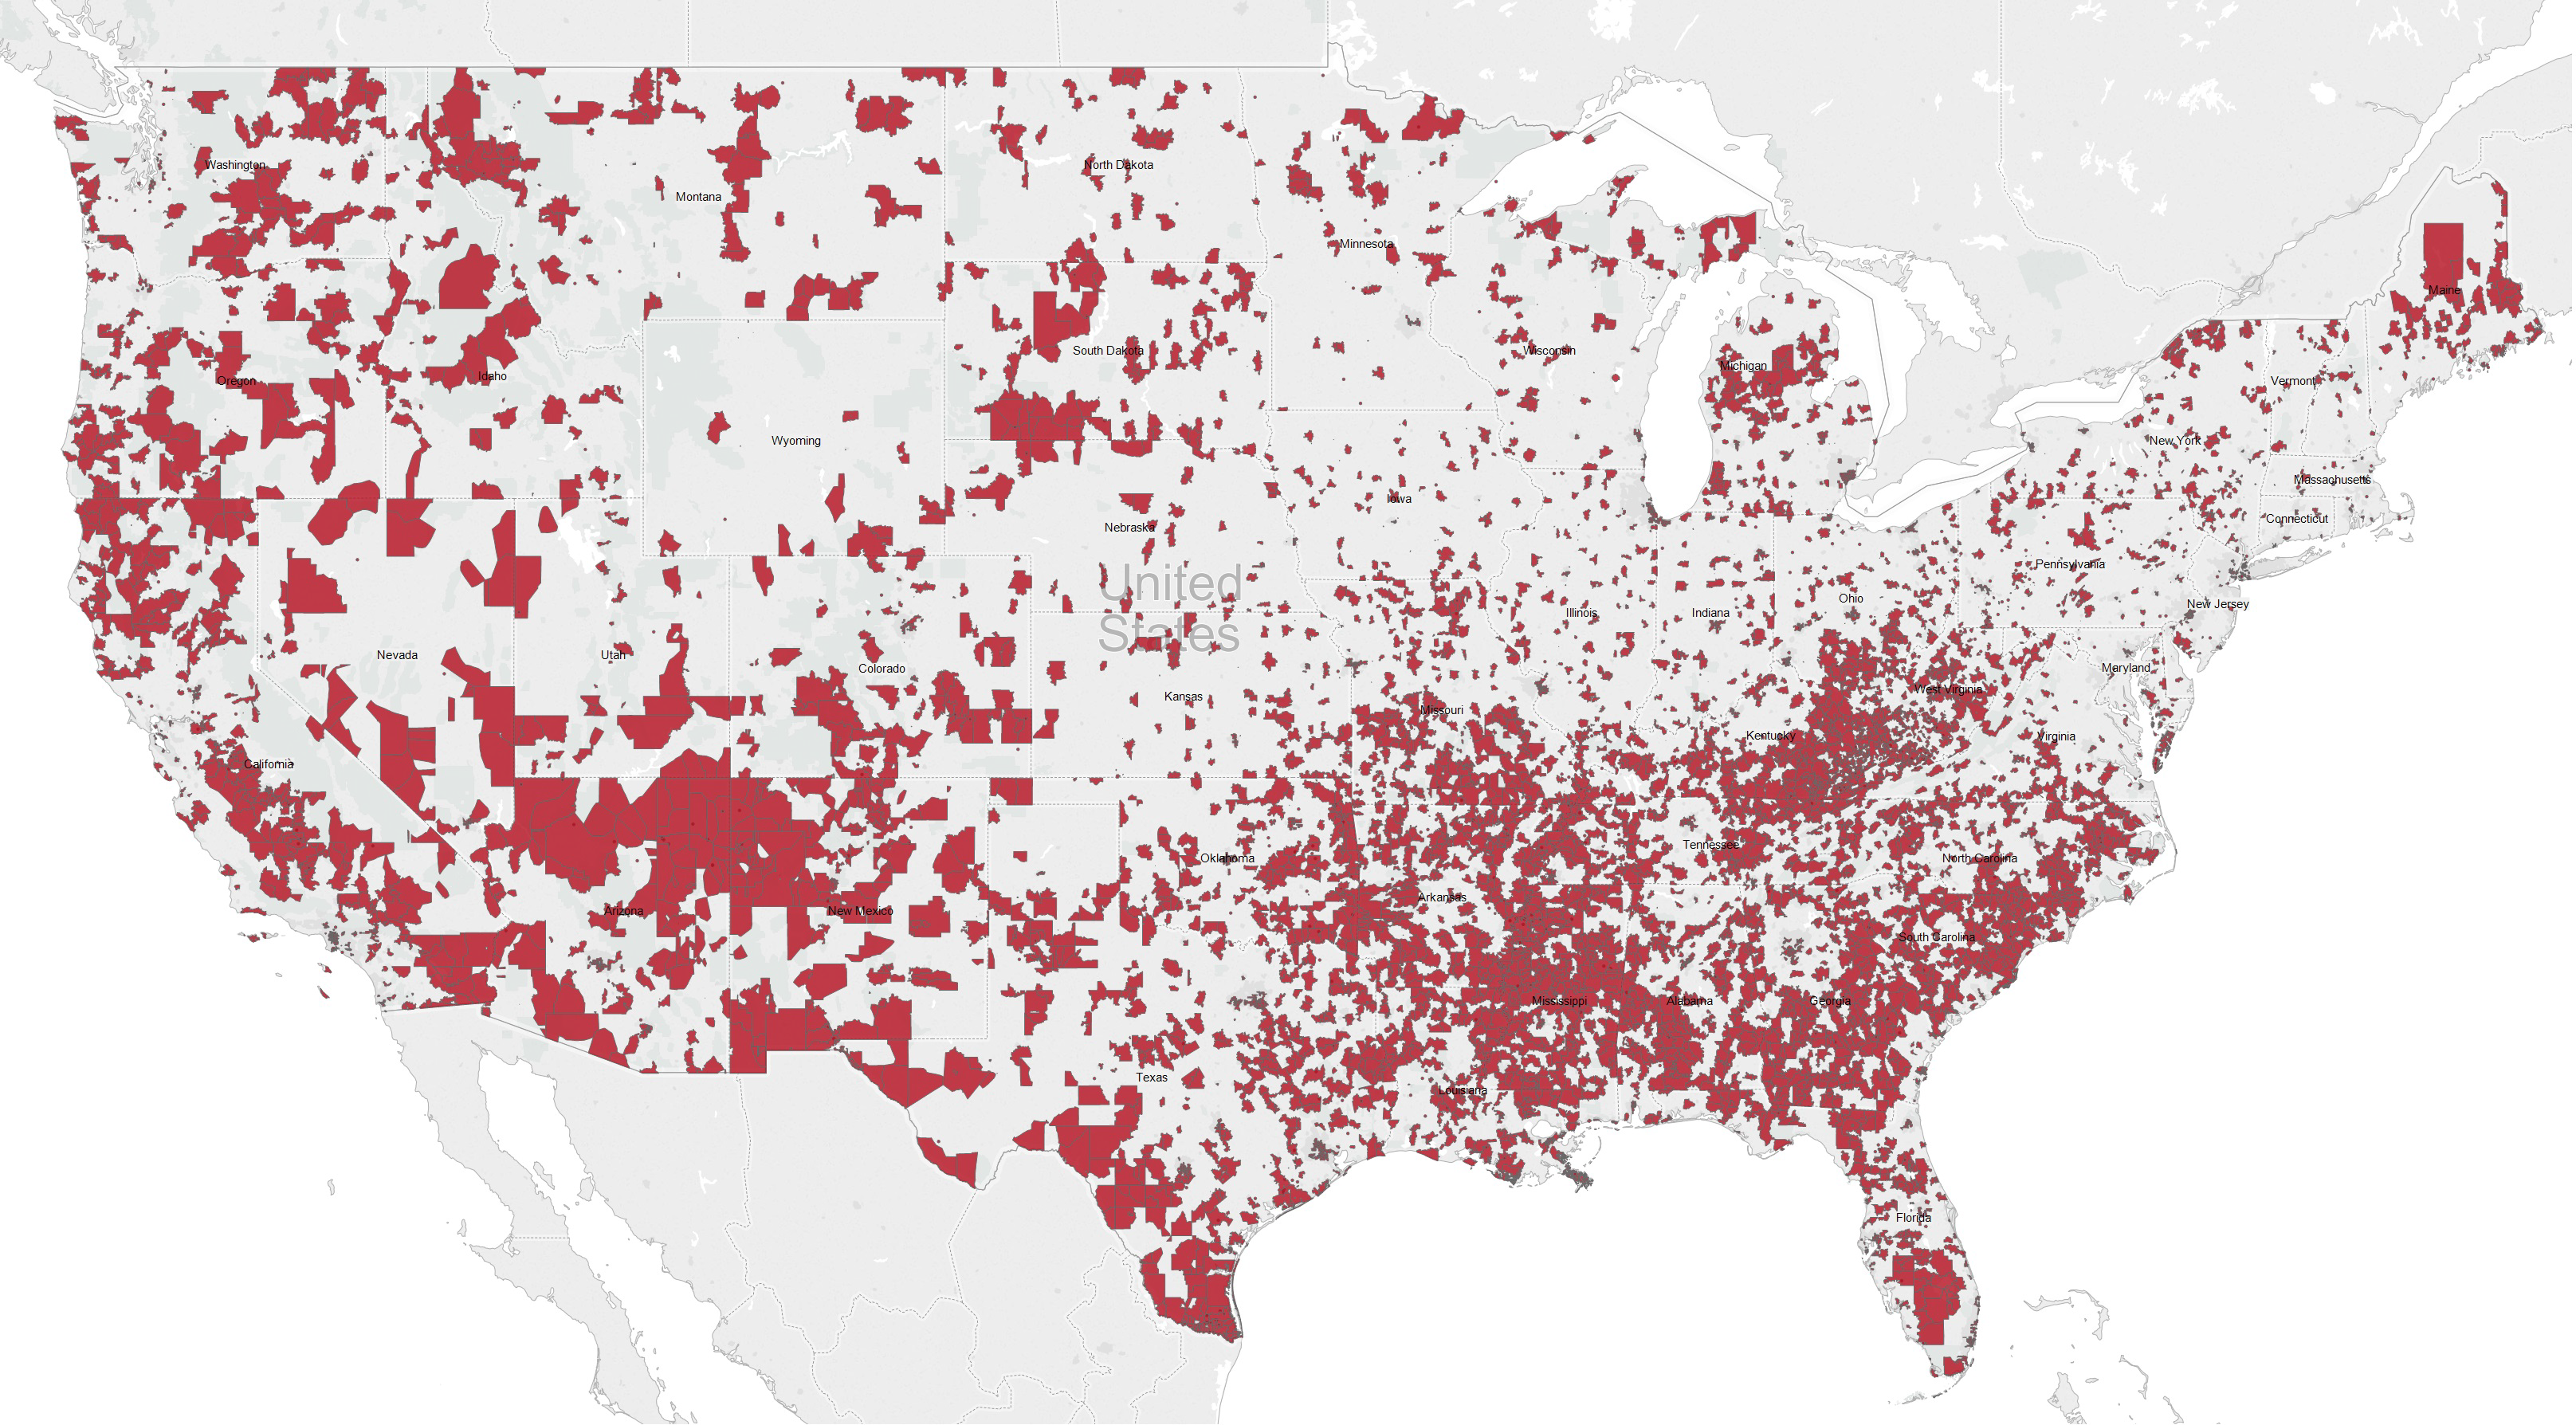 |
Source: Author's calculations using 2008-2013 American Community Survey (ACS) data accessed from the Missouri Census Data Center, http://mcdc2.missouri.edu/ 
Although one's own poverty status and the level of poverty in their zip code are highly correlated, it is not uncommon for poor adults to live in more affluent areas--or for individuals who are not poor to live in poor neighborhoods. Over half of the 11.4 percent of SHED respondents whose household income is below the poverty threshold live outside of concentrated poverty zip codes. Conversely, nearly 80 percent of the 25.4 percent of individuals who live in zip codes with concentrated poverty are not poor themselves (Table 1).4
| Table 1: percent of adults whose household income is below the poverty threshold and who live in zip codes with concentrated poverty |
|---|
| Not-poor (household) | Poor (household) | Total | |
|---|---|---|---|
| Not-concentrated poverty (zip) | 68.3 | 6.3 | 74.6 |
| Concentrated poverty (zip) | 20.3 | 5.1 | 25.4 |
| Total | 88.6 | 11.4 |
Source: Author's calculations using the Federal Reserve Board's 2014 Survey of Household Economics and Decisionmaking (SHED) data and 2008-2013 American Community Survey (ACS) data accessed from the Missouri Census Data Center, http://mcdc2.missouri.edu/ .
In addition to one's own poverty status, an individual's race and ethnicity are important predictors of whether they live in a high poverty area. While just 32 percent of poor whites live in concentrated poverty zip codes, 47 percent of non-poor blacks and 34 percent of non-poor Hispanics live in these areas (Figure 2). Hence, a poor white adult is less likely to live in an area with concentrated poverty than is a non-poor black or Hispanic adult.
| Figure 2: Percent of adults living in a zip code with concentrated poverty, by race/ethnicity and own poverty status |
|---|
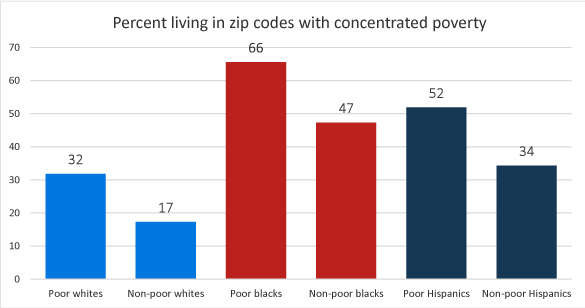 |
Source: Author's calculations using the Federal Reserve Board's 2014 Survey of Household Economics and Decisionmaking (SHED) data and 2008-2013 American Community Survey (ACS) data accessed from the Missouri Census Data Center, http://mcdc2.missouri.edu/
This relationship between one's race and ethnicity, their own income status, and the poverty level of their neighborhood can be clearly observed in a logit regression that regresses whether an individual lives in concentrated poverty on their race/ethnicity and own poverty status. When doing so in Table 2, we see that the relationship between being black and living in concentrated poverty (odds ratio of 4.26) far exceeds the relationship between one's own poverty status and the level of poverty in their zip code (odds ratio of 2.19).
| Table 2: Logit regression results (odds ratios) for the odds of living in a concentrated poverty area, by own poverty status and race/ethnicity |
|---|
| Odds Ratio | |
|---|---|
| Own Poverty Status | |
| Own income below poverty threshold | 2.19*** |
| (0.226) | |
| Race and Ethnicity | |
| Black, non-Hispanic | 4.263*** |
| (0.508) | |
| Other non-white, non-Hispanic | 1.247 |
| (0.233) | |
| Hispanic | 2.468*** |
| (0.294) | |
| Constant | 0.209*** |
| (0.011) |
Source: Author's calculations using the Federal Reserve Board's 2014 Survey of Household Economics and Decisionmaking (SHED) data and 2008-2013 American Community Survey (ACS) data accessed from the Missouri Census Data Center, http://mcdc2.missouri.edu/ .
Notes: Standard errors in parentheses. *** Significant at the 1% level, ** significant at the 5% level, * significant at the 10% level. Omitted categories for indicator variables are individuals whose income is above the poverty threshold, and non-Hispanic whites.
Financial well-being of those living in concentrated poverty areas
To explore the extent to which individuals who live in areas of concentrated poverty are more likely to experience financial challenges, we use the SHED data to observe how various measures of financial well-being differ based on the level of poverty in one's neighborhood. Table 3 provides summary statistics on these outcomes based both on whether individuals are in poverty themselves and whether they live in an area with concentrated poverty. When comparing all adults who live in high poverty zip codes to those living in more affluent areas (columns 1 and 2), it is clear that those living in concentrated poverty areas are less financially secure across a range of dimensions. These individuals are less likely to have a bank account, more likely to have used alternative financial services, and are less likely to have access to a credit card.5 They also are more likely to indicate that they either would be unable to pay a $400 emergency expense, or that they would rely on borrowing or selling something to do so. Perhaps related to the lack of financial safety nets among those in concentrated poverty neighborhoods, two out of five adults living in these high poverty areas have missed some form of medical treatment in the past year because of an inability to pay.
| Table 3: Financial well-being of adults based on whether they live in concentrated poverty |
|---|
| All adults | Poor adults | |||
|---|---|---|---|---|
| Not concentrated poverty | Concentrated poverty | Not concentrated poverty | Concentrated poverty | |
| Employment characteristics | ||||
| Employed | 55.9 | 53.5 | 35.2 | 30.5 |
| Wants to work more (among employed) | 35.6 | 37.2 | 40.8 | 58.4+ |
| Homeownership and technology access | ||||
| Own home | 64.4 | 52.5+ | 31.3 | 27.4 |
| Live with others | 19.1 | 21.9+ | 26.3 | 29.8 |
| Internet access at home | 84.6 | 73.1+ | 51.7 | 49.7 |
| Banking Status | ||||
| Unbanked | 6.2 | 13.9+ | 24.1 | 31.6+ |
| Used alternate financial services | 11.9 | 24.2+ | 33.3 | 38.0 |
| Lacks a credit card | 21.0 | 33.1+ | 53.7 | 66.6+ |
| Savings and emergency expenses | ||||
| Can't pay or would borrow to pay $400 expense | 57.0 | 40.6+ | 20.6 | 18.5 |
| No retirement savings | 29.4 | 43.1+ | 70.1 | 71.4 |
| Avoided medical treatment due to cost | 28.1 | 40.7+ | 46.0 | 47.8 |
| Overall well-being | ||||
| Struggling to get by or just getting by | 32.0 | 41.2+ | 61.1 | 62.9 |
Source: Author's calculations using the Federal Reserve Board's 2014 Survey of Household Economics and Decisionmaking (SHED) data and 2008-2013 American Community Survey (ACS) data accessed from the Missouri Census Data Center, http://mcdc2.missouri.edu/ .
Note: all values are the percent of respondents in the category who reported the specified characteristic. +Statistically different at the 10% level from those not living in concentrated poverty.
To some extent these observations may simply reflect the lower incomes of individuals living in these communities rather than additional effects from the neighborhood conditions. To control for one's own poverty status, columns 3 and 4 of Table 3 show the well-being outcomes based on the poverty level in one's neighborhood--but it restricts the sample to those who are poor themselves. For many of the measures considered, the gaps in outcomes between those living in high-poverty and low-poverty areas are smaller when focusing only on the low income population. Nevertheless, the differences do not disappear entirely.
To more fully control for individual characteristics when considering the impact of living in concentrated poverty, we proceed by regressing these financial well-being outcomes on neighborhood poverty, individual poverty status, own income, and individual demographic characteristics. These results are provided in Table 4.
| Table 4: Logit regression results (odds ratios) for the impact of living in concentrated poverty on measures of financial well-being |
|---|
| Employed | Wants to work more | Owns home | Lives with others | Internet access at home | Unbanked | |
|---|---|---|---|---|---|---|
| Concentrated poverty | 1.116 | 0.918 | 0.956 | 0.907 | 0.826* | 1.119 |
| (0.107) | (0.118) | (0.106) | (0.111) | (0.095) | (0.167) |
| Used Alternative Financial Services | No credit card | Pay $400 expense without borrowing | No retirement savings | Avoided medical treatment | Struggling or just getting by | |
|---|---|---|---|---|---|---|
| Concentrated poverty | 1.35*** | 1.113 | 0.828** | 1.188 | 1.288*** | 0.954 |
| (0.156) | (0.121) | (0.078) | (0.143) | (0.119) | (0.089) |
Source: Author's calculations using the Federal Reserve Board's 2014 Survey of Household Economics and Decisionmaking (SHED) data and 2008-2013 American Community Survey (ACS) data accessed from the Missouri Census Data Center, http://mcdc2.missouri.edu/ .
Notes: Standard errors in parentheses. All regressions control for gender, marital status, race, ethnicity, income, education, MSA status, and own poverty status. *** Significant at the 1% level, ** significant at the 5% level, * significant at the 10% level.
When doing so, we observe that even after controlling for individual level characteristics, those who live in concentrated poverty areas are significantly less likely to say that they would pay a $400 emergency expense without borrowing. They also are less likely to have internet in their home, more likely to have avoided medical treatment because they could not afford it, and more likely to have used an alternative financial service in the past year. This is consistent with the findings in previous research that high poverty areas are less likely to have depository financial establishments and are more likely to have alternative financial services organizations (Newberger and Riggs 2006), which in turn could influence the rates of usage.
Although it appears that individuals living in concentrated poverty areas are disadvantaged on several dimensions relative to those living in more affluent areas, we also observe that, once controlling for individual level characteristics, several of the well-being measures do not appear to be significantly impacted by the poverty in one's area. In particular, whether the individual feels that they are "struggling to get by" or "just getting by," owns their home, lives with others, has any checking/savings account, or has any retirement savings do not appear to be impacted by living in an area of concentrated poverty beyond the impact of one's personal individual characteristics.6 However, it remains possible that living in concentrated poverty impacts these well-being measures by stunting one's income potential. Any effects that occur through this secondary channel would disappear once including the income controls. Thus, to the extent that living in concentrated poverty adversely impacts one's income, the effects of living in these areas on one's overall well-being may be higher.
Conclusion
Just over a quarter of the U.S. population lives in areas with concentrated poverty, including nearly half of those who are poor themselves. When comparing the financial well-being of adults living in areas of concentrated poverty to those who live in more affluent areas, there is evidence that living in a high poverty neighborhood adversely impacts several financial outcomes. In particular, living in these neighborhoods has the strongest adverse impact on measures that are related to access to establishments such as internet providers, banks, or alternative financial service organizations. Additionally, respondents who live in these areas are less prepared for even modest emergencies. Those who live in high poverty areas are more likely to report both that they have missed some form of medical treatment in the past year due to cost and are more likely to report that they would borrow, sell something, or simply could not pay a $400 emergency expense.
References
Bishaw, Alemayehu. "Changes in Areas With Concentrated Poverty: 2000 to 2010." U.S. Census Bureau American Community Survey reports ACS-27 (2014).
Kneebone, Elizabeth, Carey Nadeau, and Alan Berube. "The Re-Emergence of Concentrated Poverty: Metropolitan Trends in the 2000s." Brookings Metropolitan Policy Program Series (November 2011).
Newberger, Robin, and T. Lynn Riggs. "The Impact of Poverty on the Location of Financial establishments: Evidence from Across County Data" Profitwise (April 2006): 2-5.
Perkins, Kristin L., and Robert J. Sampson. "Compound Deprivation in the Transition to Adulthood: The Intersection of Racial and Economic Inequality among Chicagoans, 1995-2013." RSF: The Russell Sage Foundation Journal of the Social Sciences (Forthcoming).
1. To account for the oversample design, as well as any under- or over-sampling that may occur naturally in the survey, all results presented here are weighted based on income and demographics to be representative of the entire U.S. adult population. Additional details on the SHED survey, including additional information on the weighting and a public-use version of the microdata, is available via: http://www.federalreserve.gov/communitydev/shed.htm. Return to text
2. ACS data was accessed from the Missouri Census Data Center via: http://mcdc2.missouri.edu/ Return to text
3. There are an additional 532 zip codes for which poverty information is not available. Return to text
4. In 2014, the Census Bureau reported that 12.8 percent of adults were in poverty. The slightly lower fraction of SHED respondents whose income is below the poverty threshold can be largely attributed to the fact that the Census Bureau determines poverty based on family income and family characteristics, whereas the SHED only collects household income so can only be used to observe poverty at the household level. Additionally, the SHED collects income in ranges, which do not precisely match the income cutoffs for the poverty threshold. The range ending closes to the poverty threshold is used to determine poverty status, which means that some respondents whose income is very near the poverty threshold may be misclassified as poor or not-poor in the SHED survey. Return to text
5. The SHED defines alternative financial services as check cashing services, money orders, pawn shop loans, auto title loans, paycheck advances, and payday loans. Return to text
6. These outcomes were also tested using a linear variable for area poverty as the fraction in the zip-code who are poor, rather than whether the area poverty exceeds the 20 percent threshold. When doing so the results are generally consistent with those presented here--except that the percent in poverty does have a significant positive impact on the odds of having no retirement savings. Return to text
Please cite as:
Larrimore, Jeff (2015). "Financial Well-Being of Individuals Living in Areas with Concentrated Poverty," FEDS Notes. Washington: Board of Governors of the Federal Reserve System, November 24, 2015. https://doi.org/10.17016/2380-7172.1636
Disclaimer: FEDS Notes are articles in which Board economists offer their own views and present analysis on a range of topics in economics and finance. These articles are shorter and less technically oriented than FEDS Working Papers.