
FEDS Notes
 Print
PrintJune 8, 2015
The Labor Share of Income and Equilibrium Unemployment
Andrew Figura and David Ratner
After rising to 10 percent in the wake of the Great Recession, the unemployment rate is now approaching a level that many observers--including the Congressional Budget Office, as shown in Figure 1--associate with the natural rate of unemployment.
| Figure 1. The Unemployment Rate |
|---|
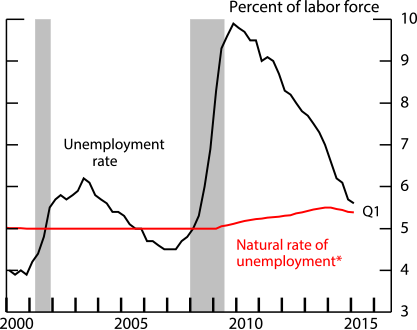 |
Source. Bureau of Labor Statistics, Congressional Budget Office.
* Long-run estimate
However, there is uncertainty over whether structural changes in the labor market in recent years have changed the natural rate. In arguing that it has, some observers have pointed to an outward shift in the Beveridge curve (see Figure 2) which suggests that a given level of demand, represented by vacancies, is consistent with a higher level of unemployment now than previously. In fact, in the first quarter of 2015, the rate of job openings (as measured by the BLS's Job Openings and Labor Turnover Survey) was at its highest level since the first half of 2001.
| Figure 2. The Beveridge Curve |
|---|
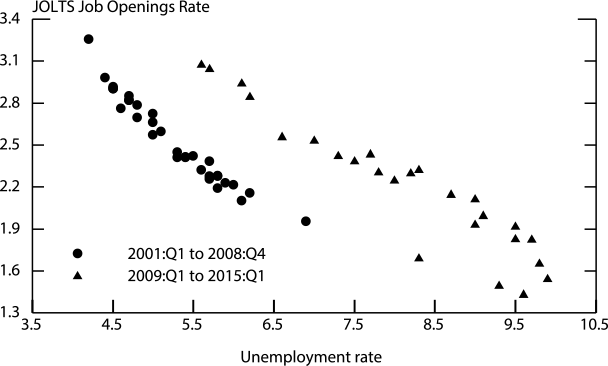 |
Note. The JOLTS Job Openings rate is shown as total nonfarm job openings divided by the labor force.
Source. Bureau of Labor Statistics.
However, the Beveridge curve, by itself, cannot identify shifts in the natural rate, as argued by Diamond and Şahin (2014) and Daly, Hobijn, Şahin, Valletta (2012), among many others. It is also necessary to know the equilibrium level of job openings, or vacancies, firms desire to post relative to the level of unemployment. Indeed, analysis that relies on shifts in the Beveridge curve alone to identify the natural rate implicitly assumes that there has been no concurrent shift in the structural, or persistent, factors determining the job creation incentives of firms.1
We argue that the recent secular decline in the labor share (shown in Figure 3) has been driven by structural factors that also tend to raise the vacancy-unemployment (V-U) ratio, and that this has, in turn, served to reduce the equilibrium unemployment rate. As shown in Figure 3, the labor share of income has moved noticeably below levels that prevailed until the early 2000s (see Elsby, Hobijn, and Şahin (2013) and Karabarbounis and Nieman (2014) for recent work on the labor share).2 Smoothing through some of the volatility in the data, the labor share has declined by roughly 6.5 percentage points since the early 2000s and now hovers around 63 percent. Through the lens of a standard labor market model, we argue that if the decline in the labor share has been driven by a reduction in worker bargaining power, the incentive for firms to post vacancies has increased and equilibrium unemployment will be lower as a result.
| Figure 3. The Labor Share |
|---|
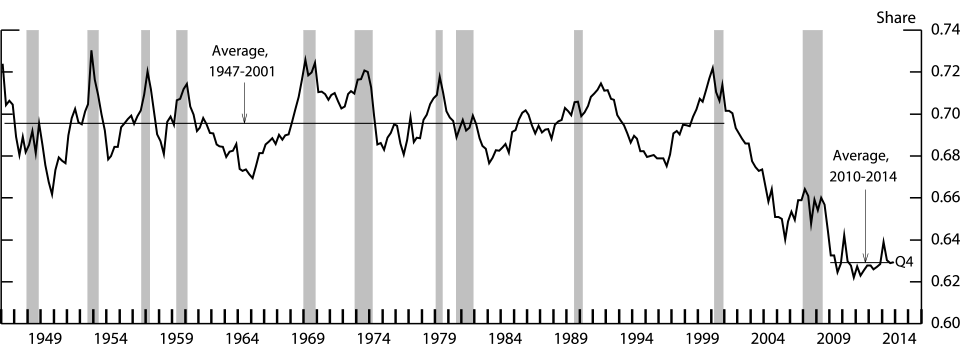 |
Note. Nonfinancial Corporate Sector. Calculated as compensation divided by gross value added less taxes on production and imports.
Source. Bureau of Economic Analysis.
In this note, we first sketch the implications of declining worker bargaining power for equilibrium V-U ratios in a standard model of unemployment. Then we exploit industry and state variation in the labor share and V-U ratios to quantify the empirical relationship. We find that the decline in the labor share is associated with increased V-U ratios which, in our model, translates into a reduction in the equilibrium unemployment rate of about two-thirds of a percentage point.
Equilibrium Unemployment in the Canonical Search Model
Below we provide a very brief sketch of the canonical Diamond-Mortensen-Pissarides search model of unemployment. Our presentation is in the spirit of Daly, Hobijn, Şahin, and Valetta (2012), and we refer readers to Chapter 1 of Pissarides (2000) for a more formal treatment. In this type of model, workers search for available jobs and firms search for available workers, but frictions such as geographic or skill mismatch, and potentially other impediments, make matching a lengthy process and generate involuntary unemployment. Once matched, firms and workers determine a wage through a bargaining process, and split the returns from the match.
Equilibrium in such a model can be easily depicted by the intersection of two curves, the Beveridge curve (BC) and the job creation curve (JC), a stylized version of which is shown in Figure 4. Given the technology governing the matching of searching workers and vacant jobs, the BC depicts the unemployment rate for any level of vacancies when flows in and out of unemployment are equalized (so-called steady-state unemployment). It is downward sloping because fewer vacancies, say during a recession, lead to lower job finding and thus higher unemployment. The intercept (or vertical position) of the Beveridge curve is determined in part by the efficiency with which unfilled jobs are matched to unemployed workers. Outward shifts in the Beveridge curve, such as the one depicted in Figure 2, have been ascribed to diminished matching efficiency, such as in Barnichon and Figura (2015).3
The equilibrium V-U rate is determined by firms' desire to post vacancies given an unemployment rate and is depicted by the JC. In equilibrium, firms choose to post vacancies up until the point that the cost of filling a job is equal to the return from a filled position. When there are more unemployed workers, all else equal, filling a vacancy becomes cheaper, and desired vacancy posting rises, resulting in the upward-sloping shape of JC. The JC can also shift over time. From the trough to the peak of the business cycle, rising growth in aggregate demand and productivity cause desired vacancies to rise and the JC to rotate counterclockwise. Other factors can also influence the position of the JC. Daly et al. (2012), for instance, highlight changes in unemployment insurance and economic uncertainty as structural factors influencing the slope of the JC.
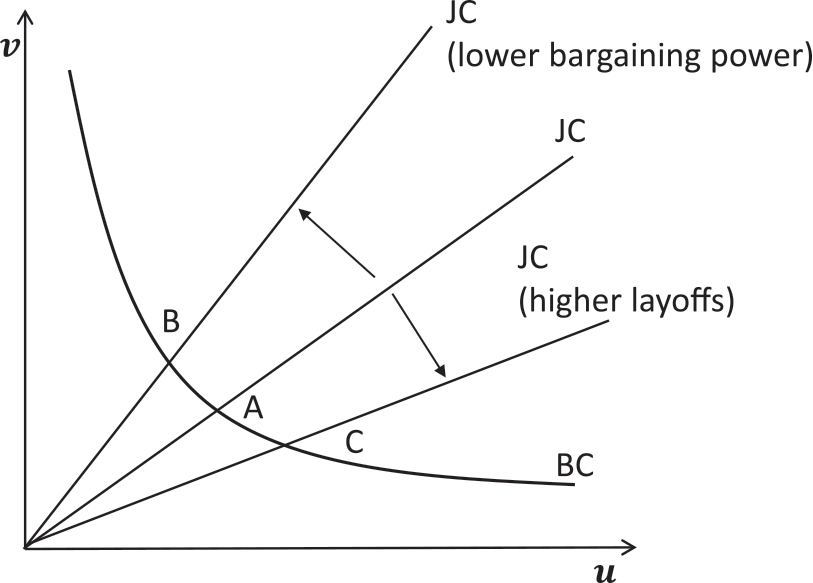
What has been largely ignored are the implications of the considerable secular decline in the labor share over the last decade for equilibrium unemployment and vacancies. These implications, of course, depend on the factor causing the decline. Certain factors, such as a decrease in worker bargaining power, would cause a lower labor share to be associated with higher firm profits and, as firms cash in on the higher returns from job creation, a higher V-U ratio. This would cause the JC to rotate counterclockwise and the equilibrium to move from point A to point B, further up the Beveridge curve, in Figure 4. Other factors, such an increased risk of job destruction or a higher discount rate applied to future profits, would cause a lower labor share to be associated with a reduced V-U ratio.4 In this case, the JC would rotate clockwise to point C.5 Our simple analysis of the canonical search model therefore suggests an empirical examination of the secular comovement in the labor share and the V-U ratio.
Empirical relationship between labor share and V-U ratio
We exploit variation across industries and states to identify the empirical relationship between the labor share and the V-U ratio.6 We first combine annual data from the NIPA accounts (from the Bureau of Economic Analysis) on the labor share together with JOLTS and CPS data (from the Bureau of Labor Statistics) on vacancies and unemployment for thirteen private-sector industries that cover the period from 2001 through 2014.7 We then estimate the relationship between the labor share and the V-U ratio in two ways. First, we simply estimate the cross-sectional relationship between the change in an industry's labor share (in percentage points) from 2001 to 2014 and the change in the industry's log V-U ratio over the same period. This estimate is given in column 1 of Table 1 and depicted in Figure 5. In column 2 of the table, we present estimates from a panel regression that includes industry and year fixed effects.
| Figure 5. Changes in Industry-level Labor Share versus Changes in V-U Ratios, 2001-2014 |
|---|
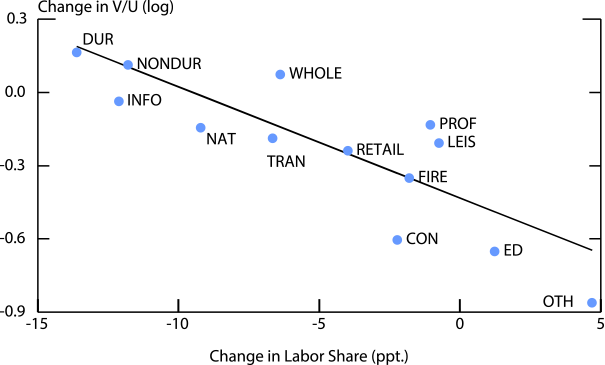 |
Source. Bureau of Labor Statistics and Bureau of Economic Analysis.
| Table 1. Estimates of the Effect of Changes in the Labor Share on V-U Ratios |
|---|
| Industry-level variation | State-level variation | |||
|---|---|---|---|---|
| Variable | (1) | (2) | (3) | (4) |
| Labor share | -.045*** | -.041*** | -.11** | -.046* |
| (0.01) | (0.009) | (0.04) | (0.024) | |
| Industry or State effects | No | Yes | No | Yes |
| Year effects | No | Yes | No | Yes |
| R2 | 0.61 | 0.1 | 0.13 | 0.12 |
| Sample Time Period | 2001-2014 | 2001-2014 | 2005-2012 | 2005-2012 |
| Number of Observations | 13 | 182 | 51 | 408 |
Note. In specifications (2) and (4) standard errors are robust and clustered by industry or state. In all regressions, observations are weighted by an industrys or states average level of unemployment over the sample.
*** Significant at 1 percent level. Return to text.
** Significant at 5 percent level. Return to text.
* Significant at the 10 percent level. Return to text.
Next, we estimate similar regressions using state-level data on the labor share and V-U ratios. Since JOLTS does not publish data at the state level, we turn to the Help-wanted Online (HWOL) data from the Conference Board, which spans all 50 states and Washington, DC from the middle of 2005 onwards.8 We combine these data with those from the BEA on output and compensation at the state level to construct the labor share from 2005 through 2012 (the last year data are available). These estimates are shown in the last two columns of Table 1. Figure 6 shows the scatter plot analogous to Figure 5, except that the time period is from 2005 to 2012.
| Figure 6. Changes in State-level Labor Share versus Change in V-U Ratios, 2005-2012 |
|---|
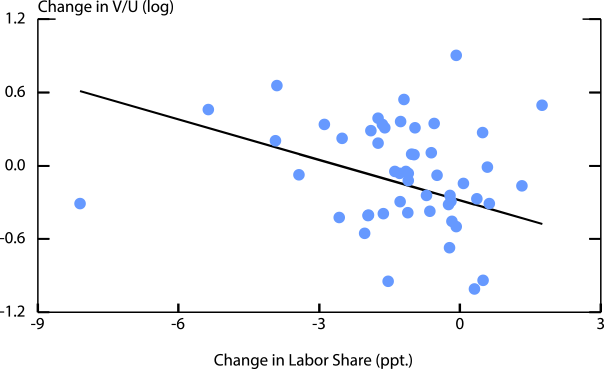 |
Source. Conference Board, Bureau of Labor Statistics and Bureau of Economic Analysis.
We find a striking negative relationship between the labor share and the V-U ratio, and one that is remarkably consistent whether we look at state or industry variation. For a one-point reduction in the share of income going to workers, the V-U ratio increases by between four to five percent.9 Altogether, our estimates suggest that a decline in the labor share of about 6.5 percentage points from the early 2000s to the present would serve to raise V-U rates by roughly 30 percent.
Going back to Figure 4, our results suggest that as the labor share has declined, the JC has rotated counterclockwise. Mapping this estimate into an effect on the unemployment rate, however, requires an estimate of the slope of the Beveridge curve. To derive an estimate, we regress log vacancies on log unemployment, allowing for a break in the intercept beginning in 2009. Our estimated coefficient suggests that a one percent increase in the V-U ratio along a BC will lead to about a one-half percent decrease in the unemployment rate. Thus, when combined with the 30% increase in the V-U ratio estimated above, we find the lower labor share would reduce the equilibrium unemployment rate by 15%, or by around two-thirds of a percentage point from an initial equilibrium unemployment rate of 5%.
As with any research, there are caveats associated with this analysis. We note two particularly important ones here. First, we do not attempt to directly identify a decline in bargaining power, but rather show a strong empirical relationship between the labor share and the V-U ratio which is theoretically consistent with such a shift. Second, we do not claim that the average worker's welfare is higher under a low labor share, low unemployment regime. Further research is needed to identify the structural shocks driving our results and their welfare implications.
Looking Ahead
What does this imply for the evolution of the natural rate of unemployment going forward? That depends crucially, of course, on the persistence of the structural forces shifting the JC and BC. Figure 7 shows the outward shift in the BC indicated by the recent data (from BC to BC') and the counterclockwise rotation in the JC suggested by our findings (from JC to JC'). Together they suggest a natural rate corresponding to point C, little different from levels of a decade ago, (represented by point A).10
| Figure 7. Evolution of Labor Market Equilibrium |
|---|
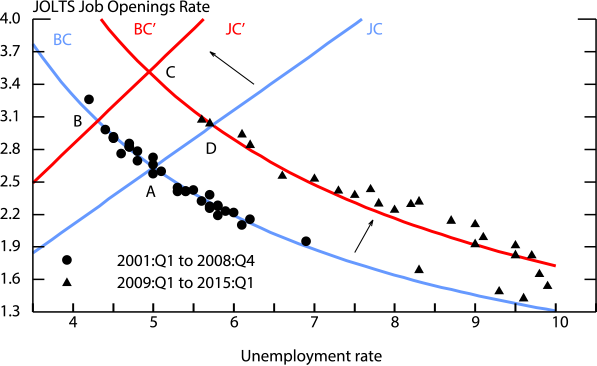 |
Note. The JOLTS Job Openings rate is shown as total nonfarm job openings divided by the labor force.
Source. Bureau of Labor Statistics.
However, some research has suggested that the outward shift in the Beveridge curve may be largely a cyclical phenomenon. In particular, researchers have identified a large component of the shift that can be attributed to a very high share of long-duration unemployed, who have lower job finding rates on average.11 The share of long-duration unemployed has moved lower over the past two years. If the labor market continues to improve and the long-duration share continues to decline, the Beveridge curve may move back to its former position. At the same time, the downward movement in the labor share has been quite persistent. Although further work is needed to identify the structural forces that have caused its decline, if declining bargaining power is responsible and persists, then the JC may remain at a persistently higher level. As a result, the economy may end up at point B with a natural rate at lower levels than prior to the recession. On the other hand, if further increases in labor demand eventually increase worker bargaining power and the labor share--bringing them back to historically normal levels--and the reduction in matching efficiency persists, the economy may end up at point D, with a natural rate above levels of a decade ago.
References
Aaronson, Daniel, Luojia Hu, Arian Seifoddini, and Daniel G. Sullivan (2015) "Changing Labor Force Composition and the Natural Rate of Unemployment." Chicago Fed Letter, Number 338.
Barnichon, Regis and Andrew Figura (2015) "Labor Market Heterogeneity and the Aggregate Matching Function," Forthcoming, AEJ Macroeconomics.
Daly, Mary, Bart Hobijn, Aysegul Şahin, and Robert Valletta (2012) "A Search and Matching Approach to Labor Markets: Did the Natural Rate of Unemployment Rise?" Journal of Economic Perspectives, vol. 26, no. 3, pp. 3-26.
Diamond, Peter A (2013) "Cyclical Unemployment, Structural Unemployment." IMF Economic Review 61(3): 410-455.
Elsby, Michael, Bart Hobijn, and Aysegul Şahin (2013) "The Decline of the U.S. Labor Share," Brookings Papers on Economic Activity, no. 2, pp. 1-63.
Elsby, Michael, Ryan Michaels, and David Ratner (2015) "The Beveridge Curve: A Survey," Forthcoming, Journal of Economic Literature.
Karabarbounis, Loukas and Brent Neiman (2014) "The Global Decline of the Labor Share," Quarterly Journal of Economics, vol. 129, no. 1 pp. 61-103.
Krueger, Alan B., Judd Cramer, and David Cho (2014) "Are the Long-Term Unemployed on the Margins of the Labor Market?" Brookings Papers on Economic Activity, Spring 2014.
Kroft, Kory, Fabian Lange, Matthew J. Notowidigdo, and Lawrence F. Katz (2014) "Long-Term Unemployment and the Great Recession: The Role of Composition, Duration Dependence, and Non-Participation," Forthcoming, Journal of Labor Economics.
Pissarides, Christopher (2000) Equilibrium Unemployment Theory, MIT Press.
1. Other factors, such as demographics, have important effects on the natural rate of unemployment as well. See Aaronson et al. (2015) on adjusting the natural rate for shifts in the composition of the labor force. Return to text
2. In theory, a measure of the labor share for the private business sector might seem the most appropriate for our analysis. However, problems with measuring the labor share at this level of aggregation lead us to prefer a slightly narrower measure, see Elsby, Hobijn, and Şahin (2013). Moreover, the decline in the non-farm business sector labor share over the same period is roughly the same as shown in Figure 3. Return to text
3. For a more detailed discussion of the Beveridge curve, see Blanchard and Diamond (1989), Diamond (2013), and Elsby, Michaels, and Ratner (2015) Return to text
4. We should note that we do not find previous research on the fall in the labor share to be inconsistent with a reduction in worker bargaining power. Elsby, Hobijn and Şahin (2013) report evidence that increased international trade (and, to a lesser extent, decreased union power) may have played a role in reducing the labor share. Karabarbounis and Nieman (2014) argue that the substitution of capital for labor in the production process is behind a substantial fraction of the decline in the labor share. However, it is possible that the threat of cheaper foreign products and/or more capital intensive production processes have decreased worker bargaining power with employers. See the discussion section of Elsby, Hobijn, and Şahin (2013). Return to text
5. For simplicity, we ignore the shift in the Beveridge curve associated with a rise in layoffs. A rise in layoffs would also shift out the Beveridge curve since, for a given unemployment rate, more vacancies would be needed to offset the rise in inflows into unemployment. Return to text
6. Note that we are not claiming to identify the causal effect of bargaining power on the V-U ratio. Instead, our estimates encompass many shocks that drive both variables. This may lead our estimated coefficient on the labor share to either understate or overstate the causal effect of bargaining power on the V-U ratio. It certainly may be the case that there are factors other than bargaining power that we have not controlled for and that exaggerate the negative relationship between the labor share and the V-U ratio beyond that implied by changes in bargaining power. On the other hand, to the extent that we are not fully controlling for cyclical shocks, these would likely impart a positive correlation between V-U ratios and the labor share, and so we would be underestimating the negative relationship due to a change in bargaining power. Return to text
7. The time span is determined by the availability of annual JOLTS data, which begin in 2001. We use annual frequency data as those are available from the BEA for the longest period of time. Since we are interested in longer-run secular movements in the labor share, higher frequency data would not necessarily be advantageous. The industries we can match (as closely as possible) across the three sources of data are: natural resources and mining, construction, durable goods manufacturing, nondurable goods manufacturing, wholesale trade, retail trade, transportation and utilities, information services, financial and real estate services, professional and business services, education and health services, leisure and hospitality services, and other services (excluding government). Return to text
8. HWOL data begin in May, 2005. We use the seasonally-adjusted data provided by the Conference Board and average over the partial year of data for 2005. For 2006 onwards, we use the average of the seasonally-adjusted data over the full year. Return to text
9. To be conservative, we don't use the estimated coefficient from the state-level regression in changes (column 3) which may be driven by the choice of endpoints. Whereas the industry-level estimates are robust to different choices of endpoints, the state-level data series are too short to check their robustness. Return to text
10. We estimate the Beveridge curves by fitting a regression of log vacancies on log unemployment (both as fractions of the labor force) from 2001q1 to 2008q4. We then allow the intercept to shift beginning in 2009q1, but constrain the slope to be the same as in the first time period. JC corresponds to an early-2000s assumed equilibrium unemployment rate of 5 percent, with an associated V-U ratio of 0.53. JC' is the job creation ray with a 30 percent higher V-U ratio as estimated from our state and industry regressions.
11. For more on long-term unemployment and the Beveridge curve see Barnichon and Figura (2015) and Elsby, Michaels and Ratner (2015), Kroft, Lange, Notowidigo, and Katz (2014), and Krueger, Cramer, and Cho (2014). Return to text
Please cite as:
Figura, Andrew, and David Ratner (2015). "The Labor Share of Income and Equilibrium Unemployment," FEDS Notes. Washington: Board of Governors of the Federal Reserve System, June 08, 2015. https://doi.org/10.17016/2380-7172.1553
Disclaimer: FEDS Notes are articles in which Board economists offer their own views and present analysis on a range of topics in economics and finance. These articles are shorter and less technically oriented than FEDS Working Papers.
