
FEDS Notes
 Print
PrintAugust 28, 2015
Off-Balance Sheet Items of Depository Institutions in the Enhanced Financial Accounts
Ralf R. Meisenzahl 1
The Enhanced Financial Accounts initiative is an ambitious, long-term effort to augment the Financial Accounts of the United States with a more detailed picture of financial intermediation in the United States (see Gallin and Smith, and Smith, 2015). This Note describes one initial project to provide more detailed information on the holdings and activities of depository institutions (referred to here for simplicity as "banks").2
One important limitation of the Financial Accounts is the lack of information on off-balance sheet items. For example, contingent assets and liabilities are not typically reported on balance sheets, under standard accounting principles. Nonetheless, such items may expose institutions such as banks to credit risk, market risk, liquidity risk, or counterparty risk, which is not reflected on the sector's balance sheets in the Financial Accounts. To provide a more comprehensive picture of the activities and potential risks facing the banking sector, we now provide, as part of the Enhanced Financial Accounts initiative, additional information on selected off-balance sheet items reported on bank Call Reports, including unused loan commitments, letters of credit, and derivatives.3 We are providing a supplementary table, showing off-balance-sheet items for consolidated operations of U.S. chartered depository institutions (analogous to the balance sheet of consolidated U.S. chartered depository institutions table).4 The remainder of this Note briefly discusses the new information contained in this table.
Unused Commitments
Providing liquidity on demand to households and businesses is one key function of banks.5 In addition to taking deposits and making loans, banks often extend lines of credit to consumers and firms, which can be drawn upon as needed. The undrawn portion of these lines are referred to as unused commitments, and are not reported on banks' balance sheets in the Financial Accounts, because they are contingent in nature (i.e., they may or may not actually result in debtor obligations or creditor assets). When borrowers draw on their lines of credit, the unused commitment converts into a loan, and is reported as an asset on the bank's balance sheet. A common example is a credit card account--the difference between the current balance on the account and its credit limit represents an unused commitment on the part of the issuing bank.
From a financial stability perspective, developments in unused commitments are informative about credit supply and demand and potential liquidity pressures faced by banks. For instance, financial conduits drew on their back-up lines of credit with banks when the asset-backed commercial paper market came under pressure in the second half of 2007 (Acharya, Schnabl, and Suarez, 2013). Similarly, nonfinancial firms drew on their bank lines of credit during the 2007-2009 financial crisis (Ivashina and Scharfstein, 2010; Berrospide and Meisenzahl, 2015). Partly as a result of these draws on credit lines, commercial and industrial (C&I) loans on bank balance sheets continued to grow during the financial crisis, even as economic activity and new loan originations slowed sharply. In other words, the C&I loan growth during the financial crisis was at least in part driven by the conversion of off-balance sheet commitments into on-balance sheet loans (Cohen-Cole et al., 2008). From the banks' perspective, such conversion could be viewed as the materialization of off-balance sheet liquidity and credit risk.
Figure 1 shows the evolution of total unused commitments extended by banks (the black line, illustrating line 1 on the table) and total on-balance sheet assets of banks (the red line). Total on-balance-sheet assets grew from $3 trillion in 1990 to about $15.5 trillion in 2014. Unused commitments grew considerably faster, from about $1 trillion in 1990 to $9 trillion at the eve of the financial crisis. During the financial crisis, unused commitments dropped significantly, as some credit lines were drawn upon and others (especially credit card limits) were cut. In recent years, they have begun to grow again, but remain below their pre-crisis level, currently standing at about $6.5 trillion.
| Figure 1: Total Assets and Total Unused Commitments1 |
|---|
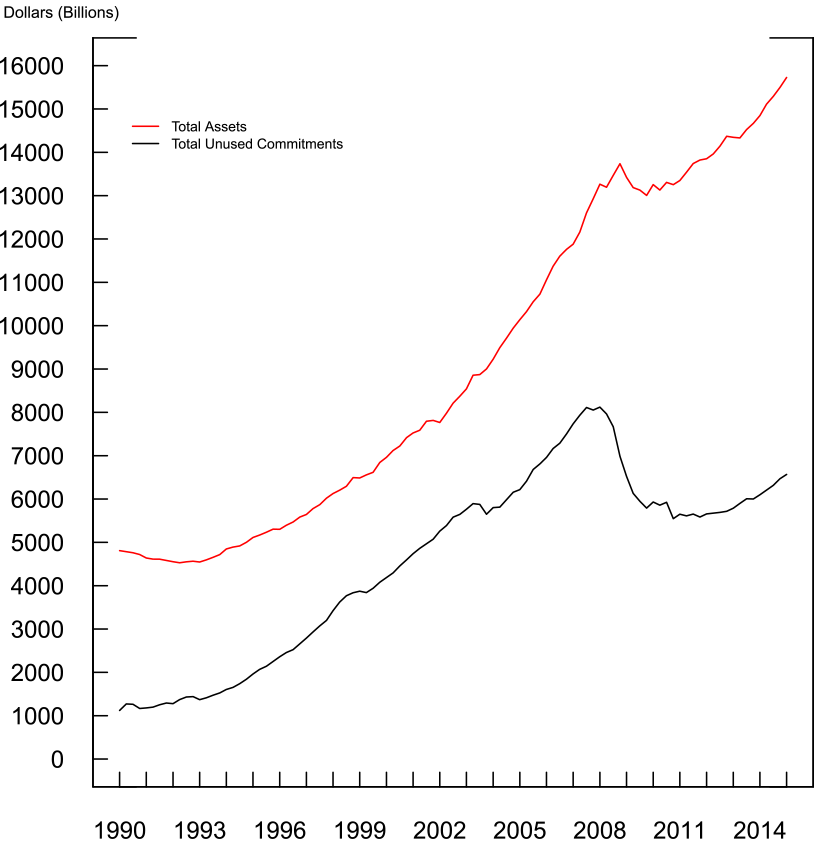 |
1. Total assets are taken from Depository Institutions: Consolidated Balance Sheet. Total unused commitments are taken from Depository Institutions: Off-Balance-Sheet Items. Return to text.
Source: Call Reports.
Figure 2 shows the composition of unused commitments (illustrating lines 2-5 on the table). About half of unused commitments are credit card lines (the black line), which account for most of the rapid growth in total unused commitments through 2007. In the wake of the financial crisis, unused credit card commitments dropped by $1.5 trillion, mostly as a result of banks cutting credit cards limits, though, in the past couple of years, they began to rise again.6
Revolving open-end credit lines secured by 1-4 family residential property (also known as home equity lines of credit), the blue line, and construction loans commitments, the green line, together account for 10 percent of unused commitments. Unused commitments for construction loans dropped sharply during the recession but have recovered to near their pre-crisis levels, while unused commitments on home equity lines of credit have continued to decline since the financial crisis, though at a slowing rate.
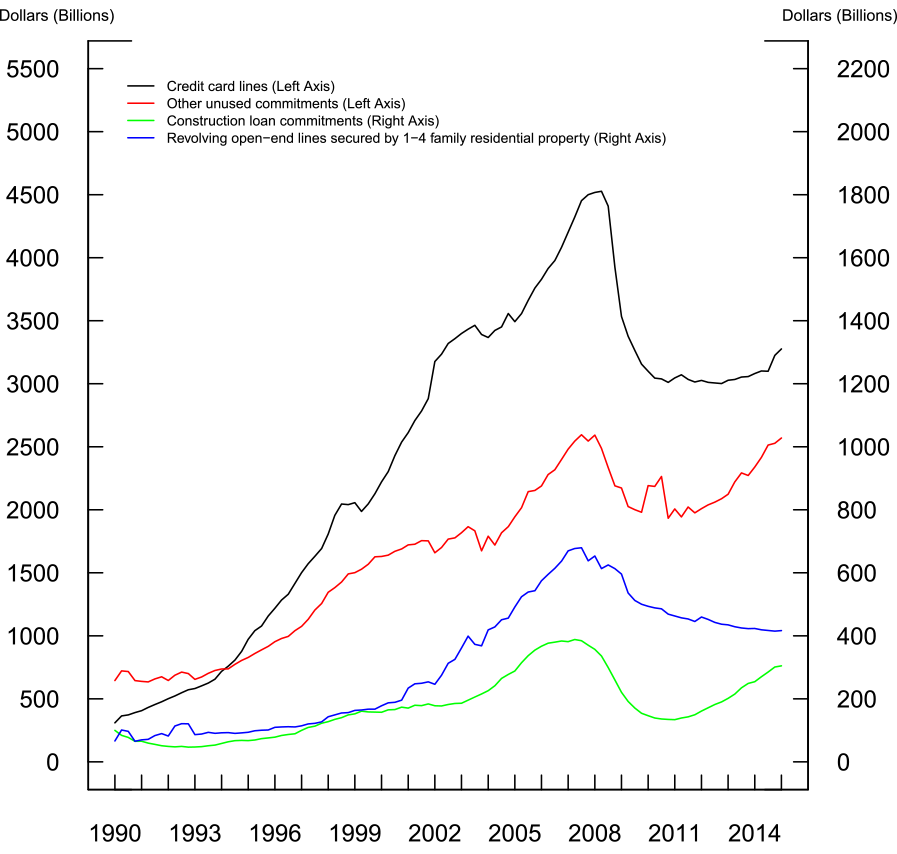
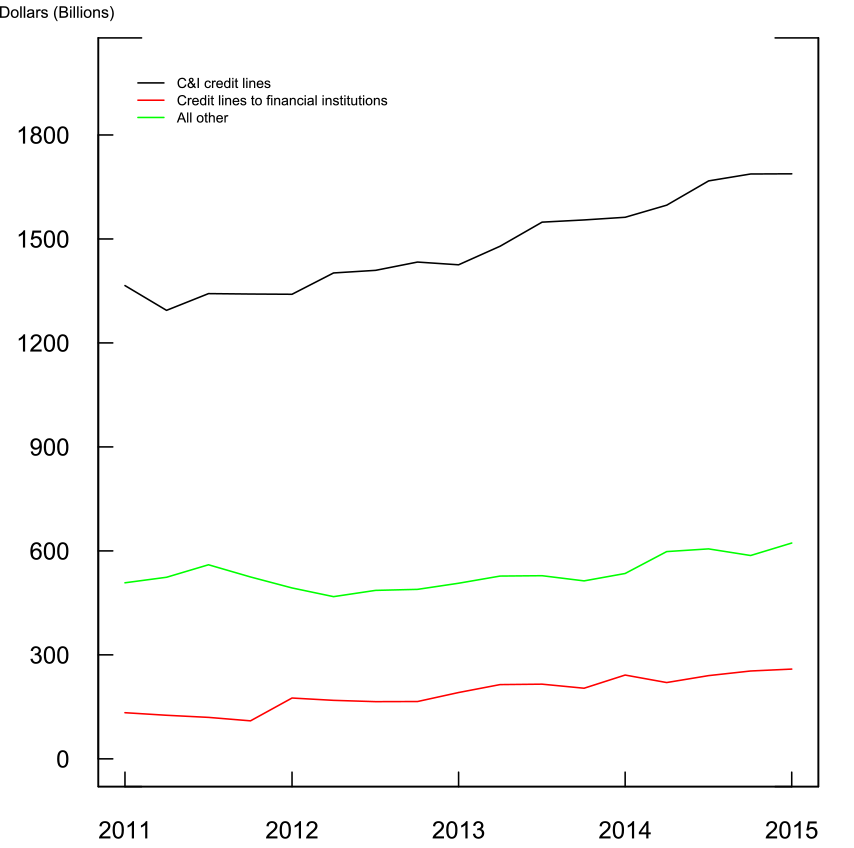
Other unused commitments (the red line), including those to financial and non-financial firms, account for about 40 percent of all unused commitments. They fell sharply during the crisis, mostly likely because of drawdowns from financial and non-financial firms (Acharya, Schnabl, and Suarez (2013), Berrospide and Meisenzahl (2015)), but have recently recovered to near their pre-crisis levels. In recent years, more detailed data on these commitments have become available (shown in lines 6-8 on the table). As shown in Figure 3, the largest component of these unused commitments are commercial and industrial (C&I) credit lines (i.e., credit lines to non-financial firms), which currently stand at about $1.7 trillion, or about 25 percent of total unused commitments.
Letters of Credit
Lines 9 through 11 of the table report letters of credit, which are another contingent item excluded from banks' balance sheets (prior to realization). Letters of credit are provided by banks to intermediate transactions when buyers and sellers are operating in different legal or financial environments and require more formal guarantees of payment, such as in international trade or guarantees for a bank's foreign offices. The bank's letter of credit guarantees payment to the seller as long as agreed-upon delivery conditions have been met; i.e., if the good or service is provided and the buyer is unable to pay as agreed, the bank will make the payment on behalf of the buyer. Financial standby letters of credit and foreign office guarantees increased from about $100 billion in 1990 to $700 billion in 2014. Other letters of credit remain stable at about $100 billion over the last 25 years.
Derivatives
The third major category of banks' off-balance sheet items reported in the Enhanced Financial Accounts is derivatives. Banks may enter into derivative contracts to sell protection to counterparties seeking to hedge their (or take speculative positions in) credit risk, interest rate risk, or exchange rate risk. At the same time, banks may also enter into derivative contracts to buy protection, for instance to hedge their own respective exposures. The Enhanced Financial Accounts provide aggregate banking sector positions on credit derivatives (lines 12-21 and 34-41), interest rate derivatives (lines 22-27), and other derivatives (including foreign exchange derivatives, lines 28-33), as an indicator of the extent to which the banking sector as a whole alters its exposure to specific types of risk through the use of off-balance-sheet derivatives.
Banks buy and sell protection against credit default almost exclusively through credit default swaps (CDS, shown on lines 13 and 18), which work as follows: in exchange for a payment, the seller of a CDS promises to pay the buyer of the CDS a "notional amount" in the event of a credit default by a borrower known as the "reference entity"--that is, a CDS can be used to transfer the risk of default by the reference entity from the buyer of the CDS to the seller of the CDS. CDS contracts are written, for example, on many types of bonds, including sovereign debt and corporate bonds, and can hedge a bondholder's risk by making payments in the event that the bond defaults and can allow investors to gain synthetic exposure credit risk. However, because the notional amount of protection bought need not correspond to a CDS buyer's actual exposure to the credit risk, the aggregate value of notional amounts bought and sold in CDS contracts can far exceed the aggregate value of the underlying credit.
Figure 4 shows the total notional value of CDS bought (the red line) and sold (the black line) by the banking sector, as reported on Call Reports.7 As a whole, the banking sector has entered into CDS contracts buying and selling protection of nearly equal amounts in terms of notional value, with protection bought marginally exceeding protection sold.8 With the overall demand for credit protection increasing during the financial crisis, banks bought and sold large notional CDS amounts, peaking at over $8 trillion in 2008.9 As the crisis subsided, CDS contracts were settled and the total notional amounts of banks' CDS positions have declined significantly in recent years.
| Figure 4: Credit Derivatives Positions - Notional Value |
|---|
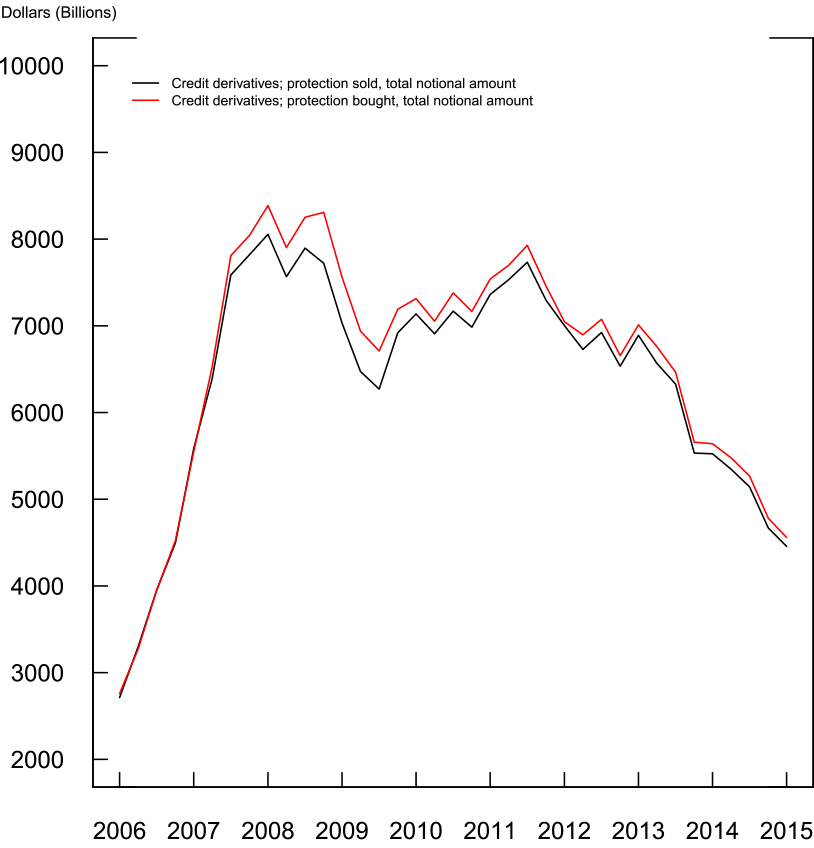 |
Note: We drop ICE Trust US LLC as this entity was a clearinghouse for CDS transactions.
Source: Call Reports.
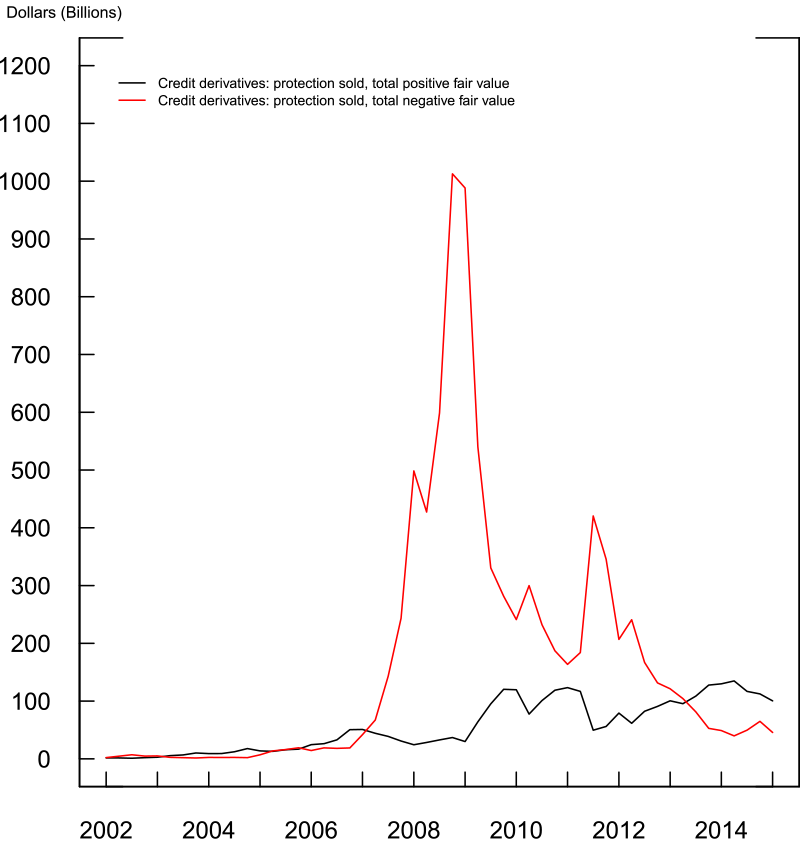
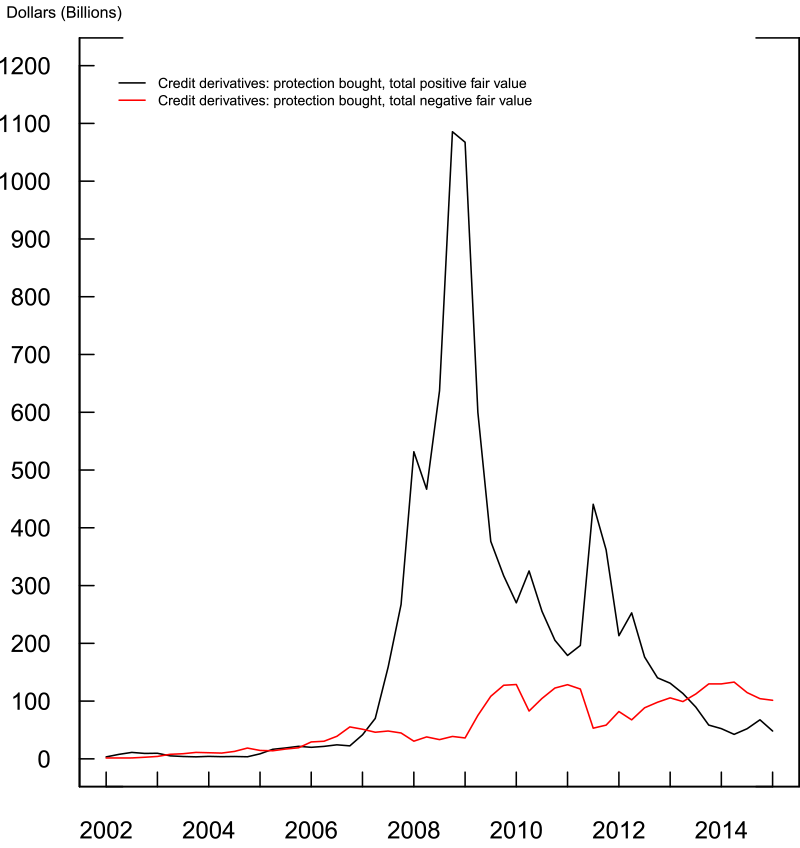
To better understand the risk exposure from credit derivatives, Figure 5, upper panel, shows the aggregate fair value of CDS---that is, the market price of CDS---sold by the banking sector and Figure 5, lower panel, shows the aggregate fair value of CDS bought by the banking sector. The lower panel looks almost exactly like the upper panel, suggesting that the banking sector as a whole appeared to have taken offsetting positions in CDS trades. As a result, the net fair value of all credit derivatives positions held by the banking sector was only $10.9 billion in 2014:Q4. The relatively low net fair value indicates that the banking sector engages only in limited aggregate credit transfer through the CDS market.
In addition to credit derivatives, banks hold a significant number of interest rate derivatives, mostly interest rate swaps (lines 22-25). In most cases, these derivatives exchange fixed payments for floating payments that are tied to a benchmark interest rate, such as the LIBOR, on the notional amount. In contrast to CDS, the notional amount of these derivatives is only used to calculate payments but will never be paid. The key reason for banks to hold these derivatives is that banks intermediate funds across maturities by borrowing short-term and extending long-term loans. This engagement in maturity transformation exposes banks to interest rate risk.10 Hence, banks may hedge this exposure through the use of interest rate derivatives.
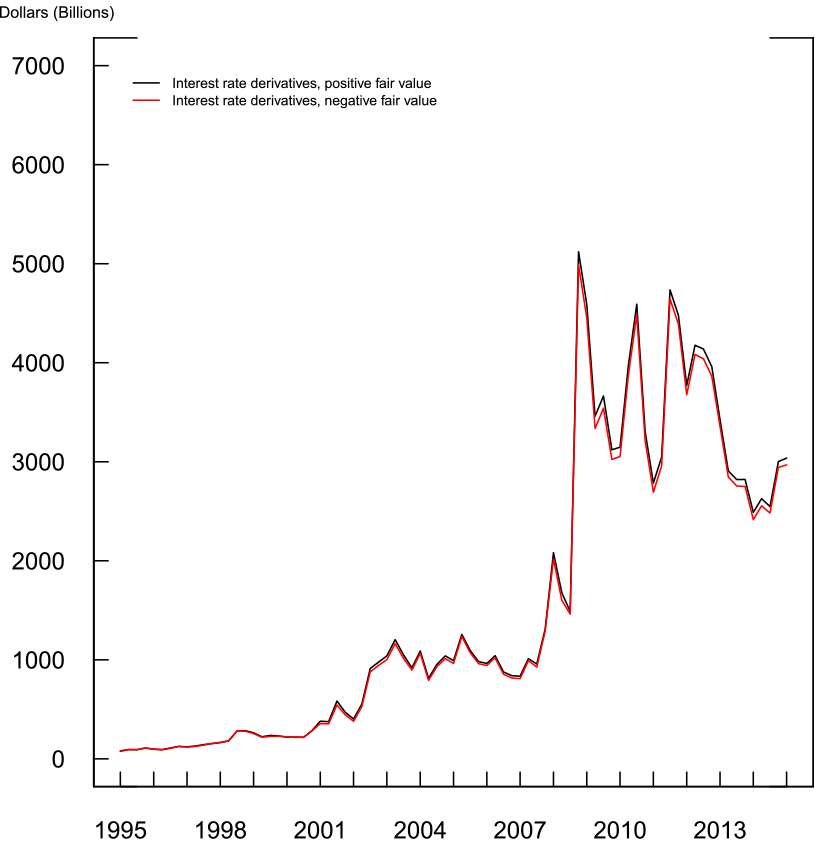
Figure 6 shows the total positive and negative fair value of interest rate derivatives held by the banking sector (lines 26-27). The fair values of interest rate derivatives exhibited a sharp increase during the financial crisis and have remained at elevated levels. However, the total positive fair value (the black line) and the total negative fair value (the red line) have moved together, reflecting the fact that the net fair value of all interest derivatives positions held by the banking sector (i.e., the difference between the black and red lines) has remained relatively small (less than $100 billion in almost all quarters). This relatively small net fair value is likely due in part to the concentration of interest rate derivatives in dealer banks, which typically try to match their exposures with offsetting positions.11
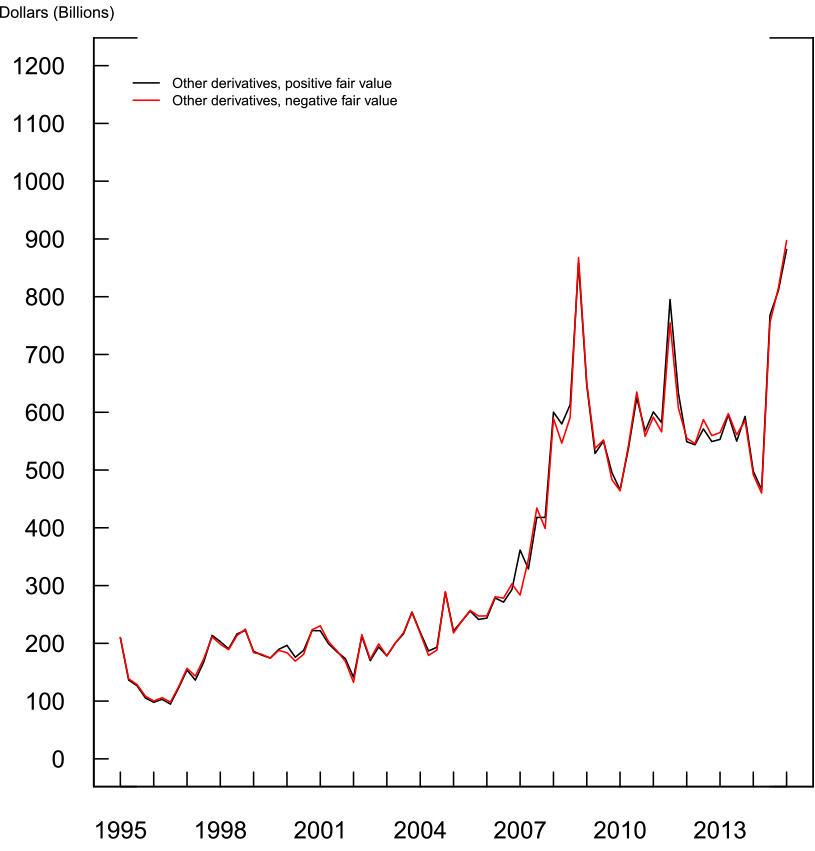
Banks also hold other derivatives, including foreign exchange derivatives. Figure 7 shows the total positive and negative fair value of other derivatives held by the banking sector. As in the case of interest rate derivatives, the total positive fair value and the total negative fair value move together. The net fair value of all other derivatives positions held by the banking sector was less than $15 billion in almost all quarters.
Conclusion
In keeping with the mission of the Enhanced Financial Accounts initiative, the information provided here on the aggregate value of banks' off-balance-sheet activities, including unused commitments, letters of credit, and derivatives, sheds additional light on banks' activities and exposures, and how these have changed over time. Future EFA projects will endeavor to further enrich the Financial Accounts by providing additional detail and insight into the holdings, activities, and exposures of this and other sectors, with a goal of allowing new perspectives on the interrelationships and financial-stability implications of major institutions in the U.S. economy and financial system.
References:
Acharya, Viral V., Philipp Schnabl, and Gustavo Suarez (2013). "Securitization without Risk Transfer," Journal of Financial Economics, vol. 107, no. 3, pp. 515-536.
Begenau, Juliane, Monika Piazzesi, and Martin Schneider (2014). "Remapping the Flow of Funds," in Brunnermeier, Markus and Arvind Krishnamurthy eds., Risk Topology: Systemic Risk and Macro Modeling. Chicago: University of Chicago Press: pp. 57-64.
Begenau, Juliane, Monika Piazzesi, and Martin Schneider (2015). "Banks' Risk Exposures," NBER working paper #21334.
Berrospide, Jose M., and Ralf R. Meisenzahl (2015). "The Real Effects of Credit Line Drawdowns," Finance and Economics Discussion Series 2015-007. Board of Governors of the Federal Reserve System (U.S.).
Campbell, Sean D., and Joshua Gallin (2014). "Risk Transfer Across Economic Sectors using Credit Default Swaps," FEDS Notes 2014-09-03. Board of Governors of the Federal Reserve System (U.S.).
Cohen-Cole, Ethan, Burcu Duygan-Bump, Jose Fillat, and Judit Montoriol-Garriga (2008). "Looking Behind the Aggregates: A Reply to "Facts and Myths about the Financial Crisis of 2008"," Quantitative Analysis Unit Series Paper QAU08-5. Federal Reserve Bank Boston.
Eichner, Matthew J., Donald L. Kohn, and Michael G. Palumbo (2010). "Financial Statistics for the United States and the Crisis: What did they Get Right, what did they Miss, and how should they Change?" Finance and Economics Discussion Series 2010-20. Board of Governors of the Federal Reserve System (U.S.).
English, William B., Skander J. Van den Heuvel, and Egon Zakrajsek (2012). "Interest Rate Risk and Bank Equity Valuations," Finance and Economics Discussion Series 2012-26. Board of Governors of the Federal Reserve System (U.S.).
Gallin, Joshua and Paul Smith (2014). "Enhanced Financial Accounts," FEDS Notes 2014-08-01. Board of Governors of the Federal Reserve System (U.S.).
Ivashina, Victoria and David Scharfstein (2010)."Bank Lending during the Financial Crisis of 2008." Journal of Financial Economics, vol. 97, no. 3, 319-338.
Kashyap, Anil K., Raghuram Rajan, and Jeremy C. Stein (2002). "Bank as Liquidity Providers: An Explanation for the Co-Existence of Lending and Deposit-Taking." Journal of Finance, vol. 57, no. 1, pp. 33-73.
1. I would like to thank Joshua Gallin, Michael Palumbo, Maria Perozek and Paul Smith for helpful comments. Vincent La provided excellent research assistance. Return to text
2. The banking sectors in the Financial Accounts include U.S. chartered depository institutions (reported on table L.111 and including commercial banks, savings banks, savings and loans, and international banking facilities), foreign banking offices in the U.S.(table L.112), banks in U.S.-affiliated areas (table L.113), and credit unions (table L.114). Table L.110 combines all of these sectors into one, called Private Depository Institutions. Return to text
3. The provision of this information is a first step toward providing the more detailed data on instruments, transactional forms, and potential payment streams of the banking sector suggested by authors such as Eichner, Kohn, and Palumbo (2010) and Begenau, Piazzesi, and Schneider (2014). Return to text
4. The consolidated tables include operations of U.S. depository institutions outside the U.S., which are not included in the traditional Financial Accounts. A separate EFA project provides consolidated versions of the five banking-sector tables in the Financial Accounts. Return to text
5. See Kashyap, Rajan, and Stein (2002). Return to text
6. Aggregate credit card loans to individuals on bank balance sheets changed little over the same time period. Return to text
7. The Financial Accounts net intrasectoral flows. Here, netting intersectoral flows in not feasible and hence CDS amounts reports here are the gross total notional values. Return to text
8. The Enhanced Financial Accounts also provides data on the maturity of CDS and credit quality of the reference entities, on lines 34-41 of the table. For a broader overview of the CDS market, see Campbell and Gallin (2014). Return to text
9. The calculations drop ICE Trust US LLC. While filing a Call Report as commercial bank, ICE Trust US LLC's main business is derivative clearing, and ICE Trust US LLC does not take deposits. Return to text
10. For a more detailed discussion, see English, van den Heuvel, and Zakrajsek (2012) and Begenau, Piazzesi, and Schneider (2013). Return to text
11. English, van den Heuvel, and Zakrajsek (2012) document that within publicly traded banks only the largest banks have significant interest rate derivative positions. Return to text
Please cite as:
Meisenzahl, Ralf (2015). "Off-Balance Sheet Items of Depository Institutions in the Enhanced Financial Accounts," FEDS Notes. Washington: Board of Governors of the Federal Reserve System, August 28, 2015. https://doi.org/10.17016/2380-7172.1579
Disclaimer: FEDS Notes are articles in which Board economists offer their own views and present analysis on a range of topics in economics and finance. These articles are shorter and less technically oriented than FEDS Working Papers.
