
FEDS Notes
 Print
PrintDecember 16, 2016
Import Penetration and Domestic Innovation: A View into Dynamic Gains from Trade
Maria D. Tito 1
How large are the welfare gains from international trade? Empirical studies have generally focused on the impact of trade liberalizations on the level of income and have consistently found that those types of gains--also known as static gains--are generally small; for example, using an extensive methodology, Costinot and Rodriguez-Clare (2013) quantify gains ranging from 1.8 percent to 8.3 percent for the United States. The literature, however, has generally abstracted from the effect of trade on growth--i.e., dynamic gains--as they are much more difficult to identify and to measure.2
If the aggregate dynamic effects remain somewhat elusive, empirical studies have made some progress on specific channels. In particular, empirical evidence suggests that trade flows might fuel innovation, a fundamental engine of growth. While earlier work studied the effect of imports on inputs to innovation, such as expenditures on research and development, more recent contributions have shifted their focus to patents, which can be considered output measures of technology.3 The shift reflects the attractive qualities of patent data, such as the availability of information on the year in which the innovation occurs, the geographic distribution of inventors, and the technology class.
Among the most recent contributions, Bloom et al. (2016) show that Chinese import competition led to increased technical change within firms in 12 European countries and reallocated employment toward more technologically advanced firms. Their results, however, are in contrast with Autor et al.'s (2016) finding that, accounting for trends in chemicals and computers, fiercer import competition from China depressed innovation activity in U.S. firms.
In this paper, we revisit the link between innovation activity, measured by the number of patent applications, and import flows. We use the U.S. Patent and Inventor Database described in Li et al. (2014), which covers patents granted by the U.S. Patent and Trademark Office between 1975 and 2010.4 We match the U.S. patent database with data on import flows and tariffs using the concordance between technology classes and four-digit SIC sectors built by Silverman (2002). This concordance links U.S. patents to the SICs where the patents are likely to provide value.5 Figure 1 compares the total number of patents that have a primary U.S. inventor in the original data with those applications matched to the SIC concordance. The two series track each other accurately and reflect aggregate patterns in line with what is shown by Autor et al. (2016): the number of applications, after remaining roughly steady through the 1980s, rapidly increased in the 1990s before moving down somewhat in the early 2000s. We truncate our sample in 2003 because of concerns of data censoring, as the patent database is backfilled after patents are approved.6
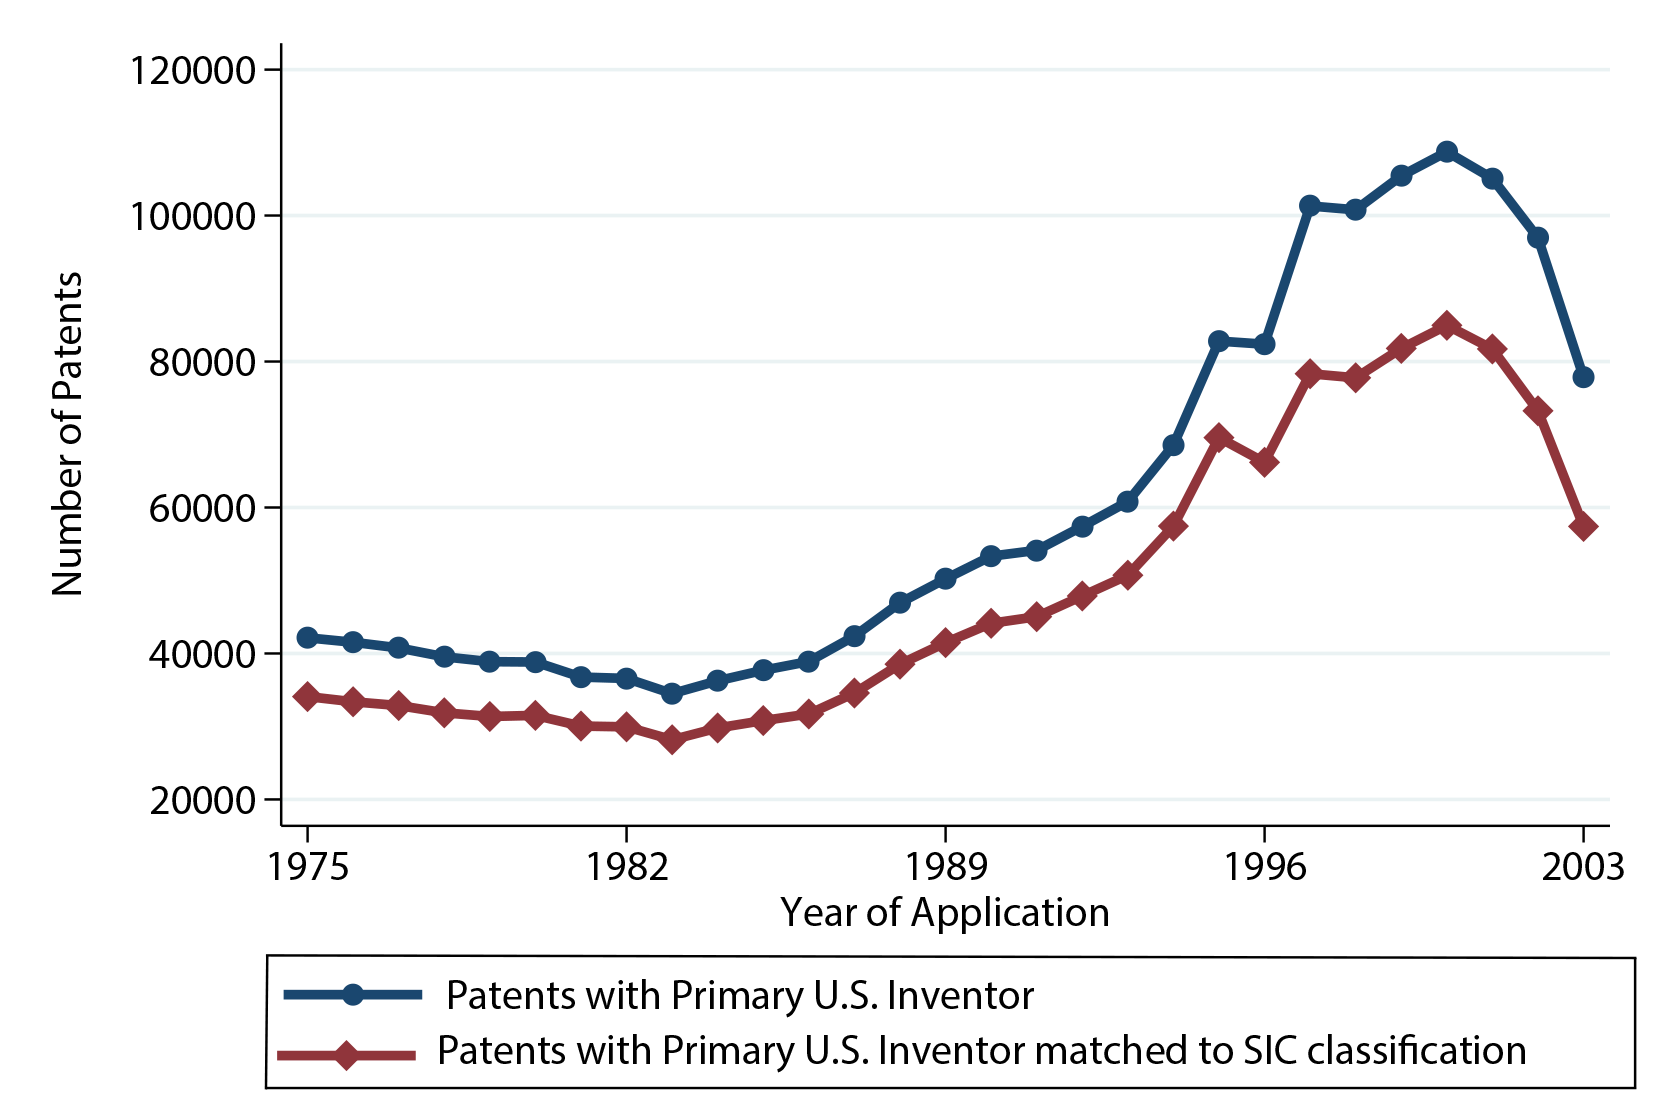
Table 1 illustrates the distribution of patents across sectors. We compare patent shares across sectors between 1991 and 2003: Electronic equipment, machinery, and chemicals were the top three sectors in terms of patent applications in both years, accounting for about 50 percent of all patents in manufacturing. While the aggregate number of applications increased between 1991 and 2003, the rise was disproportionately larger for electronic equipment, mostly capturing the information technology revolution. Our sectorial decomposition is qualitatively similar to that in Autor et al. (2016); the differences mostly reflect our reliance on the Silverman (2002) concordance, which, built from patent assignments between 1990 and 1993, is likely to downplay the role of patents in technologies related to the internet boom.
| 1991 | 2003 | |
|---|---|---|
| Food | 5.57% | 4.73% |
| Tobacco | 0.42% | 0.23% |
| Textile Mill | 2.56% | 1.99% |
| Apparel | 1.87% | 1.35% |
| Wood | 1.87% | 1.36% |
| Furniture | 1.64% | 1.26% |
| Paper | 3.32% | 2.45% |
| Printing | 2.09% | 1.77% |
| Chemicals | 11.40% | 9.79% |
| Petroleum | 1.84% | 1.18% |
| Rubber | 4.12% | 3.09% |
| Leather | 0.96% | 0.74% |
| Stone, Clay, Glass | 4.72% | 3.55% |
| Primary Metal | 4.10% | 3.20% |
| Fabricated Metal | 6.85% | 6.22% |
| Machinery | 13.04% | 13.72% |
| Electronic Eq. | 18.52% | 26.70% |
| Transportation Eq. | 4.93% | 4.47% |
| Precision Instr. | 7.03% | 9.29% |
| Miscellaneous | 3.15% | 2.93% |
Source: Author's calculation using Li et al. (2014) and Silverman (2002) data
Note: Distribution of patents across two-digit SIC industries, 1991 and 2003.
The rapid increase in patent applications during the 1990s is accompanied by sustained import growth. Figure 2 summarizes the degree of U.S. import penetration by its top three partners, Canada, Mexico, and China. Looking at either measures based on import tariffs or measures based on trade flows, import penetration increased between 1991 and 2003.7 Although Chinese imports boomed during the period of analysis, following large tariffs declines during the 1990s and early 2000s, import flows from Canada and Mexico also increased before flattening out toward the end of our sample.
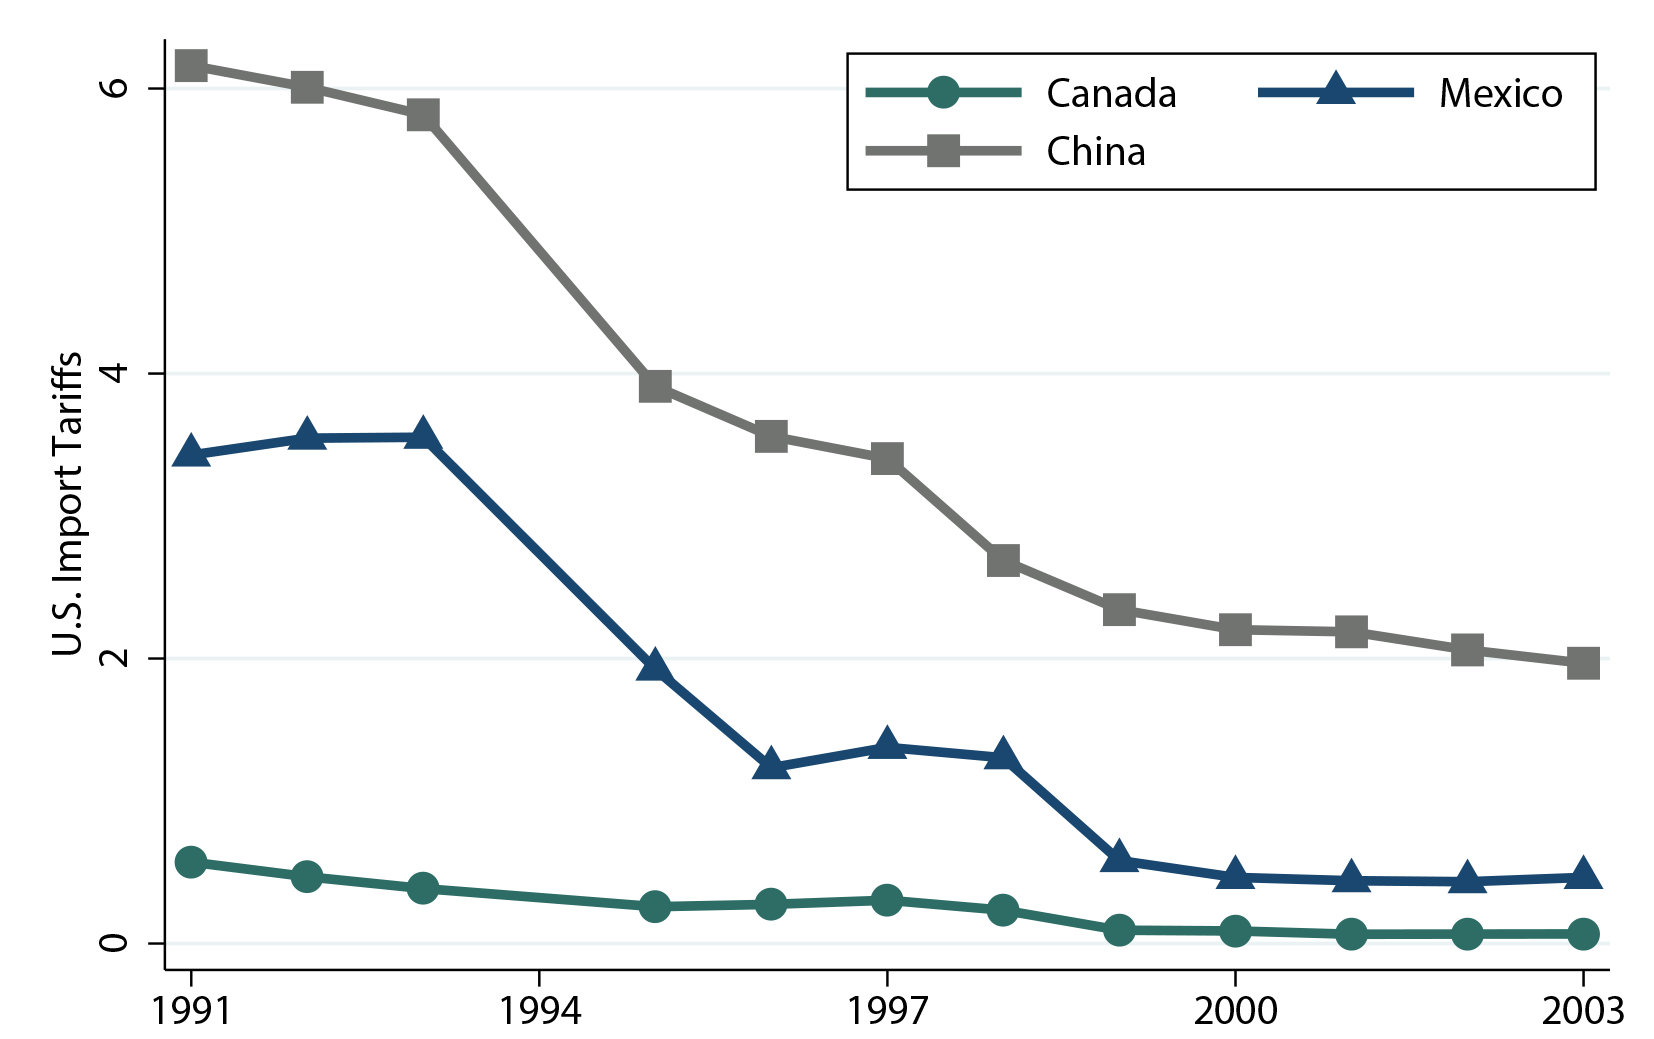 Source: UNCTAD TRAINS database. Note: Tarriffs are weighted by import flows. |
|
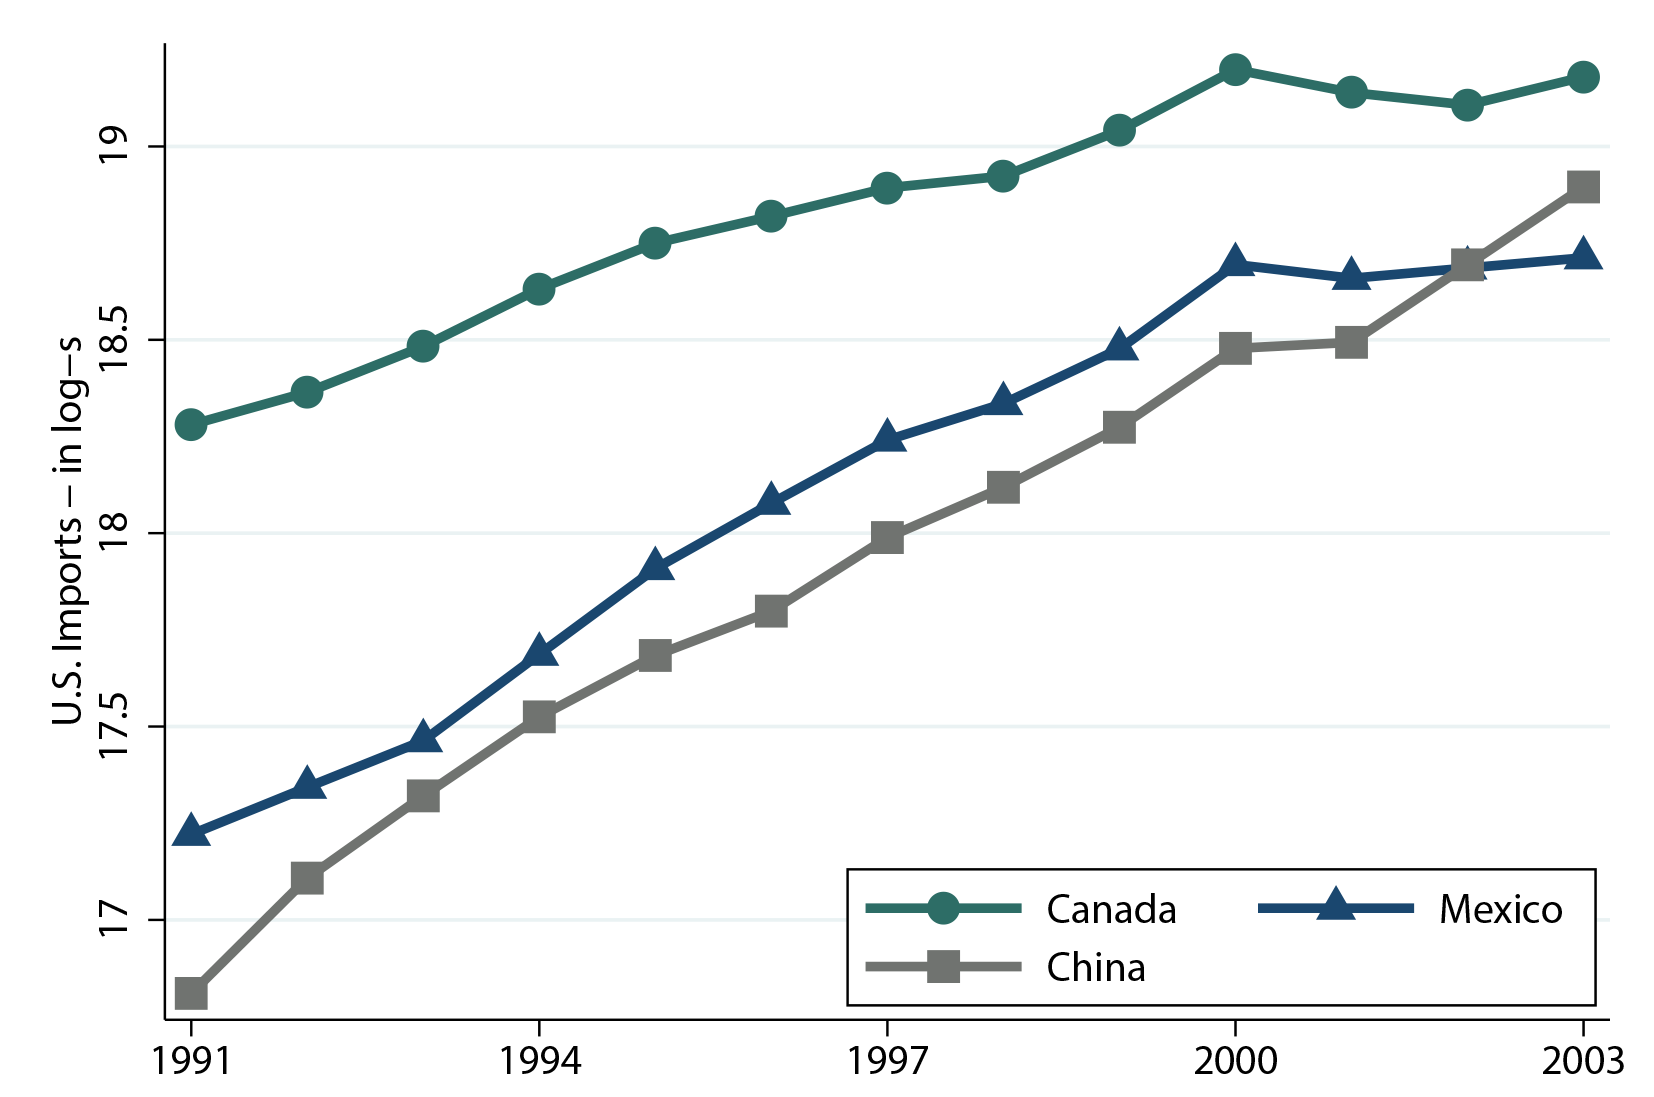 Source: Author's calculation based on Schott (2008). |
|
While previous research focused on the effects of import competition from China, our paper highlights the impact of trade flows from the three major U.S. import partners on innovation to isolate effects of different origins. Our baseline model relates patent applications to measures of import penetration for each partner,
where s denotes the sector of use based on the Silverman (2002) concordance and t denotes the year of application. We use both tariffs and import flows as measures of import penetration. Those measures, however, are likely correlated with firms' patenting location choice or are inversely affected by the existing distribution of patents across countries. To address these concerns, we analyze the effect of lagged tariff rates, and we instrument import flows with non-U.S. imports.
| Variables | (1) | (2) | (3) | (4) |
|---|---|---|---|---|
| ln Patentst | ||||
| Canadian Import Tariffstt-1 | 0.557** (0.270) |
0.730** (0.343) |
||
| Mexican Import Tariffst-1 | 0.036 (0.149) |
0.022 (0.259) |
||
| Chinese Import Tariffst-1 | -0.394** (0.190) |
-0.619*** (0.224) |
||
| Sector | y | y | y | y |
| Year | y | y | y | y |
| Obs. | 4,541 | 4,541 | 4,541 | 4,541 |
| R2 | 0.988 | 0.988 | 0.988 | 0.988 |
Legend : *** significant at 1%, ** at 5%, * at 10%.
Notes: Sector-level regressions, 1991–2003. Standard errors are clustered at the four-digit SIC level.
Table 2 summarizes the effects of past import tariffs on the current number of patent applications. A negative coefficient indicates that lower tariffs spur innovation through a larger number of patent applications. This result applies to Chinese import tariffs, whereas the coefficients for Mexican and Canadian import tariffs are both positive, with higher tariffs only on Canadian goods to be significantly associated with greater technological change. All specifications include sector fixed effects and time dummies to capture the effects of sector-specific time-invariant characteristics and of macroeconomic shocks common to all partners in a particular year.
Lagged tariffs, however, may not fully control for serially correlated unobservables that influence both the path of U.S. import tariffs and the number of patent applications. Our second strategy aims at overcoming such concerns and provides further evidence on the relationship between trade flows and innovation. In particular, we instrument U.S. import flows from each of the partner countries with the non-U.S. imports from the same country. Our instrument captures global demand shocks for products in a particular sector and is, therefore, less likely to be correlated with the decision to submit patent applications in the United States or to be affected by reverse causation.
Table 3 reports the results of our second strategy. Our first-stage F-statistics suggest that weak instruments are not a threat to our identification. While the coefficients on import flows from Canada and Mexico tend to be positive in individual regressions, they switch sign in the specification that includes all partners' imports. The coefficient on Chinese imports, instead, remains positive and significant across all specifications. In particular, raising imports from China by one standard deviation, which corresponds to an increase in Chinese imports of about $20,000, is associated with an expansion in patent applications by 1.35 patents, or 35 percent of a standard deviation.8
Our findings suggest that the rapid rise of Chinese imports contributed to making the United States a champion of technological innovation. Thinking of possible mechanisms, Bloom et al. (2016) offer two main explanations of how deeper import penetration translates into a within-sector increase in the number of patents. On the one hand, firms might respond to increased Chinese import competition with innovation, i.e., a within-firm response. On the other hand, import shocks might induce a reallocation of resources toward the more technologically advanced firms, indirectly boosting resource allocation to innovation activity.
| Variables | (1) | (2) | (3) | (4) |
|---|---|---|---|---|
| ln Patentst | ||||
| ln Imports from Canada | 0.045 (0.039) |
-0.007 (0.066) |
||
| ln Imports from Mexico | 0.021 (0.018) |
-0.027 (0.044) |
||
| ln Imports from China | 0.088*** (0.017) |
0.100*** (0.022) |
||
| Sector | y | y | y | y |
| Year | y | y | y | y |
| Obs. | 4,610 | 4,610 | 4,610 | 4,610 |
| R2 | 0.705 | 0.723 | 0.58 | 0.527 |
| First-Stage F-stat1 | 43.5 | 32 | 63.4 | 22.24 |
| Number of SIC-year | 407 | 407 | 407 | 407 |
1 F-statistics of excluded instruments. Return to table.
Legend : *** significant at 1%, ** at 5%, * at 10%.
Notes: Sector-level regressions, 1991–2003. Standard errors are clustered at the four-digit SIC level.
Relying on patent data, however, has the drawback of capturing only innovations with sufficient market potential to be patented; our estimates, therefore, are likely to represent a lower bound of the true relationship between innovation and trade flows. With this caveat in mind, we will map our estimates into their implied contribution to growth. Endogenous growth models suggest that an increase in the number of patent applications per dollar spent on research translates into a boost to growth. More precisely, in the expanding variety model, an increase in patents of 15 percent--the part of the recent boom in applications explained by increased openness--is consistent with 5 percent higher growth; this calculation excludes trade effects via different channels.9 Our results, thus, suggest that raising barriers to trade tends to hinder economic growth by slowing down innovation.
References
Autor, David, David Dorn, Gordon H Hanson, Gary Pisano, and Pian Shu (2016). "Foreign Competition and Domestic Innovation: Evidence from U.S. Patents."
Bloom, Nicholas, Mirko Draca, and John Van Reenen (2016). "Trade-induced technical change? The impact of Chinese imports on innovation, IT, and productivity," The Review of Economic Studies, 83(1): 87–117.
Costinot, Arnaud, and Andres Rodriguez-Clare (1995). "Trade Theory with Numbers: Quantifying the Consequences of Globalization," NBER, 18896.
Frankel, Jeffrey A, and David Romer (1999). "Does Trade cause Growth?" American Economic Review, 89(3): 379–399.
Keller, Wolfgang (2004). "International Technology Diffusion," Journal of Economic Literature, 42(3): 752–782.
Li, Guan-Cheng, Ronald Lai, Alexander D'Amour, David M Doolin, Ye Sun, Vetle I Torvik, Z Yu Amy, and Lee Fleming (2014). "Disambiguation and Co-Authorship Networks of the U.S. Patent Inventor Database (1975–2010)," Research Policy, 43(6): 941–955. Data are available at http://dvn.iq.harvard.edu/dvn/dv/patent.
Pierce, Justin, and Peter Schott (2009). ‘‘A Concordance Between Ten-Digit U.S. Harmonized System Codes and SIC/NAICS Product Classes and Industries,'' NBER, 14837.
Schott, Peter (2008). ‘‘The Relative Sophistication of Chinese Exports,'' Economic Policy, 23(53): 5-49.
Silverman, Brian (2002). ‘‘International Patent Classification--US SIC Concordance,'' available at http://www.rotman.utoronto.ca/~silverman/ipcsic/ipcsicfiles.ZIP
Silverman, Brian. Technological Resources and the Logic of Corporate Diversification. Routledge, 2003.
1. We thank Travis Adams, James Calello, and Morgan Smith for excellent research assistance. We also would like to thank Norm Morin for the useful insights and comments. The views expressed in this paper are those of the author and do not necessarily coincide with those of the Board of Governors or the Federal Reserve System. Return to text
2. A notable exception is the seminal work of Frankel and Romer (1999), which documents that the geographic content of trade raises income per capita by spurring capital accumulation and by boosting productivity; the effects, however, are not estimated with great precision. Return to text
3. See Keller (2004) for a review of the literature. Return to text
4. Autor et al. (2016) use a version of the same database updated through 2013. Return to text
5. The concordance relies on the primary SIC of use assigned by Canadian Patent Examiners for patent applications between 1990 and 1993. See Silverman (2003) for more details. Return to text
6. The 99th percentile of patents in our sample is approved in seven years. Return to text
7. Tariffs measures are from the UNCTAD TRAINS database while import data are from Schott (2008). We use the HS-SIC concordance built by Pierce and Schott (2009). Return to text
8. The standard deviation of is 2.98; imports are in thousands of dollars.
9. Our estimates are based on a relative risk aversion coefficient equal to 2, a labor share of 2/3, and a unit mass of consumers. Schumpeterian models would provide equivalent results if the increase in the quality of innovation, a difficult parameter to calibrate, was about 70 percent. Return to text
Please cite as:
Tito, Maria (2016). "Import Penetration and Domestic Innovation: A View into Dynamic Gains from Trade," FEDS Notes. Washington: Board of Governors of the Federal Reserve System, December 16, 2016, https://doi.org/10.17016/2380-7172.1892.
Disclaimer: FEDS Notes are articles in which Board economists offer their own views and present analysis on a range of topics in economics and finance. These articles are shorter and less technically oriented than FEDS Working Papers.
