
FEDS Notes
 Print
PrintNovember 28, 2016
The Neutral Rate and the Summary of Economic Projections
Michelle Bongard and Benjamin K. Johannsen
1. Introduction
Since March 2014, the Federal Open Market Committee (FOMC) has indicated in its postmeeting statement that it expects the federal funds to remain below its longer-run normal level for some time.1 This note uses information provided in the quarterly Summary of Economic Projections (SEP) of FOMC meeting participants to extract estimates of the neutral federal funds rate--defined as the value of the federal funds rate that is "neither expansionary nor contractionary if the economy were operating near its potential"--in the short and longer run.2 We show that these estimates are consistent with an implicit assessment that the neutral rate is currently lower than its longer-run normal level and likely to remain so for some time.
2. The neutral rate in the longer run
The SEP includes projections of the federal funds rate in the longer run. Insofar as the economy is expected to be operating at its potential in the longer run, these projections can be interpreted as projections for the longer-run value of the neutral federal funds rate.3
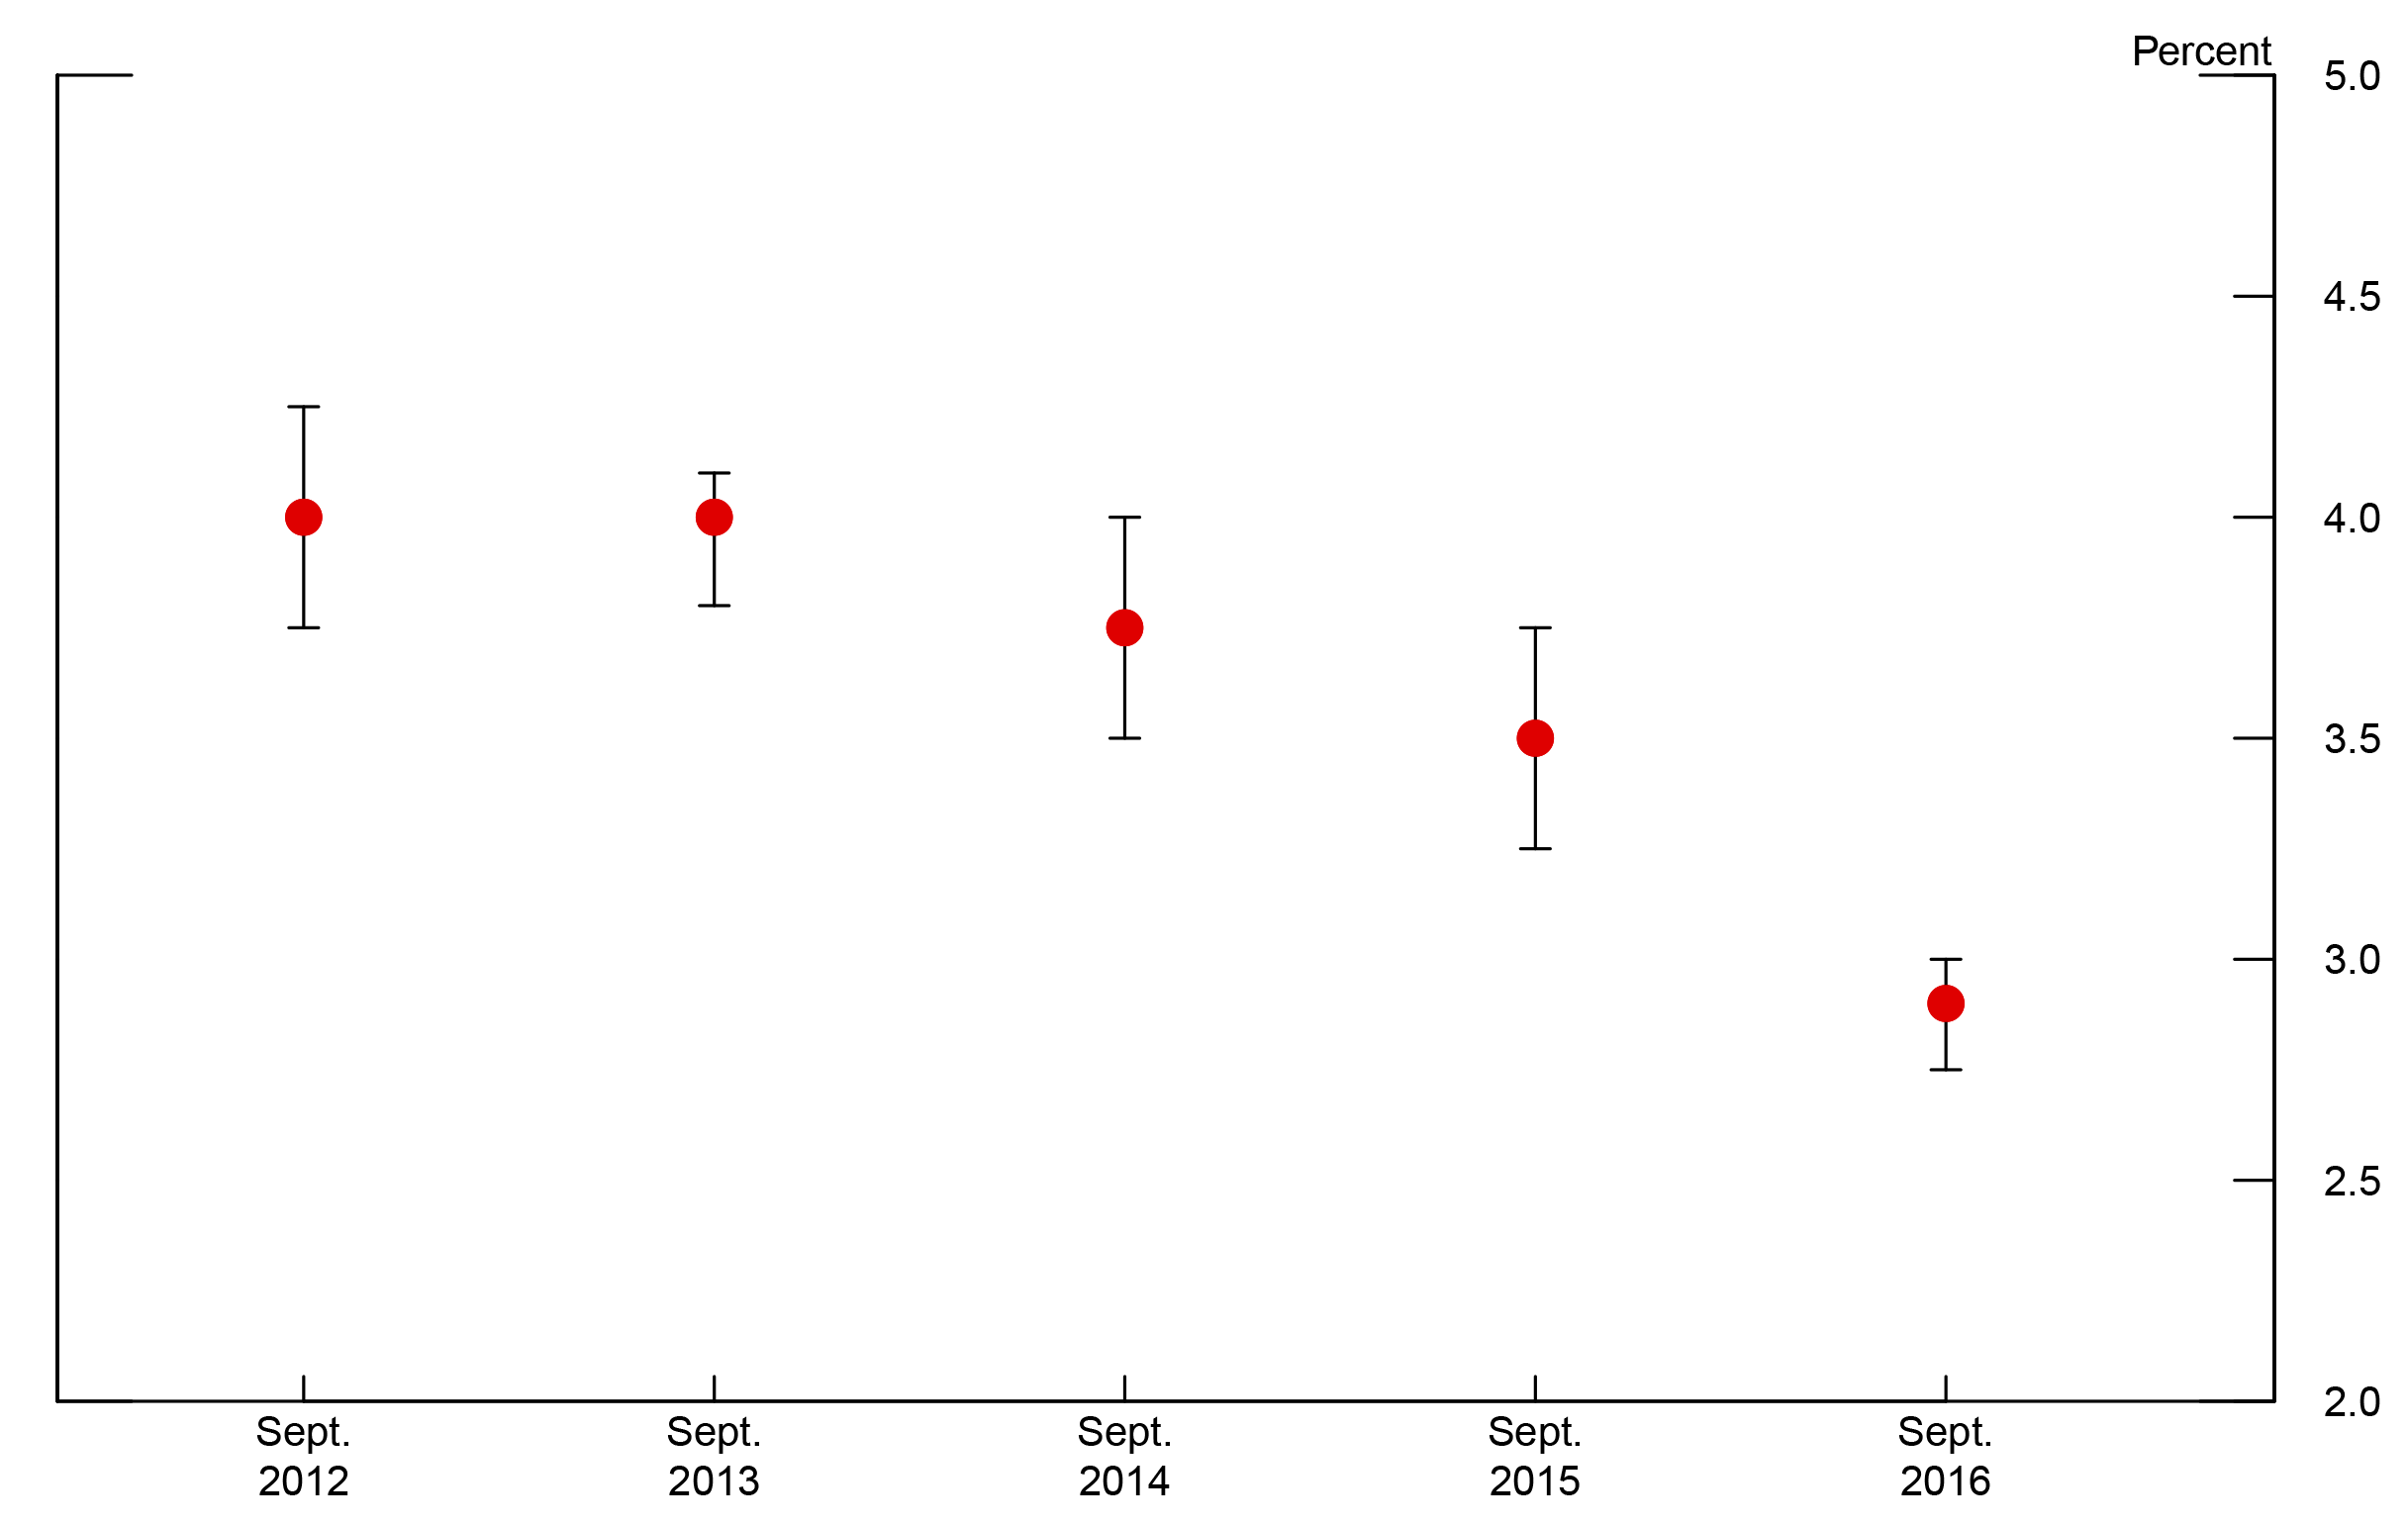
Figure 1 shows the median and central tendency--defined as the interval containing all but the highest and lowest three projections--of the longer-run federal funds rate projections. Notably, the median and central tendency have declined by more than one percentage point in recent years compared to the 2012 outlook. By contrast, longer-term projections of inflation have remained steady at 2 percent since 2012, indicating that median expectations about the longer-term neutral real (that is, inflation-adjusted) federal funds rate have fallen by the same amount as the median projections of the longer-term nominal federal funds rate.
 |
|
Sources: The SEP is an addendum to the FOMC meeting minutes; data taken from SEPs in September 2012, 2013, 2014, 2015, 2016.
3. Neutral rate estimates at shorter horizons
In the SEP, FOMC participants report their individual assessments of appropriate monetary policy. Comparing these assessments for the policy path with the longer-run neutral nominal federal funds rate does not necessarily reveal the level of accommodation that participants judge to be appropriate at a given time because factors weighing persistently on economic activity and inflation can reduce the neutral policy rate over shorter horizons. That said, given some assumptions about underlying economic relationships, it is possible to back out rough estimates of the neutral rate over shorter horizons. These estimates of the short-run neutral rate can be compared to the policy rate assessments in the SEP to gain understanding about the projected stance of monetary policy.
The SEP includes projections for the unemployment rate, inflation, and the nominal federal funds rate. Projections for the unemployment rate are for the fourth quarter of a given year, whereas projections for the nominal federal funds rate are for the end of a given year. Projections for headline and core inflation are for the Q4-over-Q4 rate of increase of the corresponding deflator of personal consumption expenditures (PCE).
To compute implied values for the short-run neutral real federal funds rate, we begin by assuming a simple relationship between unemployment and real interest rates that allows us to match unknown future values of these variables with SEP projections.4 In particular, we model the unemployment rate gap, defined as the deviation of the unemployment rate from its longer-run normal value and denoted $$ {\tilde{u}}_t$$ , as being determined by its own lagged value and the difference between the lagged real federal funds rate, denoted rt-1, and its neutral level, denoted $$ r^*_{t-1}$$ , so that
The innovation term, $$ \varepsilon_t$$ , captures events at time t that were not predictable in earlier periods. The variable $$ r^*_{t-1}$$ captures the notion of the neutral real rate, in the sense that if $$ r_{t-1}=r^*_{t-1}$$ , then interest rates are neither expansionary nor contractionary if the unemployment rate gap is already closed and $$ \varepsilon_t=0$$.
In the context of this simple model, the gap between the real interest rate and the neutral real rate represents the stance of monetary policy. A value of $$ r_{t-1} < r^*_{t-1}$$ corresponds to an accommodative monetary policy because, in this case, interest rates help push down unemployment relative to its longer-run normal rate. Alternatively, $$ r_{t-1} > r^*_{t-1}$$ represents restrictive monetary policy because interest rates push the unemployment rate up relative to its longer-run normal rate. We rearrange equation (1) and take expectations to get an expression for the gap between projected real interest rates and the projected neutral real rate as a function of future values of the unemployment rate gap,
Here $$ E_t\left\{x_{t+h}\right\}$$ denotes expectations formed at date t of $$ x_{t+h}$$ . We have deleted the variable $$ E_t\left\{\varepsilon_{t+1+h}\right\}$$ in equation (2) because we assumed that $$ \varepsilon_{t+1+h}$$ represents events that cannot be forecast in earlier periods, and thus has an expected value of zero. Thus, with projections of the unemployment rate gap, along with coefficient values for $$\alpha$$ and $$\beta$$ , equation (2) indicates whether the projected path of real interest rates is above or below the implied neutral real rate.
To obtain estimates of $$ \alpha$$ and $$ \beta$$ , we use quarterly historical data on the unemployment rate, real interest rates, and estimates of the neutral real federal funds rate. We use the unemployment rate less the Congressional Budget Office's long-term estimate of the natural rate of unemployment to construct a historical measure of $$ {\tilde{u}}_t$$ .5 Although our data are quarterly, we construct $$ {\tilde{u}}_t$$ and $$ {\tilde{u}}_{t-1}$$ to be one year apart so that we can match our estimates to data available in the SEP. To construct $$ r_{t-1},$$ we use the quarterly average of the effective nominal federal funds rate and subtract expected inflation over the next year (using expected inflation from the Survey of Professional Forecasters).6
The neutral real federal funds rate, $$ r^*_{t-1}$$ , is unobserved. However, several studies have attempted to estimate its value. In particular, Laubach and Williams (2003) and Johannsen and Mertens (2016a) offer estimates that are conceptually similar to $$ r^*_{t-1}$$ .7 Table 1 shows ordinary-least-squares estimates of $$ \alpha$$ and $$ \beta$$ when we use either the one-sided or two-sided filtered estimates of $$ r^*_{t-1}$$ from these studies, along with standard errors. Notably, our point estimates of the parameters $$ \alpha$$ and $$ \beta$$ are similar no matter which of the studies we use as a source for a historical series of the neutral real interest rate and are similar to the parameter estimates reported in Laubach and Williams (2003). Point estimates for $$ \alpha$$ are relatively large, indicating that the unemployment rate tends to approach its natural rate relatively slowly. Point estimates for $$ \beta$$ are relatively small, indicating that the effects of interest rate deviations from the neutral rate have modest effects on the contemporaneous unemployment rate gap. We proceed by assuming that $$ \alpha=0.86$$ and $$ \beta=0.14$$ .
| α | β | |
|---|---|---|
| Johannsen-Mertens, 1-sided | 0.85 (0.10) |
0.13 (0.07) |
| Johannsen-Mertens, 2-sided | 0.84 (0.09) |
0.13 (0.07) |
| Laubach-Williams, 1-sided | 0.86 (0.08) |
0.12 (0.07) |
| Laubach-Williams, 2-sided | 0.88 (0.09) |
0.17 (0.06) |
Note: Authors' calculations. The data used for estimation are quarterly. We use ordinary-least-squares to estimate $$ \alpha$$ and $$ \beta$$ . Numbers in parentheses are standard errors as in Newey and West (1987) that use a Bartlett kernel with 12 lags. Note that the standard errors reported here do not control for the fact that estimates of the neutral rate are generated regressors and thus might understate the uncertainty surrounding the parameter estimates. See footnotes 5, 6, and 7 for data sources. The sample period is 1975 through 2015.
While Laubach and Williams (2003) and Johannsen and Mertens (2016a) offer historical estimates of the neutral rate, it is interesting to examine estimates of the future evolution of $$r^*_t$$ using projections in the SEP. To this end, we utilize SEP projections of the unemployment rate, the nominal federal funds rate, and core PCE price inflation to back out an implied neutral real rate, and thus the implied stance of policy. We take each year's September SEP, starting in 2012, as different vintages of data; each September SEP contains projections for the current calendar year as well as for three subsequent calendar years.
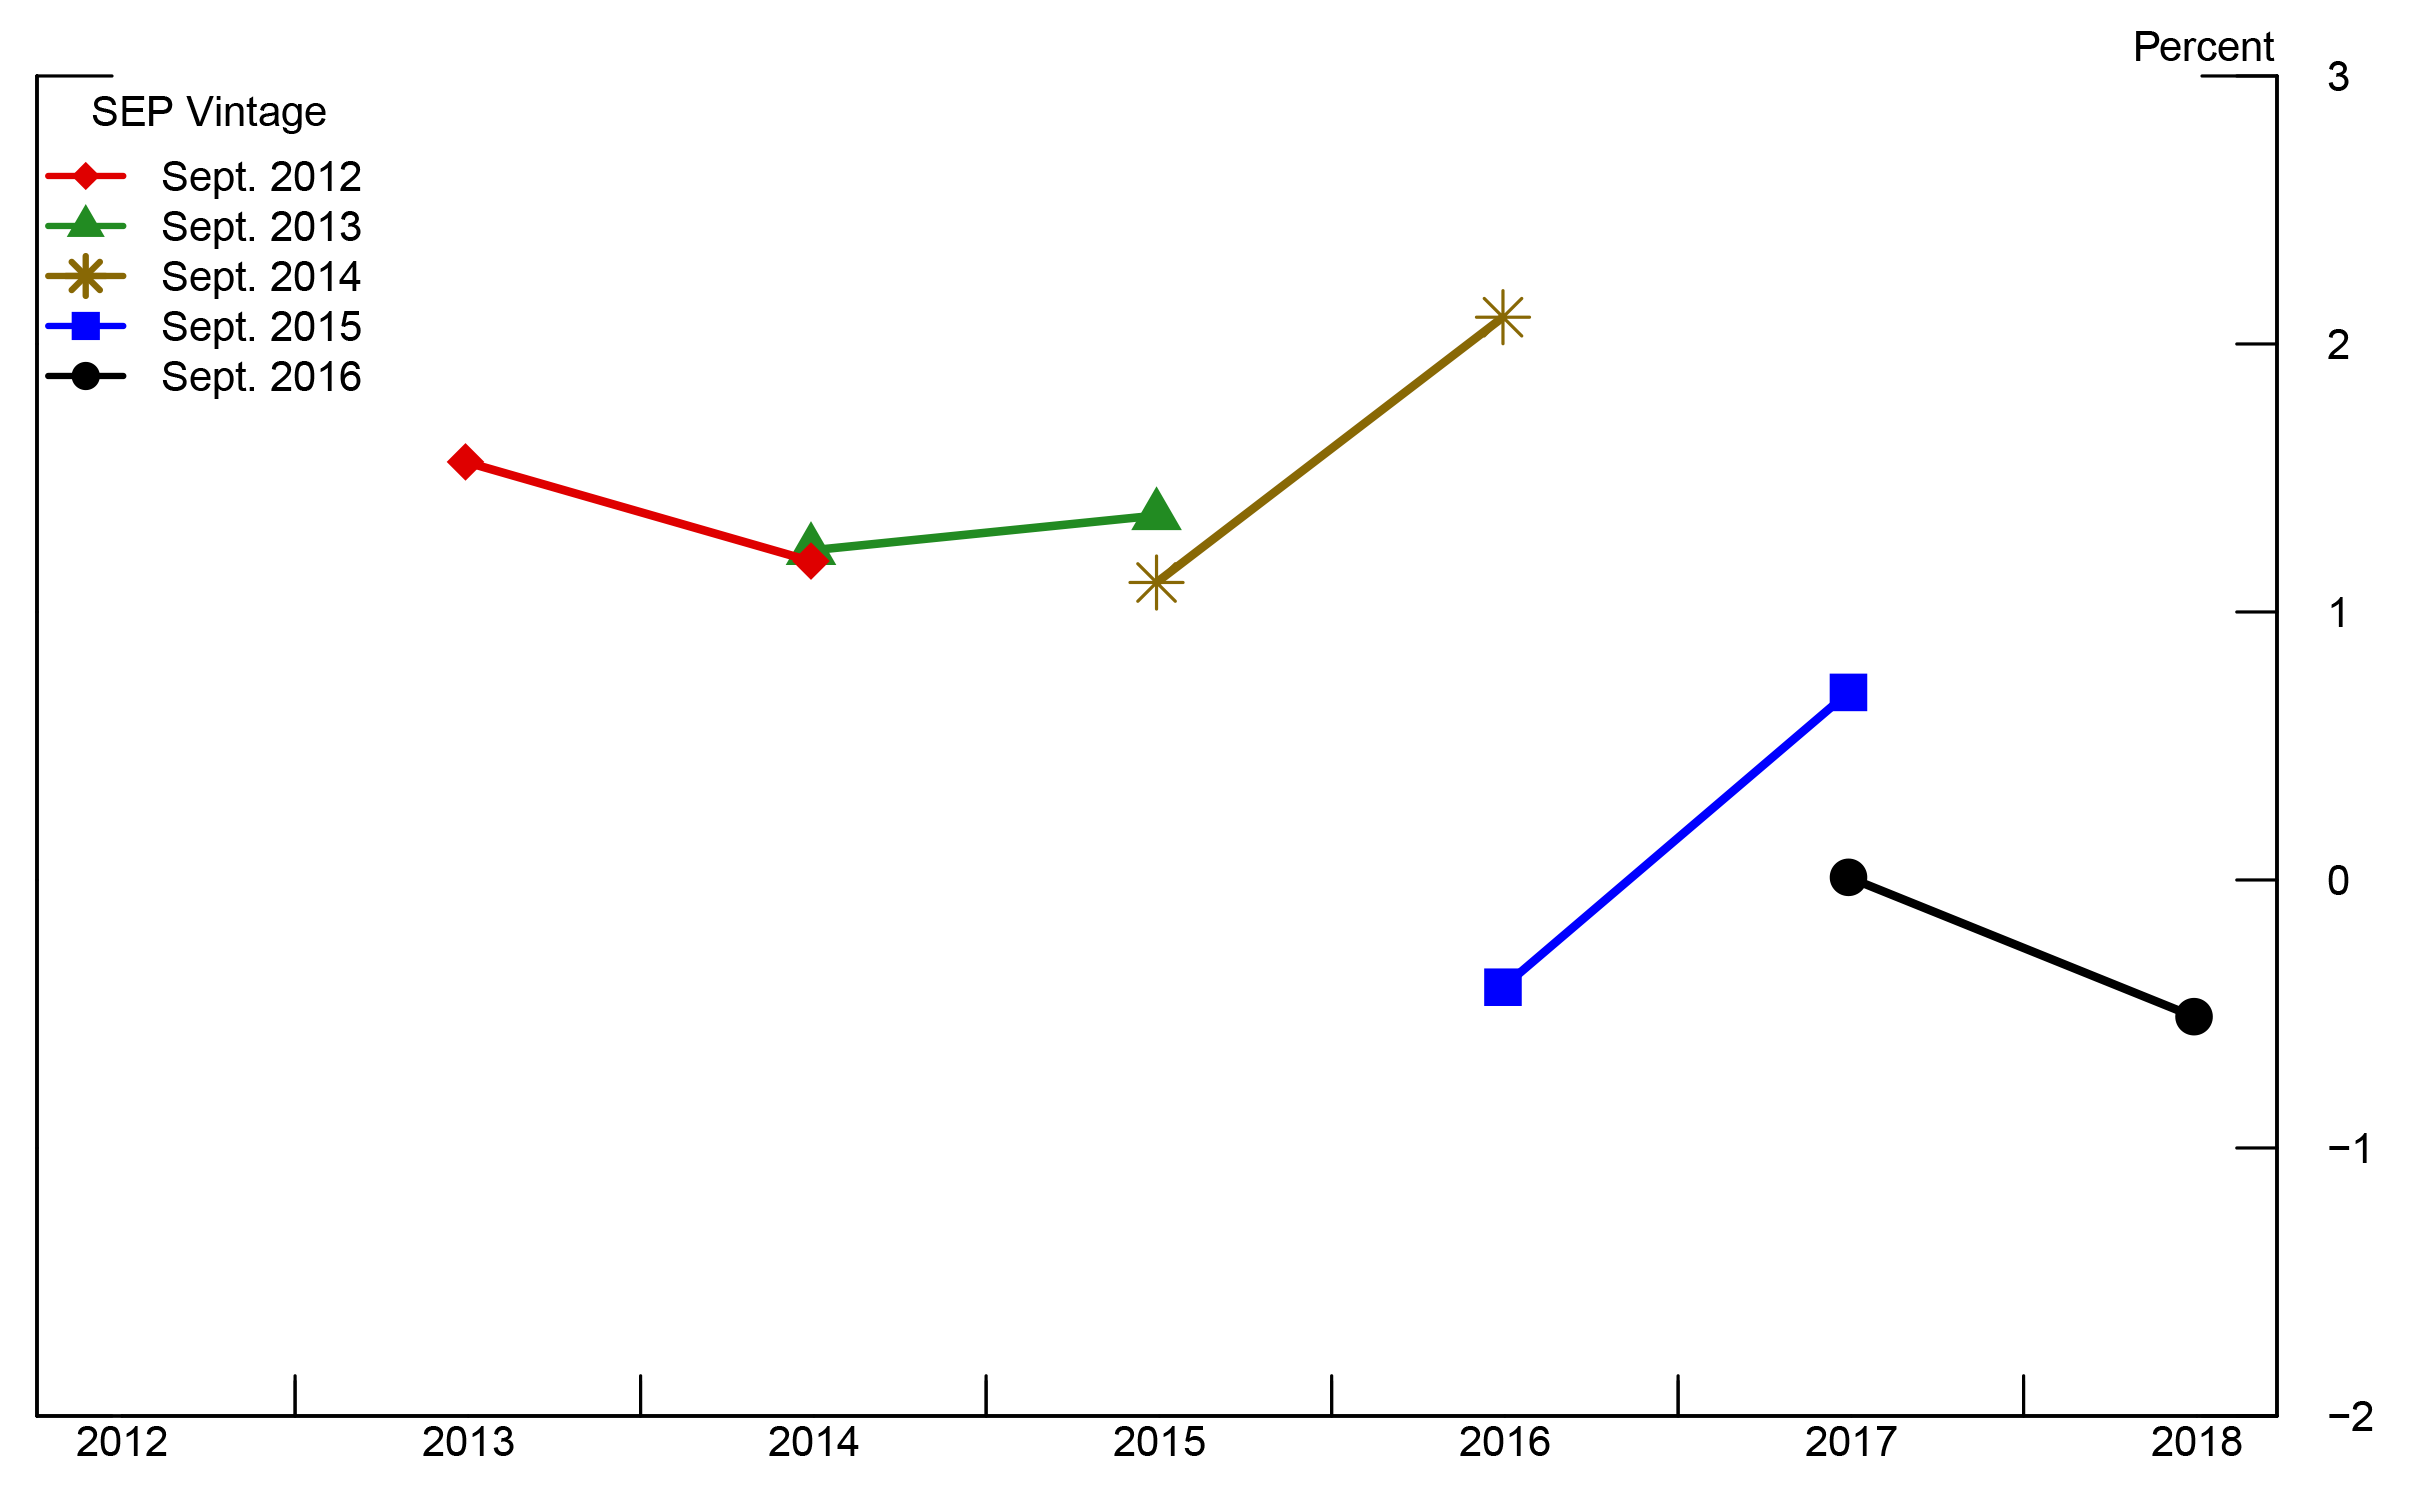
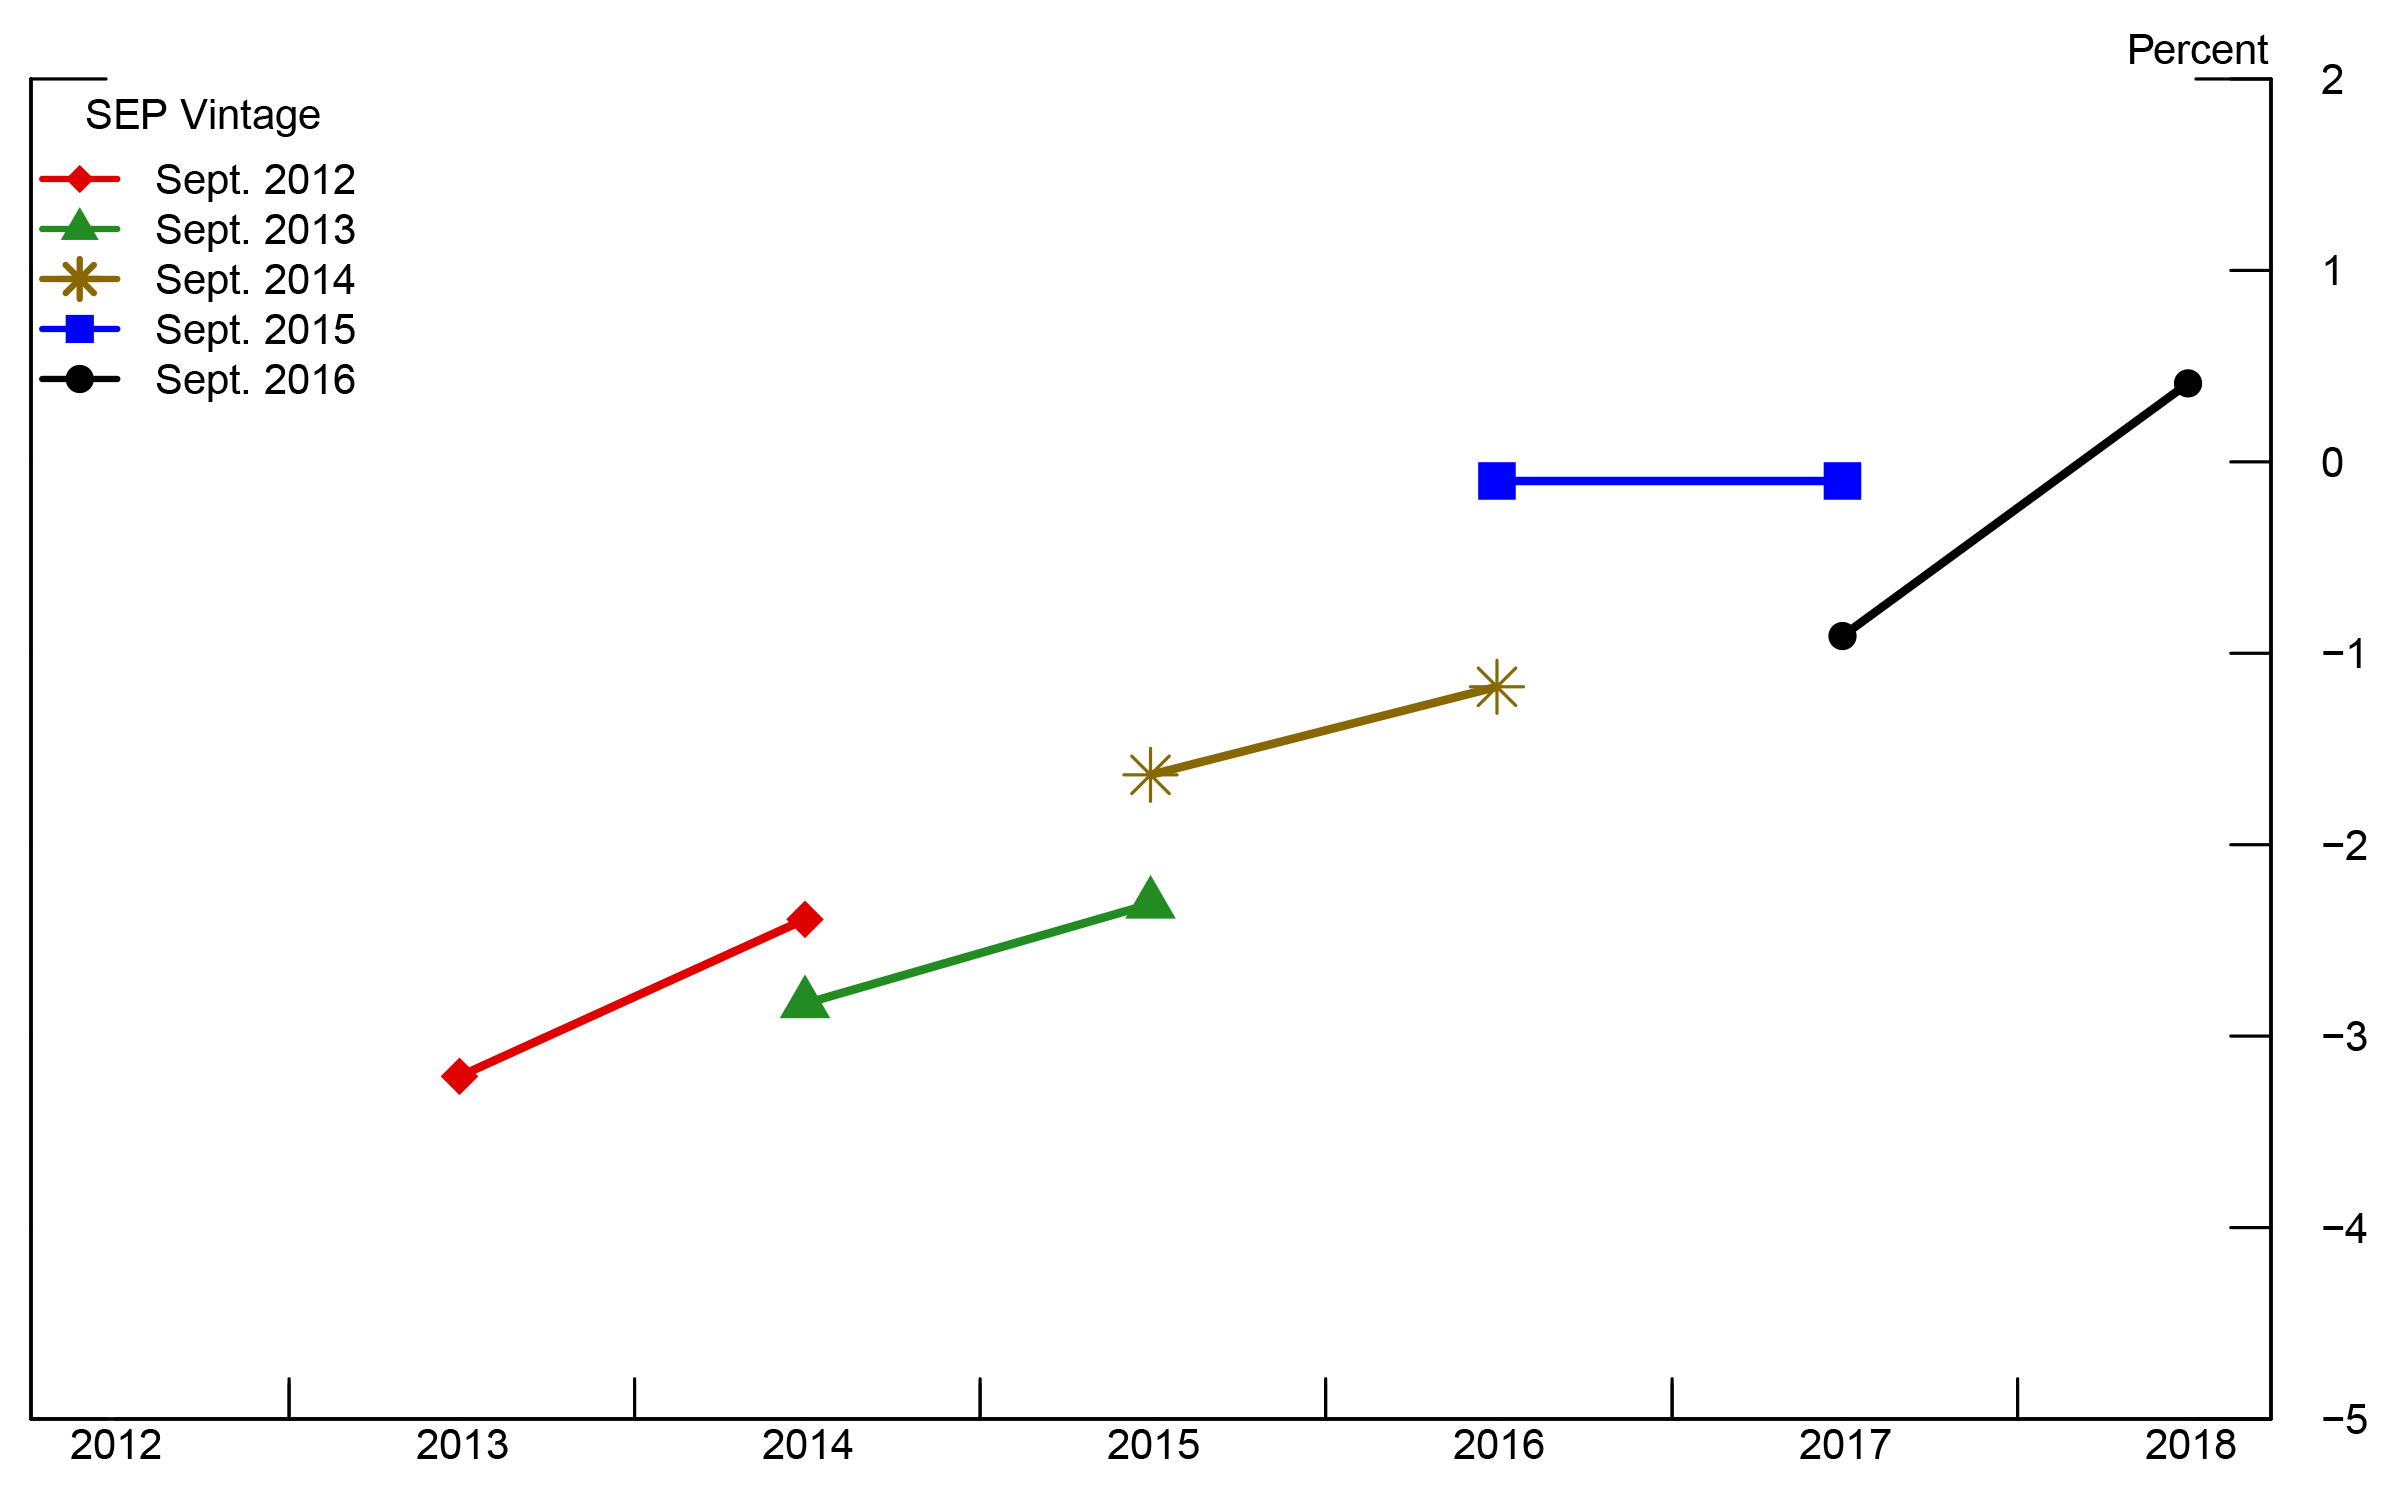
We construct $$ E_t\left\{{\tilde{u}}_{t+h}\right\}$$ as the difference between the median projection of the unemployment rate at the end of year t+h and the median projection of the longer-run normal rate of unemployment. In doing so, we effectively assume that the median projection for the unemployment rate in the longer run coincides with the natural rate of unemployment at all horizons. We construct $$ E_t\left\{r_{t+h}\right\}$$ using the difference between the median projection of the nominal federal funds rate and the median projection of one-year-ahead core PCE price inflation.8 The resulting implied paths of $$ E_t\left\{r^*_{t+h}\right\}$$ and $$ E_t\left\{r_{t+h}-r^*_{t+h}\right\}$$ for different vintages of the SEP are shown in Figure 2.9 Note that, for each SEP vintage, we compute the implied values of the neutral real rate in the subsequent two years.10
Our calculations suggest that median projections of shorter-term neutral real rates have fallen since September 2012. Additionally, we find that median projections of the real policy rate are somewhat below the implied shorter-term neutral rate. As the unemployment rate has approached its longer-run normal level, projected real interest rates have moved up and closer to the implied neutral rate. Indeed, in data from the September 2016 SEP, we see that the median projection for the unemployment rate rises between 2018 and 2019. From our model's perspective, this rise in the unemployment rate indicates that the implied neutral rate is below the projected real federal funds rate in 2018.11
 |
|
 |
|
Sources: Authors' calculations. Data come from the SEP addenda to the minutes to the FOMC meetings from September 2012, 2013, 2014, 2015, 2016.
4. Conclusion
This note has shown how data from the SEP in recent years can be used to reveal an implied assessment that the level of the neutral real rate in the longer run has fallen. At shorter horizons, we find that combining median SEP projections with a simple model of the relationship between the unemployment rate gap and real interest rates indicates that the neutral real rate at shorter horizons is projected to be below its longer-run level for several years. When assessing whether a projected real policy interest rate derived from the SEP medians is accommodative or restrictive, it is important to make the assessment by comparing it to the short-run neutral real rate. The median SEP projection for real policy interest rates is below the longer-run real federal funds rate through 2019, yet rises above the short-run neutral rate implied by the SEP in our simple model in 2018. These findings are consistent with the view that the federal funds rate will be lower than its longer-run normal level for some time but may nevertheless at times constitute restrictive monetary policy because of persistently low short-run neutral rates.12
References
Johannsen, Benjamin K., and Elmar Mertens (2016). "The Expected Real Interest Rate in the Long Run: Time Series Evidence with the Effective Lower Bound," FEDS Notes. Washington: Board of Governors of the Federal Reserve System, February 9, http://dx.doi.org/10.17016/2380-7172.1703.
Johannsen, Benjamin K., and Elmar Mertens (2016). "A Time Series Model of Interest Rates With the Effective Lower Bound," Finance and Economics Discussion Series 2016-033. Board of Governors of the Federal Reserve System (U.S.).
Holston, Kathryn, Thomas Laubach, and John C. Williams (2016). "Measuring the Natural Rate of Interest: International Trends and Determinants," Finance and Economics Discussion Series 2016-073. Board of Governors of the Federal Reserve System (U.S.).
Laubach, Thomas and John C. Williams (2015)."Measuring the Natural Rate of Interest Redux," Hutchins Center on Fiscal & Monetary Policy at Brookings, Working Paper #15.
Laubach, Thomas and John C. Williams (2003). November. "Measuring the Natural Rate of Interest," The Review of Economics and Statistics, Vol. 85, No. 4, Pages 1063-1070.
Lubik, Thomas A., and Christian Matthes, (2015). "Calculating the Natural Rate of Interest: A Comparison of Two Alternative Approaches." Economic Brief No. 15-10. Federal Reserve Bank of Richmond.
Newey, Whitney K., and Kenneth D. West (1987). "A Simple, Positive Semi-Definite, Heteroskedasticity and Autocorrelation Consistent Covariance Matrix." Econometrica Vol. 55, No. 3, Pages 703-708.
1. In March 2014, a new sentence in the postmeeting statement said, "The Committee currently anticipates that, even after employment and inflation are near mandate-consistent levels, economic conditions may, for some time, warrant keeping the target federal funds rate below levels the Committee views as normal in the longer run." In the December 2015 statement, this sentence was changed to say, "The Committee expects that economic conditions will evolve in a manner that will warrant only gradual increases in the federal funds rate; the federal funds rate is likely to remain, for some time, below levels that are expected to prevail in the longer run." For FOMC statements by meeting, see https://www.federalreserve.gov/monetarypolicy/fomccalendars.htm#20363. Return to text.
2. See, for example, https://www.federalreserve.gov/newsevents/speech/yellen20151202a.htm. Return to text.
3. The FOMC's Statement on Longer-run Goals and Monetary Policy Strategy describes the longer-run projections for output growth and the unemployment rate as "estimates of the longer-run normal rates of output growth and unemployment." To the extent that the neutral policy rate is the "normal" rate, the longer-run federal funds rate projections can be interpreted as projections of the longer-run neutral rate. Return to text.
4. Our assumed relationship between real interest rates and the unemployment rate gap could be interpreted as a canonical IS equation, along with a relationship between investment and the unemployment rate gap. Return to text.
5. Unemployment rate data are taken from https://fred.stlouisfed.org/  . For the unemployment rate, we use the quarterly average of the monthly unemployment rate, which has Federal Reserve Economic Data (FRED) mnemonic UNRATE. For the natural rate of unemployment, we use the Congressional Budget Office's estimate, which has a quarterly frequency and FRED mnemonic NROU. Return to text.
6. For the federal funds rate, we use the quarterly average of the daily effective federal funds rate, which has FRED mnemonic FEDFUNDS. For inflation expectations, we use the log difference of the median forecast level of the GDP deflator four quarters ahead and the median forecast level of the GDP deflator in the current period. The SPF mnemonic for the forecast of the level the GDP/GNP price deflator is PGDP and can be downloaded from https://www.philadelphiafed.org/research-and-data/real-time-center/survey-of-professional-forecasters/ . We use the
log difference of the projected GDP/GNP deflator in 4 quarters and the projected GDP/GNP deflator in the current quarter as our measure of expected inflation. Return to text.
7. Data from Johannsen and Mertens (2016) were downloaded from https://www.federalreserve.gov/econresdata/notes/feds-notes/2016/the-expected-real-interest-rate-in-the-long-run-time-series-evidence-with-the-effective-lower-bound-20160209.html. Updated data from Laubach and Williams (2003) were downloaded from www.frbsf.org/economic-research/files/Laubach_Williams_updated_estimates.xlsx . See also Johannsen and Mertens (2016b), Laubach and Williams (2015) and Holston, Laubach, and Williams (2016). Also, see Lubik and Matthes (2015) for another estimate that is conceptually similar to $$ r^*_t$$ . Return to text.
8. Median projections for core PCE price inflation and the unemployment rate are not available prior to September 2015; for earlier SEP vintages, we use the midpoint of the central tendency for each variable. Return to text.
9. If the publicly available SEP data provided projections for individual participants, we could construct paths for $$ E_t\left\{r_{t+h}-r^*_{t+h}\right\}$$ for every survey participant. Without such data, we rely on the median projections or, in its absence, the midpoint of the central tendency. This procedure may well produce paths for $$ E_t\left\{r^*_{t+h}\right\}$$ that differ from the median path that would be implied from each participant's projections. Return to text.
10. While we could estimate the implied neutral rate in the year that the SEP is conducted, by the September meeting participants already know a great deal about the performance of the economy in that year, making the projections for the current year somewhat less comparable to projections about future years. Return to text.
11. In the September 2016 SEP, the median projection for the unemployment rate was 4.8 percent in 2016, 4.6 percent in 2017, 4.5 percent in 2018, and 4.6 percent in 2019. The median projection for the unemployment rate in the longer run was 4.8 percent. Return to text.
12. A number of caveats to our exercise are in order. First, we rely on the median (or in their absence, midpoint) projections from the SEP. Any particular participant's projections might lead to different conclusions. Second, our assumed relationship between economic activity and interest rates is particularly simple. If FOMC participants have an alternative model of the economy in mind when they submit projections to the SEP, that may have different implications for the implied stance of policy. Third, our assumed values of $$ \alpha$$ and $$ \beta$$ are not known with certainty, so even if our relationship between economic activity and interest rates is correct in form, it may have incorrect coefficient values. Finally, the entire expected path of interest rates affects decisions made by households and firms, and the stance of policy may not be well summarized by the current level of the short-term real interest rate relative to a neutral rate benchmark. Return to text.
Please cite as:
Bongard, Michelle and Benjamin K. Johannsen (2016). "The Neutral Rate and the Summary of Economic Projections," FEDS Notes. Washington: Board of Governors of the Federal Reserve System, November 28, 2016, https://doi.org/10.17016/2380-7172.1890.
Disclaimer: FEDS Notes are articles in which Board economists offer their own views and present analysis on a range of topics in economics and finance. These articles are shorter and less technically oriented than FEDS Working Papers.