
FEDS Notes
 Print
PrintFebruary 12, 2016
The Risk of Returning to the Effective Lower Bound: An Implication for Inflation Dynamics after Lift-Off 1
Timothy Hills, Taisuke Nakata, and Sebastian Schmidt2
1. Introduction
In this note, we analyze an implication of the effective lower bound (ELB) risk--the possibility that adverse shocks will force policymakers in the future to lower the policy rate to the ELB--on inflation dynamics after liftoff. The implication we analyze is deflationary bias--a phenomenon in which the tail risk induced by the ELB constraint leads inflation to decline under conventional monetary policy rules. In particular, our focus is examining how large the deflationary bias is at the economy's risky steady state--the point to which the economy eventually converges as headwinds and tailwinds dissipate.
We first document, briefly, how academic economists, policymakers, and financial market participants assess the ELB risk. We then use an empirically rich DSGE (Dynamic Stochastic General Equilibrium) model to analyze how large the deflationary bias induced by the ELB risk might be in the U.S. Our baseline simulation suggests that the ELB risk causes inflation to undershoot the target rate of 2 percent by about 20 basis points at the economy's risky steady state under an empirically plausible specification of monetary policy. We find that the deflationary bias induced by the ELB risk can increase to as large as 40 basis points under alternative plausible assumptions regarding the long-run equilibrium real rate.
Overall, our result provides a cautionary tale for policymakers aiming to raise inflation from currently low levels: Even after liftoff, the ELB constraint can have enduring adverse effects on inflation through its effects on expectations. The note concludes by briefly discussing some implications of this enduring effect of the ELB constraint for monetary policy strategy. The analyses in this note draw heavily on Hills, Nakata, and Schmidt (2016).
2. ELB risk after lift-off
Academic economists and policymakers have noted that the ELB is not likely to be a one-time event. Ball (2013) argues that, if the inflation target remains 2 percent, "the lower bound on interest rates is likely to constrain monetary policy in a large fraction of recessions" in the U.S. In its April 2014 WEO, the IMF extensively studies the world wide decline in equilibrium real rates and states that the probability of hitting the ELB is likely to increase going forward (IMF (2014)). A renewed interest in the analysis of optimal inflation targets and alternative monetary policy frameworks is based on the assumption that the ELB can bind again (Blanchard et al. (2010) and Bernanke (2015)).
Financial market participants also see the ELB binding again in the future as a quantitatively significant possibility. According to a special question in the Survey of Primary Dealers on December 2015, a median respondent attached 20 percent probability to the event that the federal funds rate returns to the ELB within two years after lift-off.
3. An implication of the ELB risk: Deflationary bias
3.1. What is deflationary bias?
When firms are forward-looking in their pricing decisions, the ELB risk leads inflation to fall below the inflation target at the economy's risky steady state, provided that monetary policy is characterized by a standard interest-rate feedback rule. In plain English, this means that inflation will return to a level below the inflation target when all headwinds or tailwinds dissipate. This also means that inflation fluctuates around that level even in absence of actual ELB episodes. This phenomenon occurs because forward-looking firms base their pricing decisions on the expected economic conditions in the future, and the tail risk induced by the ELB constraint lowers the expected economic conditions. In the academic literature, this phenomenon is referred to as deflationary bias.3
3.2. How large is the deflationary bias?
We use an empirically rich DSGE model calibrated to broadly match key moments of the output gap, inflation, and the federal funds rate in the U.S. over the last two decades to get some sense of how large the deflationary bias may be in reality. The model is a standard New Keynesian model augmented with consumption habits in the household's preference, sticky wages, and an interest-rate smoothing term in the policy rule. There are two shocks---productivity and demand shocks. The main shock that drives fluctuations in this economy is the demand shock, which is implemented through time-varying discount rates.4
The inflation target in the model's interest-rate feedback rule is set to 2 percent. The steady-state discount rate and the growth rate of total factor productivity are chosen so that the deterministic steady-state policy rate is 3.75 percent. The effective lower bound on the federal funds rate is set to 13 basis points. The list of parameter values is in Hills, Nakata, and Schmidt (2016). The model is solved globally using a nonlinear solution method.5
The first three rows in Table 1 show the unconditional standard deviations of inflation, the output gap and the nominal interest rate from the model and from the data. The standard deviations of the output gap, inflation, and the policy rate in the model are very close to those in the data (3.1, 0.42, and 2.34 in the model versus 2.9, 0.52, and 2.34 in the data). The next two rows in Table 1 show the conditional mean of the output gap and inflation when the policy rate is at the ELB from the model and from the data. The conditional means of the output gap and inflation are somewhat higher and lower than those in the data, but are reasonably close. Finally, the frequency of being at the ELB and the expected duration of the ELB episode are 16 percent and 9 quarters in the model, versus 36 percent and 26 quarters in the data.6
| Table 1: Key Moments |
|---|
| Moments | Variable | Model | Data (1995Q3-2015Q2) |
|---|---|---|---|
| St.Dev (X) | Output Gap | 3.1 | 2.9 |
| Inflation | 0.42 | 0.52 | |
| Policy Rate | 2.34 | 2.34 | |
| E(X|ELB) | Output Gap | -3.4 | -4.2 |
| Inflation | 1.18 | 1.48 | |
| Policy Rate | 0.13 | 0.13 | |
| ELB | Frequency | 16% | 36% |
| Expected/Actual Duration | 9 quarters | 26 quarters |
Table 2 compares the deterministic and risky steady states of inflation, the output gap, and the policy rate. Due to the deflationary bias explained earlier, inflation is lower at the risky steady state than at the deterministic steady state Inflation is about 30 basis points lower at the risky steady state than the target rate of 2 percent. The policy rate is lower at the risky steady state than the deterministic steady state (3.04 percent versus 3.75 percent), as a lower inflation is associated with a lower policy rate in the interest-rate feedback rule.7 The expected real rate is lower at the risky steady state, and thus the output gap is positive at the risky steady state, albeit slightly.
| Table 2: The Effects of the ELB Risk on the Steady State |
|---|
| Inflation | Output Gap | Policy Rate | |
|---|---|---|---|
| Deterministic Steady State | 2 | 0 | 3.75 |
| Risky Steady State | 1.71 | 0.32 | 3.04 |
| (wedge) | (-0.29) | (0.32) | (-0.71) |
| E(X) | 1.66 | 0.29 | 2.8 |
| Risky Steady State (No ELB Constraint) | 1.88 | 0.04 | 3.37 |
| (wedge) | (-0.12) | (0.04) | (-0.38) |
Since the ELB constraint is not the only nonlinear feature of the model, there is some difference between the deterministic and risky steady states even in the absence of the ELB constraint, as shown in the last two rows of Table 2. For inflation, the risky steady state is 1.88 percent in the model without the ELB constraint. The contribution of the ELB risk to the overall deflationary bias at the risky steady state is 17 basis points. Thus, the majority of the overall deflationary bias in the model with the ELB constraint comes from the ELB constraint, instead of other nonlinearities of the model.
Note that the risky steady state is conceptually different from the average. Let's take inflation as an example. The risky steady state inflation is the point around which inflation fluctuates, while the average inflation is the average of inflation in all states of the economy. As shown in Table 2 and Figure 1, the risky steady state inflation is higher than the average inflation in the economy with the ELB constraint, as the ELB constraint makes the unconditional distribution of inflation negatively skewed. The observation that the ELB constraint pushes down the average inflation below the target by creating asymmetry in the distribution of inflation is intuitive and has been well known for a long time (Coenen, Orphanides, and Wieland (2004) and Reifschneider and Williams (2000)). This holds true even when price-setters form expectations in a backward-looking manner. The result that the ELB risk lowers the center of the distribution below the target is less intuitive and requires that price-setters are forward-looking in forming their expectations.
| Figure 1: Unconditional Distribution of Inflation |
|---|
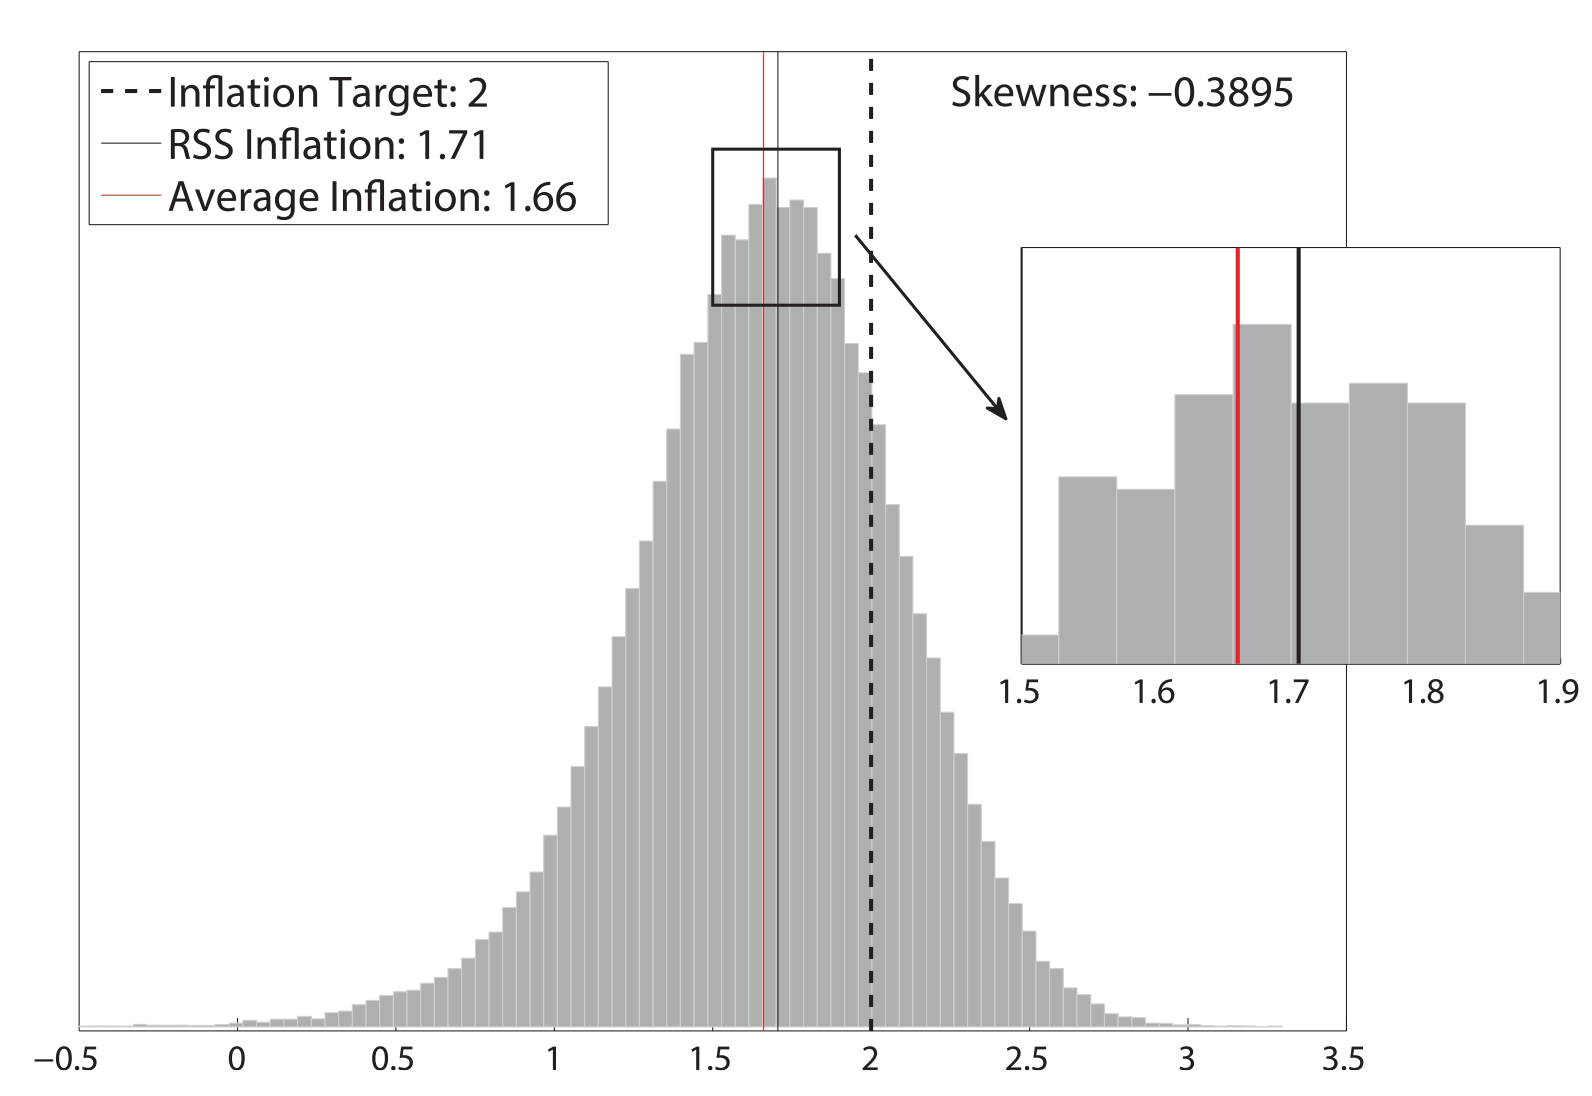 |
Note: Authors' calculation as described in Hills, Nakata, and Schmidt (2016)
To emphasize the fact that the possibility of the ELB is the source of the deflationary bias, we contrast the impulse response functions of inflation, output, and the policy rate from the model with those from a perfect-foresight version of the model, which ignores the ELB risk. Figure 2 shows the impulse response functions when the initial demand and productivity shocks are chosen so that inflation is 50 basis points, the output gap is -7 percent, and the policy rate is at the ELB at period one. Black lines are from the perfect-foresight version of the model that abstracts from the ELB risk, while red lines are from the model that correctly takes the ELB risk into account. Under perfect-foresight, the policy rate stays at the ELB for 11 quarters and will gradually converge to 3.75 percent. Inflation slowly rises to 2 percent, and the output gap will converge to zero after some overshooting. On the other hand, when the private sector correctly acknowledges the ELB risk, the policy rate stays at the ELB for 13 quarters and returns to its risky steady state of about 3 percent. Inflation slowly rises to about 1.7 percent and the output gap remains slightly positive in the long run.
| Figure 2: The Effect of the ELB Risk on Projections |
|---|
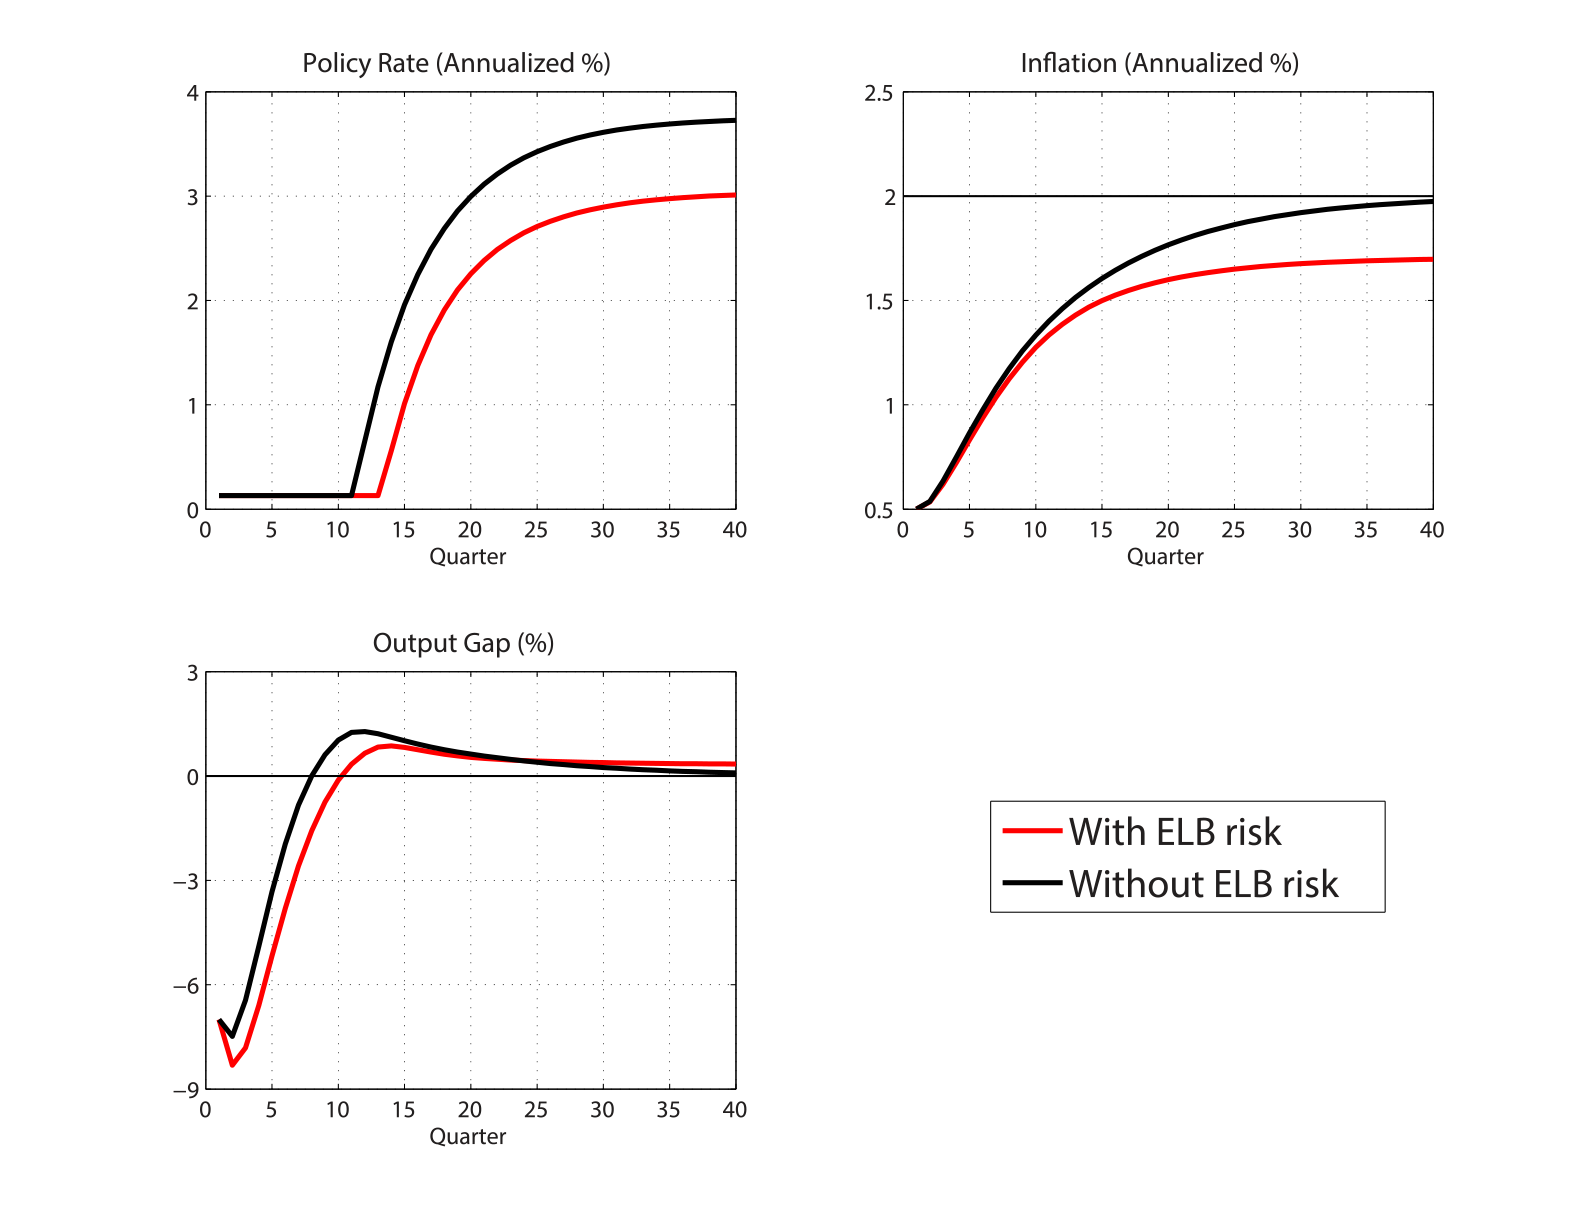 |
Note: Authors' calculation as described in Hills, Nakata, and Schmidt (2016)
3.3. The long-run equilibrium interest rate and deflationary bias
The magnitude of the deflationary bias depends importantly on the frequency of the policy rate being at the ELB, which in turn depends on the long-run equilibrium policy rate. Figure 3 shows how the magnitude of deflationary bias depends on the (deterministic) steady-state level of the policy rate. In this figure, we vary the parameter governing the long-run growth rate of labor productivity to induce the change in the steady-state policy rate. As demonstrated in the top-right panel, deflationary bias is larger when the deterministic steady state policy rate is lower. This is because the probability of hitting the ELB is higher with a lower steady-state policy rate, as shown in the top-left panel of the figure. When the deterministic steady state policy rate is 3.35 percent, the probability of being at the ELB is 28 percent and inflation is about 50 basis points below the inflation target at the economy's risky steady state. Comparing this deflationary bias with that in the model without the ELB constraint, indicated by the dashed black line, shows that the ELB risk accounts for about 40 basis points of the overall deflationary bias.8
| Figure 3: Long-Run Policy Rate and Deflationary Bias |
|---|
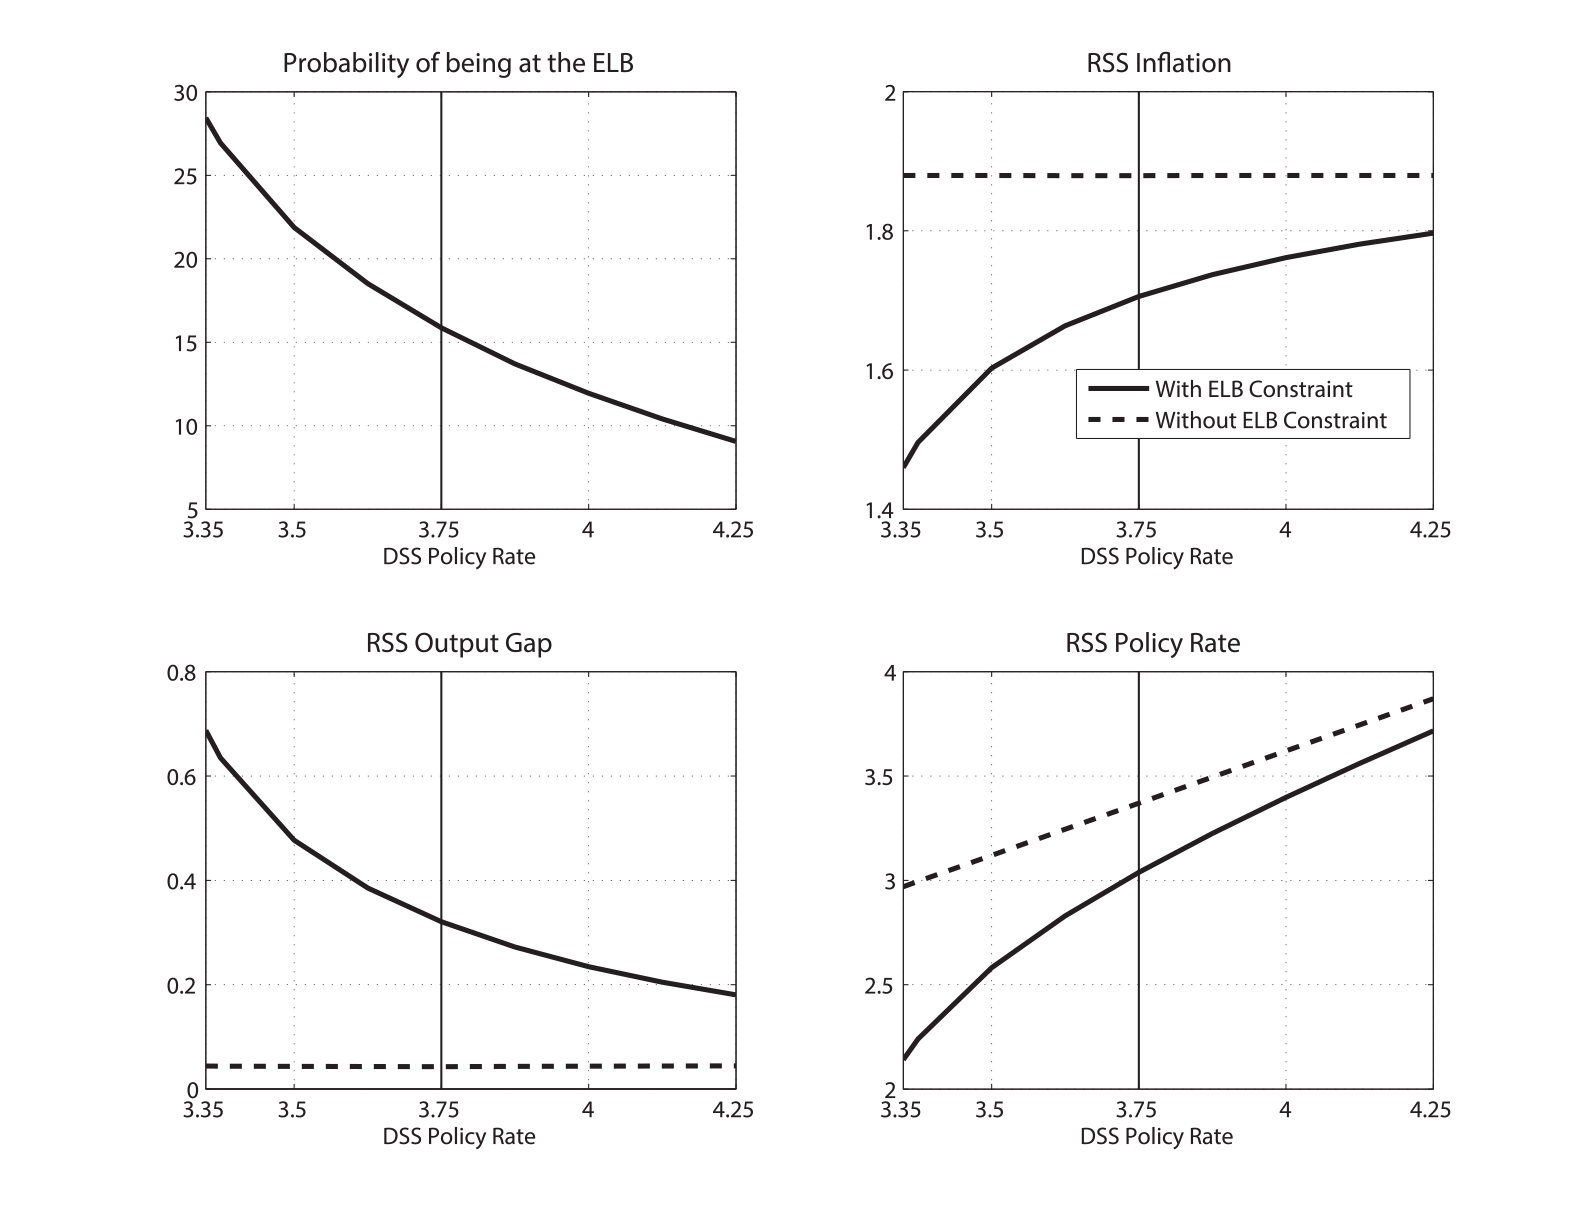 |
Note: Authors' calculation as described in Hills, Nakata, and Schmidt (2016)
4. Concluding remarks
This note has demonstrated that the deflationary bias induced by the ELB risk is non-trivial in an empirically rich DSGE model calibrated to match key features of the U.S. economy. The result that the ELB constraint has enduring effects on the economy even after liftoff has important implications for the design of monetary policy. For example, the deflationary bias, while typically ignored in the analyses of optimal inflation targets, importantly affects the cost-benefit calculation of changing the inflation target. As another example, Nakata and Schmidt (2014) show that the deflationary bias makes it desirable for the central bank to put more weight on the inflation stabilization objective, relative to the output stabilization objective.9
This conclusion is of course conditional on the validity of the model used for the analysis. While the model is a variant of the standard model widely used at central banks, there is a continuing debate about the usefulness of this model for policy analysis among economists. Thus, caution is needed when drawing policy implications.10
References:
Adam, K., and R. Billi (2007): "Discretionary Monetary Policy and the Zero Lower Bound on Nominal Interest Rates," Journal of Monetary Economics, 54(3), 728-752.
Ball, L. M. (2013): "The Case for Four Percent Inflation," Central Bank Review, 13, 17-31.
Bernanke, B. (2015): "Monetary Policy in the Future," Remarks at the Rethinking Macro Policy III Conference at the IMF, Washington, DC.
Blanchard, O., G. Dell'Ariccia, and P. Mauro (2010): "Rethinking Macroeconomic Policy," Journal of Money, Credit, and Banking, 42(s1), 199-215.
Chung, H., E. Herbst, and M. T. Kiley (2014): "Effective Monetary Policy Strategies in New Keynesian Models: A Re-Examination," NBER Working Papers 20611, National Bureau of Economic Research.
Coenen, G., A. Orphanides, and V. Wieland (2004): "Price Stability and Monetary Policy Effectiveness when Nominal Interest Rates are Bounded at Zero," B.E. Journal of Macroeconomics: Advances in Macroeconomics, 4(1).
Evans, C., J. Fisher, F. Gourio, and S. Krane (2015): "Risk Management for Monetary Policy Near the Zero Lower Bound," Brookings Papers on Economic Activity Conference Draft.
Hills, T. S., T. Nakata, and S. Schmidt (2016): "The Risky Steady State and the Interest Rate Lower Bound," Finance and Economics Discussion Series 2016-009, Board of Governors of the Federal Reserve System (U.S.).
IMF (2014): "World Economic Outlook" April 2014
Nakata, T., and S. Schmidt (2014): "Conservatism and Liquidity Traps," Finance and Economics Discussion Series 2014-105, Board of Governors of the Federal Reserve System (U.S.).
Nakov, A. (2008): "Optimal and Simple Monetary Policy Rules with Zero Floor on the Nominal Interest Rate," International Journal of Central Banking, 4(2), 73-127.
Reifschneider, D., and J. C. Williams (2000): "Three Lessons for Monetary Policy in a Low-Inflation Era," Journal of Money, Credit and Banking, 32(4), 936-966.
1. We would like to thank Jean-Phillipe Laforte and John Roberts for their comments. Paul Yoo provided excellent research assistance. The views expressed in this note, and all errors and omissions, should be regarded as those solely of the author, and are not necessarily those of the Federal Reserve Board of Governors, the Federal Reserve System, or the European Central Bank. Return to text
2. Timothy Hills is a Ph.D. student at the Stern School of Business, New York University; Taisuke Nakata is an economist at the Board of Governors of the Federal Reserve System (Division of Research and Statistics); Sebastian Schmidt is an economist at the European Central Bank (Monetary Policy Research Division). Return to text
3. The implications of deflationary bias for optimal policy have been studied in a stylized New Keynesian model by Adam and Billi (2007), Evans et al. (2015), Nakata and Schmidt (2014), and Nakov (2008). Note that the magnitude of the deflationary bias depends on the policy rule in place. Under the price-level targeting or optimal commitment policy, the deflationary bias would be smaller as the decline in inflation at the ELB would be smaller. Return to text
4. See Hills, Nakata, and Schmidt (2016) for more details on the model. Return to text
5. Due to the computational burden of globally solving dynamic models, economists typically solve monetary DSGE models under the assumption of perfect-foresight. That is, after lift-off, the households and firms are assumed to attach zero probability to the event that adverse shocks will push the policy rate back to the ELB. Due to curse of dimensionality, the computational burden of globally solving DSGE models increases exponentially with the size of the model. It is nearly infeasible to solve more empirically-rich structural models--such as FRB/US, EDO, and SIGMA used at the Federal Reserve--in a reasonable amount of time without perfect-foresight assumptions. Return to text
6. The ELB frequency in the data depends importantly on the sample period. We use the last two decades as our sample because the long-run inflation expectations were low and stable during this period. Return to text
7. As we discuss in Hills, Nakata, and Schmidt (2016), another way to understand why inflation and the policy rate are lower at the risky steady state than at the deterministic steady state is to examine the interaction of the Taylor rule with a version of the Fisher relationship modified to account for the effects of risk. Return to text
8. A similar picture emerges if one considers a change in the target rate of inflation or the value of the effective lower bound, as shown in Hills, Nakata, and Schmidt (2016). Return to text
9. In Hills, Nakata, and Schmidt (2016), we study how each parameter in the interest-rate feedback rule affects the magnitude of deflationary bias and show that a higher inertia, a higher inflation target, and a lower effective lower bound can reduce the size of the deflationary bias. Return to text
10. See, for example, Chung, Herbst, and Kiley (2014). Return to text
Please cite this note as:
Hills, Timothy, Taisuke Nakata, and Sebastian Schmidt (2016). "The Risk of Returning to the Effective Lower Bound: An Implication for Inflation Dynamics after Lift-Off," FEDS Notes. Washington: Board of Governors of the Federal Reserve System, February 12, http://dx.doi.org/10.17016/2380-7172.1690.
Disclaimer: FEDS Notes are articles in which Board economists offer their own views and present analysis on a range of topics in economics and finance. These articles are shorter and less technically oriented than FEDS Working Papers.
