
FEDS Notes
 Print
PrintFebruary 5, 2016
State and Local Pension Funding in the Enhanced Financial Accounts
Matthew Hoops, Paul Smith, and Irina Stefanescu
In this Note we describe new state-level data on the funding status of state and local government defined-benefit pension plans, which is part of the Enhanced Financial Accounts (EFA) initiative.1 The Financial Accounts of the United States report aggregate (i.e., total U.S.) levels of state and local pension assets and liabilities in Table L.120.b ("State and Local Government Employee Retirement Funds Defined Benefit Plans"). The new EFA tables and maps provide annual state-level detail on pension assets, liabilities, and various measures of funding status, going back to 2000.2
State and local governments have traditionally offered defined-benefit (DB) plans to their employees. While the private sector has largely moved away from DB plans and towards defined- contribution (DC) plans such as 401(k) plans, the public sector has only slowly started to implement similar changes. For example, as reported in Tables L.120.b and L.120.c of the Financial Accounts, state and local DB pension entitlements totaled $4.9 trillion in 2013, while DC arrangements such as 403(b) and 457 plans totaled only $0.5 trillion.3
The funding status of state and local government DB plans has received increased attention in recent years, as many states have struggled with under-funded plans and debates have arisen over the proper method for measuring liabilities.4 As described below, this Note presents a new source of state-level data on the funding status of these plans over time.
1. Measurement of pension liabilities
In a typical DB plan, employers promise employees an annual pension payment generally defined as the product of tenure, salary and a benefit factor (typically between 1 to 4%). As a result, benefits increase almost exponentially as tenure and salary increase over the life cycle. A plan's total pension obligations may be calculated in several different ways. These alternative measures of pension obligations, described below, result in different pictures of pension underfunding and hence, of the pressure the plans put on state and local government budgets. In general, the key difference across the measures is the discount rate used to calculate the present value of future obligations. Lower discount rates result in higher present values for the liabilities and hence make the funding situation look worse.
The Government Accounting Standards Board (GASB) provides accounting guidelines for the measurement of pension liabilities to be reported in the Comprehensive Annual Financial Reports (CAFRs) published by state and local government pension funds. Under these guidelines, liabilities are generally calculated using a discount rate based on the expected rate of return on pension assets. Because a large share of pension assets are invested in assets with relatively high expected returns, this method results in relatively high discount rates, and thus the pensions appear better funded than they do under alternative measures. Based on accounting disclosures, state and local government pension funds were underfunded by about one trillion dollars in 2014, according to the Center for Retirement Research (Munnell and Aubry, 2015).
Several research papers, including Wilcox and Brown (2009) and Novy-Marx and Rauh (2011), have argued that state and local government pension obligations should be calculated using lower discount rates, reflecting their relatively low risk due to strong legal protections. These studies appeal to a finance-theory argument that future liabilities should be discounted at rates that reflect the risk of the liabilities, rather than the risk of the assets. In particular, Novy-Marx and Rauh (2011) estimated pension obligations on the premise that pension promises are close to risk-free Treasury bonds, and thus essentially default-free. Their calculations show that by this benchmark, the pension liabilities reported in the CAFRs were underestimated by about 40 percent in 2009, resulting in substantially higher measures of underfunding.
The pension liabilities reported in the Financial Accounts and EFAs are based on a set of present-value calculations published by the Bureau of Economic Analysis (BEA; see Lenze, 2013 and Stefanescu and Vidangos, 2014). For these calculations, the liabilities reported by pension plans are adjusted to an "accumulated benefit obligation" basis, which measures the value of pension accruals earned to date. The discount rate used to calculate the present value of future obligations is based on AAA-rated corporate-bond interest rates. As a result, the BEA discount rate generally lies between the Treasury rate and the GASB rate.5
2. Data sources
The BEA measure of state and local government pension liabilities is calculated at the state level and is the source for the state-level detail provided here. State-level pension plan assets are collected by the Census Bureau in their annual survey of state- or locally- administered DB plans.6 The Census survey reports assets at market value every year at the end of June.7
Additionally, we collect information on state-level gross domestic product (GDP) and state and local government revenues. Data for state-level GDP comes from the BEA's All Industry Total Annual GDP by State series, included in the BEA's Regional Economic Accounts.8 State-level revenue figures come from the Census Survey of State & Local Government Finances.9 Revenue is defined as total revenue for both state and local governments.
3. State-level assets, liabilities and funding status
Figure 1 shows the size of pension obligations by state for 2013, based on the BEA data. In aggregate, state and local government pension obligations equaled $4.9 trillion. The states with the largest pension liabilities are California ($937 billion), New York ($419 billion) and Illinois ($325 billion).
| Figure 1: State and Local Government Pension Liabilities, 2013 |
|---|
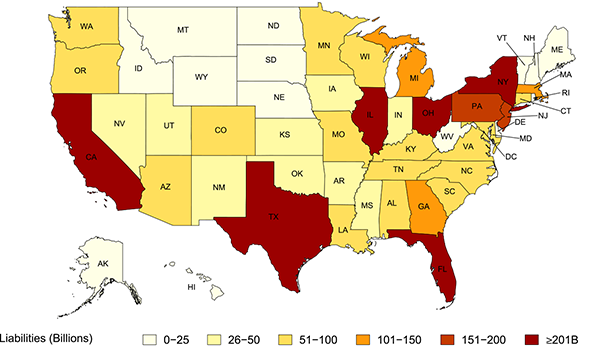 |
Source: Pension assets and state revenue from Census Bureau; pension liabilities and state GDP from Bureau of Economic Analysis.
Figure 2 shows that in 2013, the states with the lowest pension funding ratios (assets relative to liabilities) were Illinois (46% funded), Connecticut (47%), New Jersey (48%) and Kentucky (48%). A complete list of pension assets, liabilities, and various measures of funding status for each state are available on the EFA web page.
| Figure 2: State and Local Government Pension Funding Ratios, 2013 |
|---|
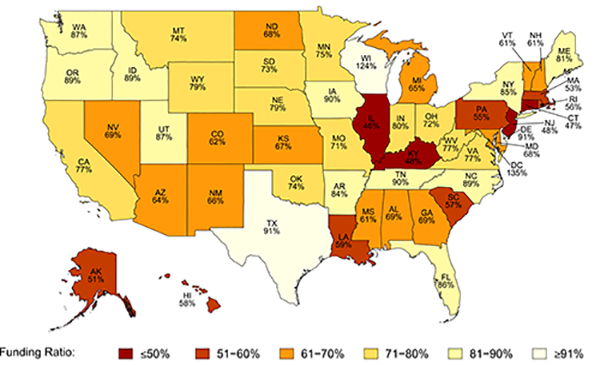 |
Source: Pension assets and state revenue from Census Bureau; pension liabilities and state GDP from Bureau of Economic Analysis.
Note: Reported percentages are pension funding ratios, defined as pension assets as a percentage of pension liabilities.
References:
Brown, Jeffrey R., and David W. Wilcox (2009). "Discounting State and Local Pension Liabilities." American Economic Review, 99(2): 538-42.
Gallin, Joshua, and Paul Smith (2014). "Enhanced Financial Accounts," Finance and Economics Discussion Series Note, Washington: Board of Governors of the Federal Reserve System, 2014-08-01.
Lenze, David G. (2013), State and Local Government Defined Benefit Pension Plans: Estimates of Liabilities and Employer Normal Costs by State, 2000-2011, Bureau of Economic Analysis, Working paper.
Munnell, Alicia H., and Jean-Pierre Aubry (2015), The Funding Of State And Local Pensions: 2014-2018, Center for Retirement Research at Boston College.
Munnell, Alicia H., Jean-Pierre Aubry, and Mark Cafarelli (2014), The Funding Of State And Local Pensions: 2013-2017, Center for Retirement Research at Boston College.
Munnell, Alicia H., Jean-Pierre Aubry, and Laura Quinby (2010), The impact of Public Pensions on state and local budgets, Center for Retirement Research at Boston College.
Munnell, Alicia H., 2012, State and Local Pensions. What Now?, The Brookings Institution.
Novy-Marx, R. and Rauh, J. (2014), Revenue Demands of Public Employee Pension Promises (with), American Economic Journal: Economic Policy 6(1), 193-229.
Novy-Marx, R. and Rauh, J. (2011), Public Pension Promises: How Big Are They and What Are They Worth? The Journal of Finance, 66: 1211-1249.
Stefanescu, Irina and Ivan Vidangos (2014). Introducing Actuarial Liabilities and Funding Status of Defined-Benefit Pensions in the U.S. Financial Accounts. Finance and Economics Discussion Series Note, Washington: Board of Governors of the Federal Reserve System, 2014-10-31.
1. The EFA initiative is a long-term effort to augment the Financial Accounts of the United States with a more detailed picture of financial intermediation and interconnections, including supplementary information that offers finer detail, new types of activities, higher-frequency data, and more-disaggregated data (see Gallin and Smith, 2014), http://www.federalreserve.gov/apps/fof/efa/enhanced-financial-accounts.htm. Return to text
2. The EFA data are available at http://www.federalreserve.gov/apps/fof/efa/efa-project-state-local-government-defined-benefit-pension-plans.htm. Return to text
3. Alaska and Michigan are the only two states constraining employees to rely solely on a defined-contribution plan, and these plans are small (Munnell, 2012 and Munnell, Aubry and Cafarelli, 2014). After the financial crisis several government sponsors began to offer hybrid plans such as cash balance plans, which are defined-benefit plans that maintain notional individual accounts but provide some guaranteed base return. Return to text
4. For example, see Munnell and Aubrey (2015), Munnell, Aubry and Quinby (2010), and Novy-Marx and Rauh (2014, 2011). Return to text
5. For example, the BEA discount rate is 6.0% (2000-03), 5.5% (2004-09), and 5.0% (2010-present). Return to text
6. See http://www.census.gov/govs/retire/get_forms.html. Return to text
7. We estimate plan assets as of the end of the fourth quarter using the following procedure: First, aggregate (total U.S.) assets as reported in the Census survey are extrapolated from the second quarter to the end of the year by applying the growth rate of aggregate U.S. state-and-local pension assets in the Financial Accounts of the United States (specifically, the series labelled FL222000075.Q). Second, state-level estimates for the fourth quarter are calculated by applying each state's share of aggregate U.S. pension assets to the fourth-quarter aggregate (we actually use the average share in the most recent two years of Census data). Return to text
8.For each year, the annual figure is an average of all four BEA quarterly figures figures for each regional and state for that year. Data was available from 1997-2014, http://www.bea.gov/regional/index.htm. Return to text
9. Data is available on a national level for all years 1997-2013 but is missing state-by-state breakdowns for 2001 and 2003, http://www.census.gov//govs/local/. Return to text
Please cite this note as:
Hoops, Matthew C., Paul A. Smith, and Irina Stefanescu (2016). "State and Local Pension Funding in the Enhanced Financial Accounts," FEDS Notes. Washington: Board of Governors of the Federal Reserve System, February 5, http://dx.doi.org/10.17016/2380-7172.1700.
Disclaimer: FEDS Notes are articles in which Board economists offer their own views and present analysis on a range of topics in economics and finance. These articles are shorter and less technically oriented than FEDS Working Papers.
