
IFDP Notes
 Print
PrintDecember 30, 2015
The Slowdown in Global Trade
Jane Haltmaier
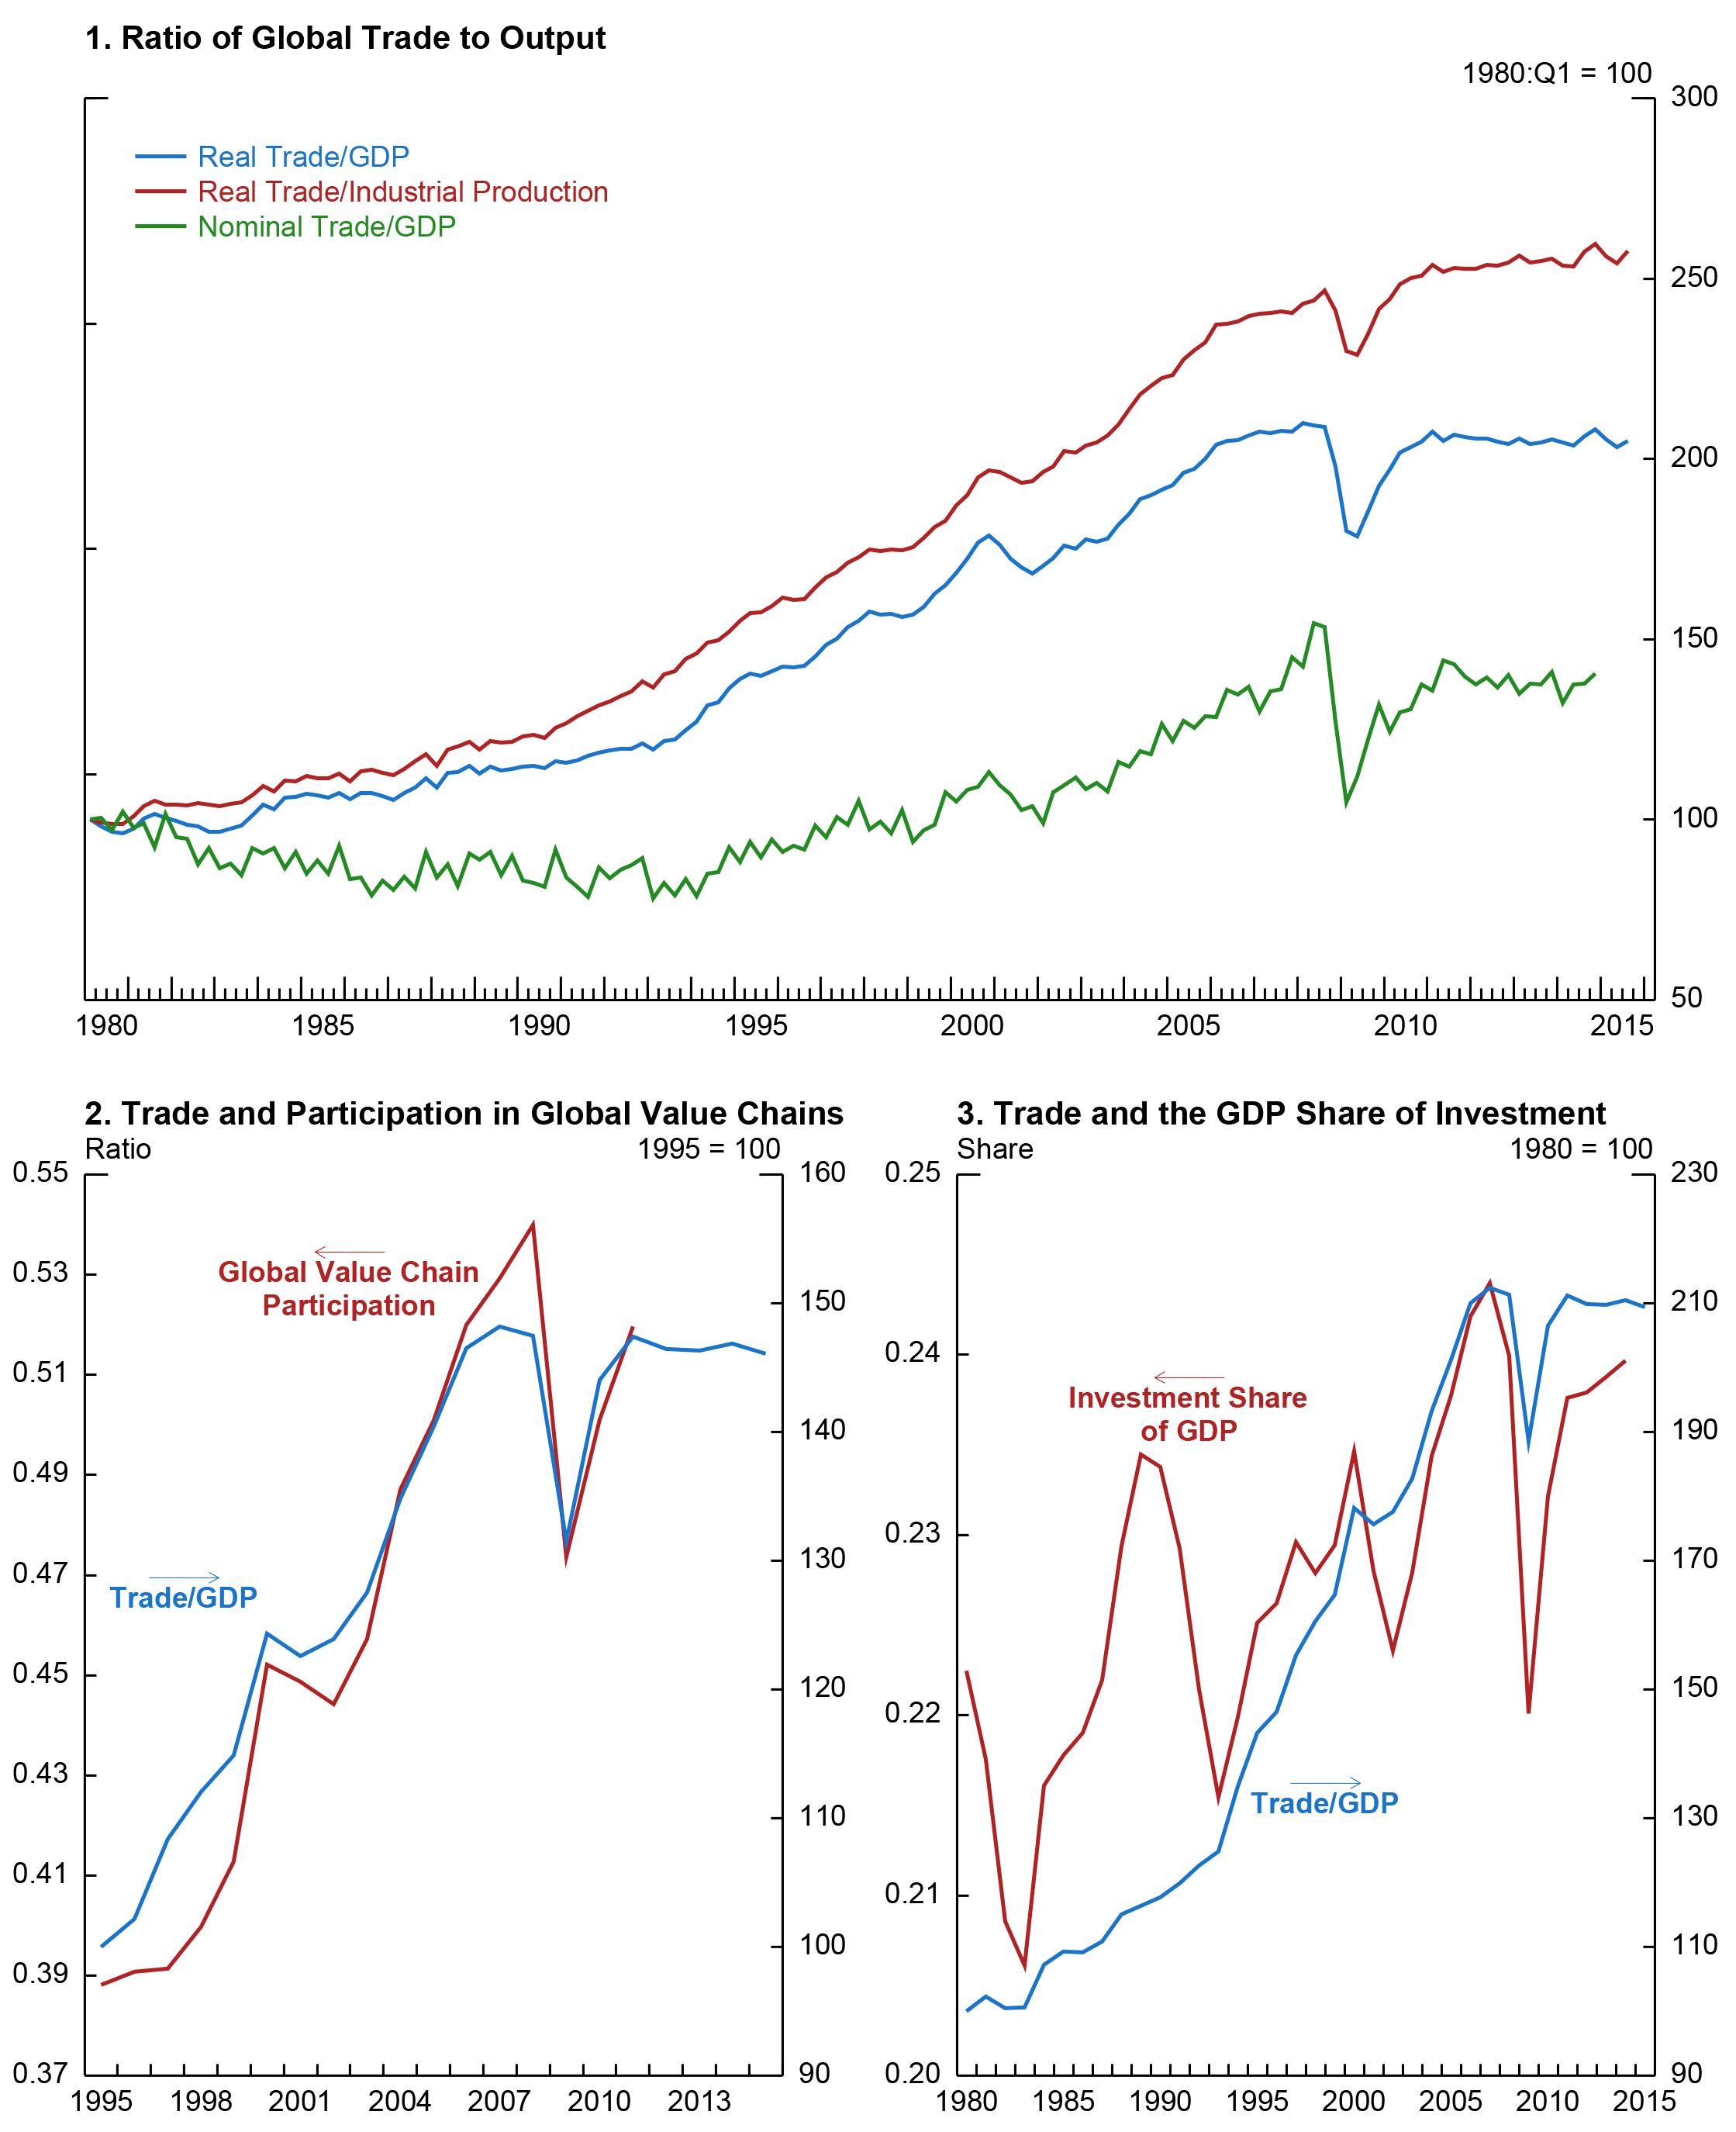
The ratio of real global trade to GDP (the blue line in exhibit 1, panel 1) has leveled off since its recovery after a sharp decline during the global financial crisis (GFC).1 Relative to industrial production (the red line), trade has continued to edge up, but the increase in this ratio is also much slower than before the crisis. The stagnation is even more evident when both trade and GDP are measured in U.S. dollars (the green line), as the ratio of nominal trade to GDP has not even re-attained its pre-GFC peak. This development likely reflects the steep fall in oil prices, which affects nominal trade more than nominal GDP. Across all these measures, the recent deceleration in trade relative to output is particularly striking because it follows nearly three decades of steady increases, most notably from 1995 through 2007.
The slowdown in trade has received a great deal of attention, and it is sometimes cited as one of the reasons for the sluggishness of global output growth. However, the linkage between the two is not clear-cut. The economic literature has found a positive association between openness to trade and GDP growth at the individual country level, which is thought to result from the spread of technology as well as pressure to maximize efficiency in exporting and import-competing industries. These forces are likely to be particularly important for less-developed countries. But increasing trade is not the only way to achieve further technology dissemination and/or to improve efficiency, especially for countries whose production and financial systems are already well-integrated into the global economy. Growth in trade also involves a reallocation of resources among countries that increases global output as long as there are unexploited comparative advantages. However, it is difficult to judge the extent of such opportunities. Thus, it is not obvious whether the recent leveling-off of trade relative to GDP should be a subject of concern.
Nevertheless, it is useful to try to understand what might be driving the slowdown in trade growth. This note provides some evidence for two possible contributors. First, as shown in panel 2, it appears that the rapid increase in the ratio of trade to output between the mid-1990s and the GFC was associated with a comparably large increase in participation in global value chains (GVCs), measured as described in Koopman et. al. (2010) using data from the WIOD input-input output tables.2 The input-output tables allow the value of each country's exports to be separated into the value that is added domestically and the value that added is added from imports. GVC participation is measured for each country from the import side as the total amount of foreign value-added from all source countries that is embodied in that country's exports, and from the export side as the total amount of value-added which that country's exports add to exports of all other countries, including value that gets passed to a third country.3 The overall measure of GVC participation for a country is the sum of these two amounts divided by that country's total exports. The aggregate measure is the sum over all countries.
GVCs involve the dispersion of production across borders, as some countries produce parts and components for assembly in other countries. These chains may also involve round-tripping, as is the case for car production in the United States and Mexico, in which components may cross borders several times before the final product is produced and exported. Such production arrangements thus generate more trade in goods per unit of final product than would be the case if all parts of the final product were made in a single country. As the chart indicates, GVC participation appears to have fallen sharply in the GFC and it had not re-attained its previous peak by 2011, the last year for which the data are available. Without more recent data it is impossible to determine the extent to which slower growth in GVCs might have contributed to the slowdown in global trade. However, less rapid-expansion in GVCs would be consistent with China's rebalancing away from dependence on export-led growth, as China is a major GVC hub.
Another factor that has been suggested as a contributor to the slowdown in growth of trade relative to GDP is a leveling-off of the investment share of global GDP (panel 3). The argument for a connection between the investment share and trade is that investment is associated with more trade in goods than is either consumption or government spending, and thus a lower investment share should correspond to a lower ratio of trade to GDP. These data are available through 2014, and they do show a sharp decline in the investment share of output in the GFC, followed by a bounceback and then much slower growth, similar to the behavior of the ratio of trade to GDP. Furthermore, this ratio has not re-attained its pre-recession peak. Of course, the behavior of the investment share is not necessarily separate from the development of value chains, as outsourcing of production in the 1995-2007 period may have played a part in the concurrent sizable increase in the investment share of global GDP.
To assess the relationship between the trade ratio and these factors more rigorously, I first regress the ratio of aggregate trade to GDP on GVC participation and the share of investment in output. These regressions suggest that the relationships are highly significant, although stronger for GVC participation than for investment. I then repeat the analysis for the 26 countries for which GVC data are available, both separately and in a panel regression. I find a very strong relationship between both of these variables and the trade ratios across countries, both separately and as a group.
These results may suggest that the slowdown in global trade should not necessarily be viewed, in and of itself, as a source of concern. Global value chains may have contributed to a more efficient allocation of resources across countries (although to the extent that they were driven by over-dependence on external demand in China, the re-allocation of resources may turn out not to have been efficient in the long run). However, there is no reason to believe that this process can or should continue indefinitely, or at as rapid a rate as it did before the crisis. Similarly, the leveling-off of the share of investment in global GDP follows a long period in which it trended upward, and at 24 percent it is still higher than its historical average (22.8 percent from 1970 to 2014).
| Figure 1: Global Aggregates |
|---|
 |
Sources: National accounts, World Input-Output Database, and International Monetary Funds World Economic Outlook. |
Regional Measures
Before discussing my regression results in more detail, I will first provide some information on regional developments in global value chain participation and investment trends.
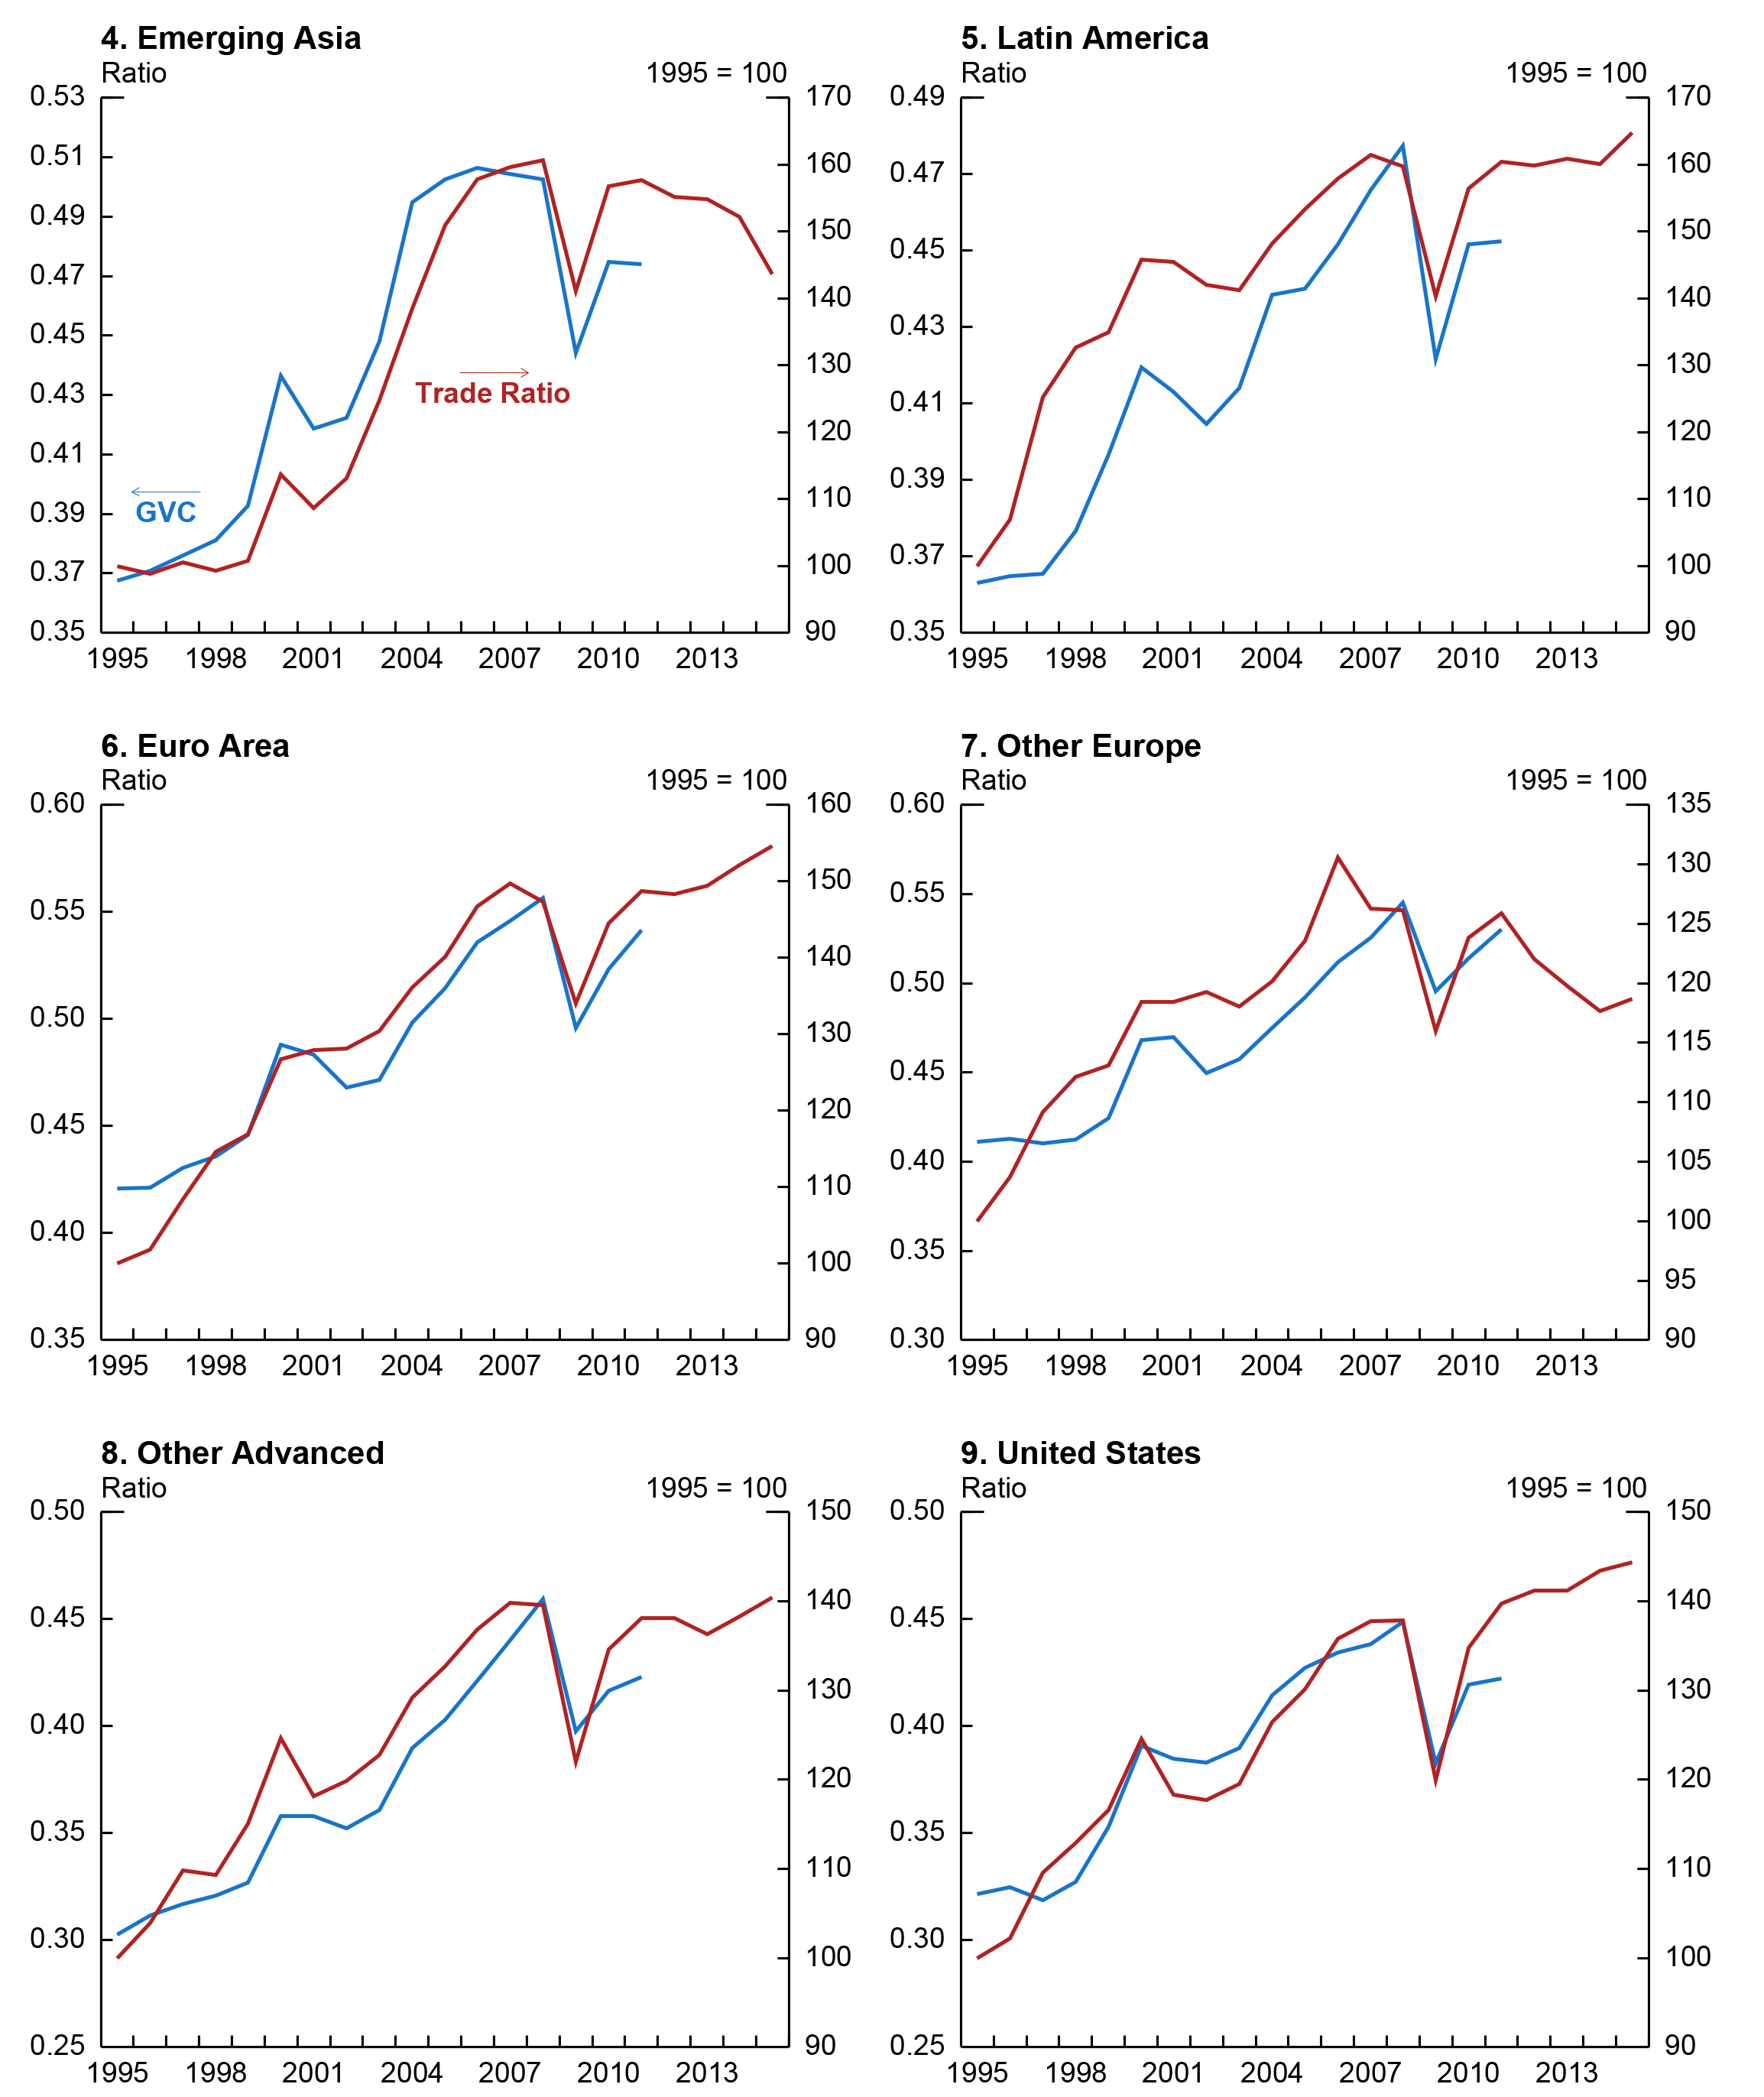
GVC participation is plotted along with the trade ratio for five groups of countries and the United States in exhibit 2. The pattern is remarkably consistent. All of the groupsemerging Asia, Latin America, the euro area, other advanced Europe, other advanced (Canada, Japan and Australia) and the United States saw both an increase in the trade ratio as well as a sharp increase in GVC participation over the period shown. Furthermore, GVC participation appears to have dropped sharply in all areas during the GFC and generally had not fully rebounded through 2011. Of course, this probably does not mean that countries that had been participating in value chains suddenly started producing all of the goods domestically. A more plausible explanation is that demand for the goods produced using value chains was hit especially hard. This would help to explain why trade contracted so much more sharply that did GDP (or even industrial production, as shown in exhibit 1, panel 1). However, the fact that GVC participation has only partly recovered in most regions does suggest that there may be a structural break with their pre-crisis rapid growth, consistent with China's push to rebalance its economy away from heavy dependence on manufacturing for export. Such a shift also affects China's regional trading partners.
Another noteworthy element of these charts is that the recent behavior of the ratio of trade to GDP differs substantially across groupings, in marked contrast to the very widespread increase in the ratio before the GFC. The ratio is falling in emerging Asia and other Europe, while continuing to rise in the euro area and the other advanced economies, as well as in the United States. In Latin America it has been mostly flat since the GFC, although it has turned up more recently.
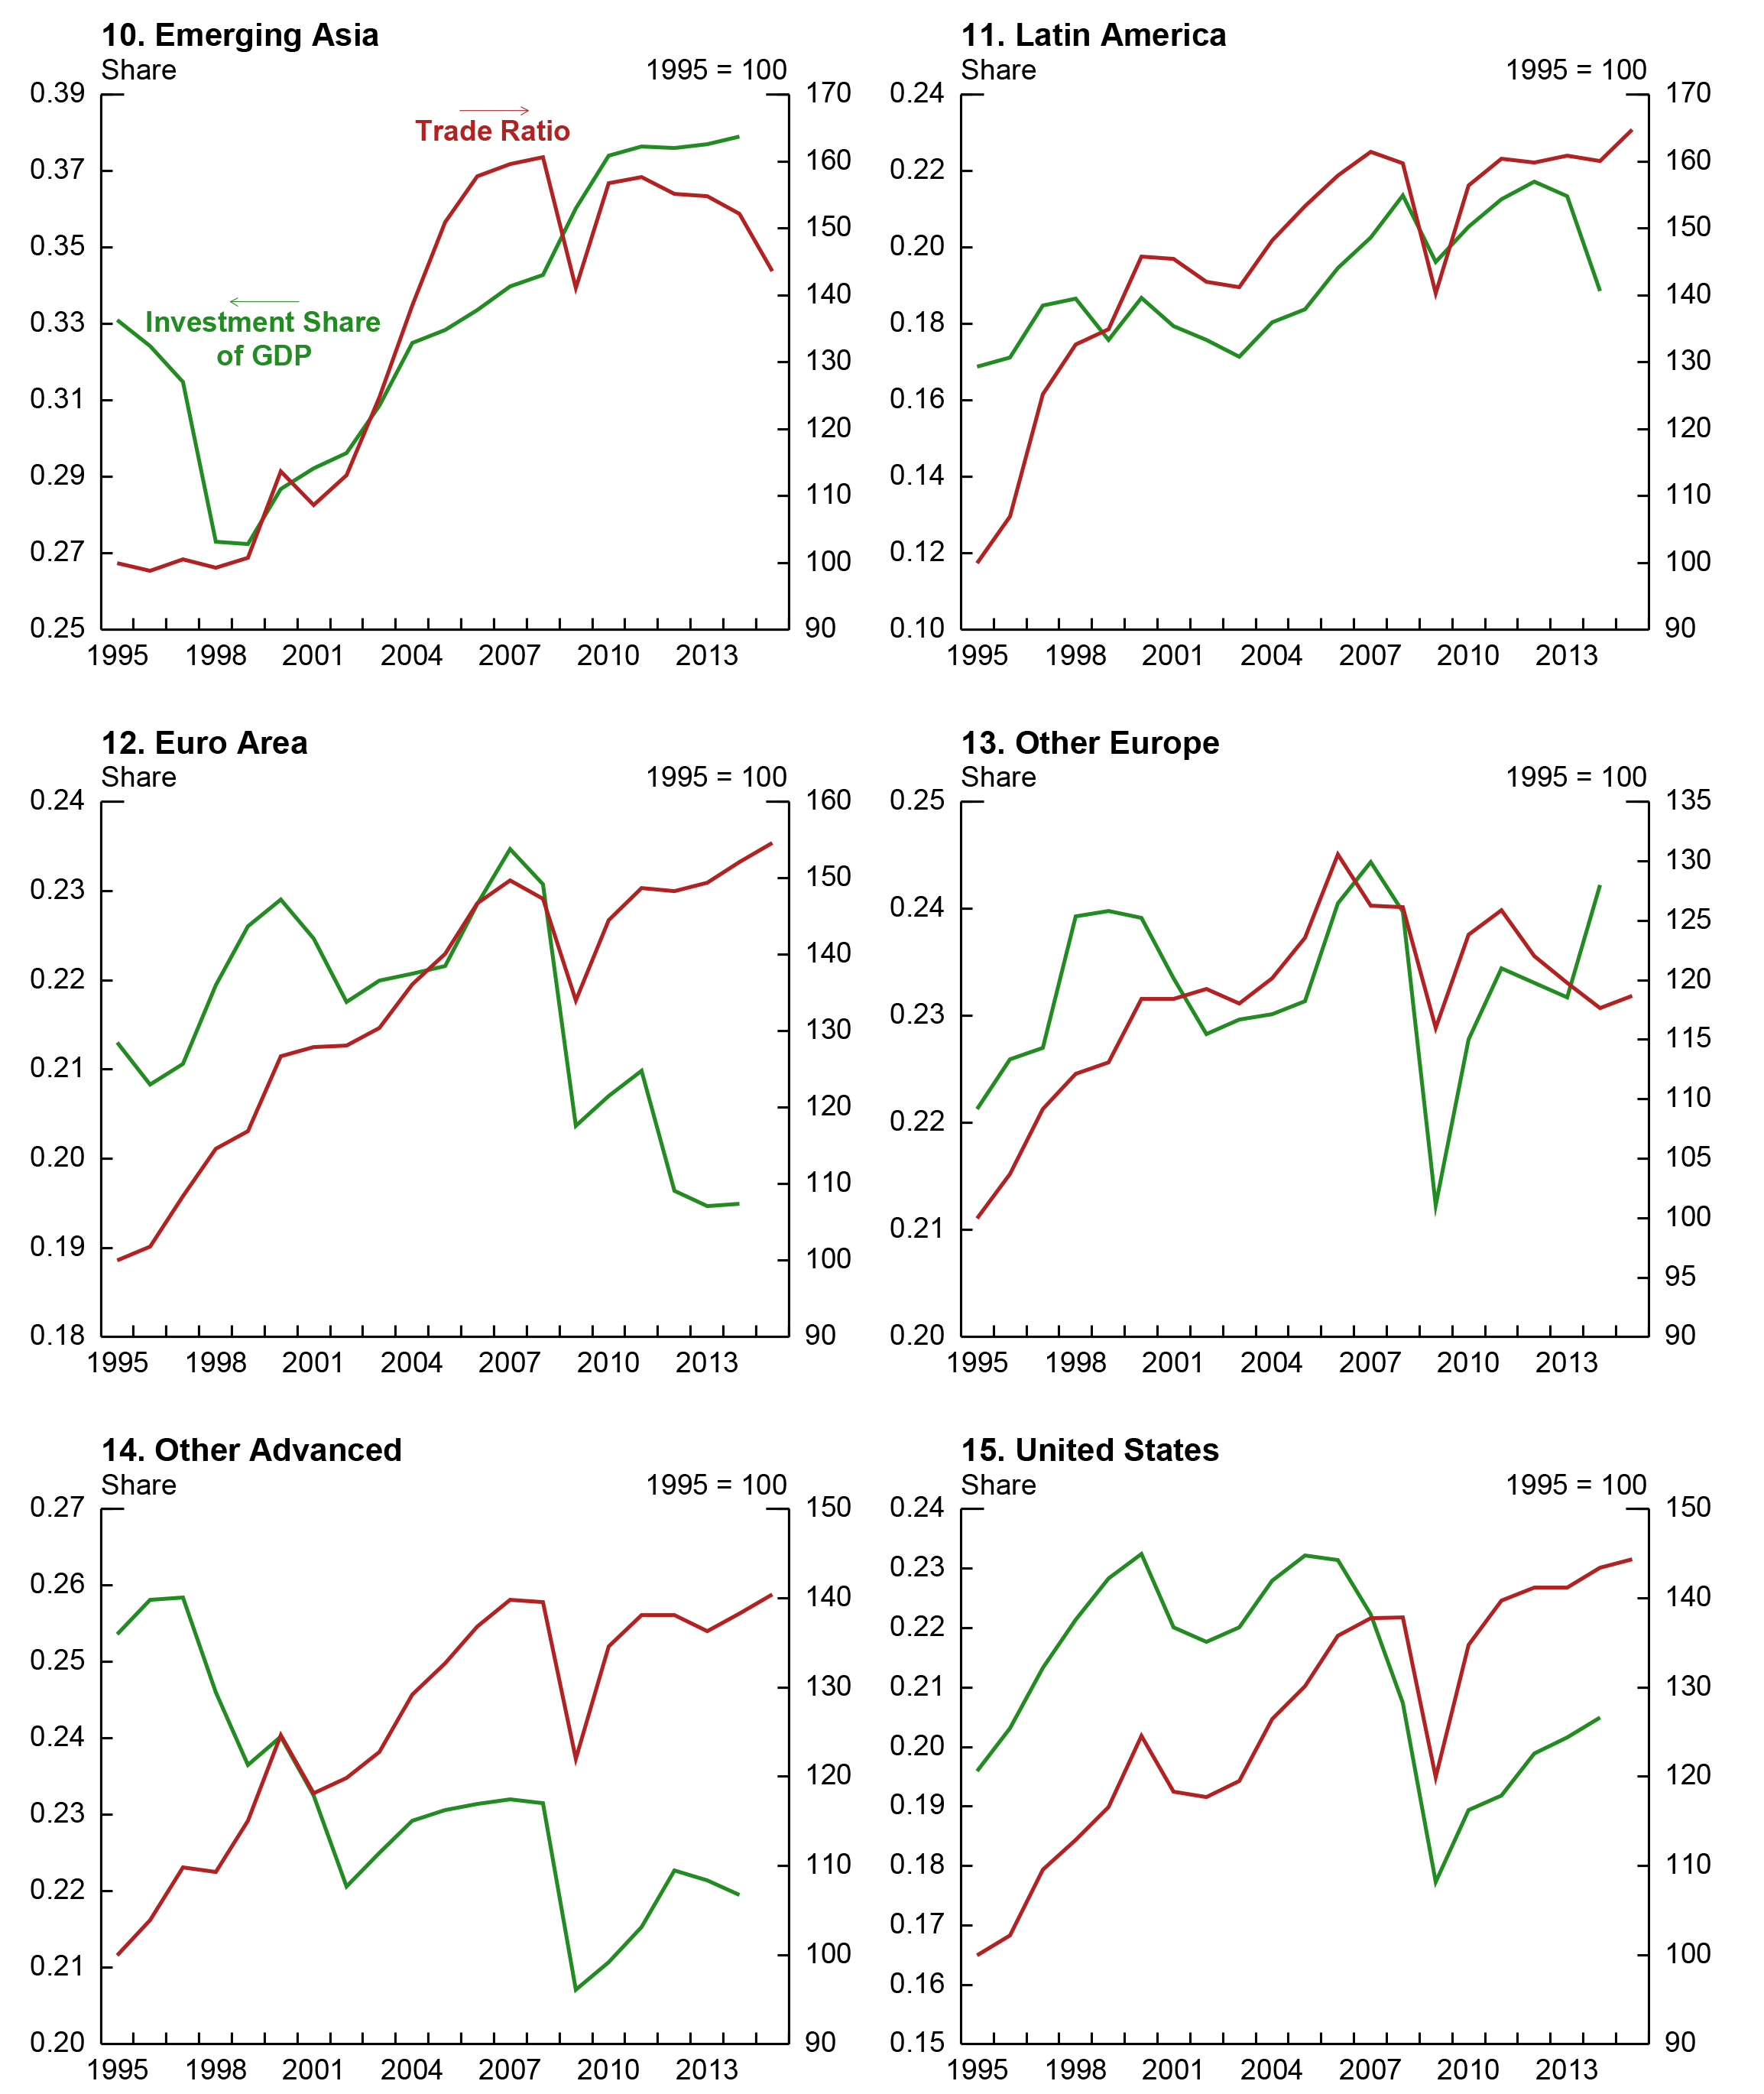
Exhibit 3 shows the trade ratio along with the investment share for the same country groupings. The investment share generally appears to be less highly correlated than GVC participation with the trade ratio, especially for emerging Asia, where it did not fall in the GFC. However, it has leveled off more recently as the trade ratio has fallen.
Regression Results
As shown in table 1 below, there appears to be a significant relationship between changes in the ratio of trade to output and both GVC participation and the share of investment in GDP. This is true for the aggregate measure whether output is measured as GDP or IP, although the sample size is small, especially for the GVC variable, which is available only from 1995 to 2011. However, a panel regression with country fixed effects over the 26 countries that have GVC data (thus a much larger sample size) shows very similar results. (These regressions are done using only the trade/GDP variable because not all of these countries have IP data.) Not surprisingly, the fit of these equations is not as good as it is for the aggregate equations. However, the GVC participation variable alone appears to explain nearly half of the variation in the trade ratio. This is also considerably more than is explained by the investment share alone (20 percent). When both variables are included in the equation, the R2 is only slightly higher than that of the equation that only includes the GVC participation variable, but more than twice as large as that for the equation that only includes the investment share variable.
Similar regressions were also estimated for each of the 26 countries in the sample separately (table 2). The value chain variable is significant for all of the countries and the investment share variable is significant for 19 of the 26. The coefficients on the value chain variables are particularly large for China, Taiwan, and Indonesia.
Conclusion
The results presented here support the view that the recent slowdown in the growth of global trade relative to GDP may be at least partly due to slower growth in global value chains, which expanded rapidly in the decade and a half preceding the global financial crisis. Slower growth in the global share of investment in GDP, which may be related to the declining role of global value chains, may also have played a role. This may suggest that the pause in trade relative to GDP is not a major cause for concern.
| Table 1 |
|---|
Aggregate Regressions
| Dep. Var. | Trade/GDP | Trade/IP | ||||
|---|---|---|---|---|---|---|
| Sample | 1996 - 2011 | 1981-2014 | 1996 - 2011 | 1981-2014 | ||
| Expl. Var. | GVC | I/GDP | I/GDP | GVC | I/GDP | I/GDP |
| 0.9 | 1.38 | 1.12 | 0.49 | 0.7 | 0.51 | |
| R2 | 0.77 | 0.79 | 0.63 | 0.63 | 0.55 | 0.3 |
Panel Regression
| Trade/GDP | |||||
|---|---|---|---|---|---|
| Sample | 1996 - 2011 | 1981-2014 | |||
| Expl. Var. | GVC | I/GDP | Multivariate equation | I/GDP | |
| GVC | I/GDP | ||||
| 0.83 | 0.35 | 0.74 | 0.16 | 0.09 | |
| R2 | 0.45 | 0.2 | 0.07 | ||
Equations are estimated in log first differences. All coefficients are significant at the 1 percent level.
| Table 2 |
|---|
Individual Country Regressions
| Expl. Var. | GVC | I/GDP | Expl. Var. | GVC | I/GDP | ||||
|---|---|---|---|---|---|---|---|---|---|
| Coeff | R2 | Coeff | R2 | Coeff | R2 | Coeff | R2 | ||
| United States | .81* | 0.72 | .91* | 0.82 | Ireland | .86* | 0.42 | 0.12 | 0.06 |
| Canada | .70* | 0.42 | .56* | 0.44 | Italy | .75* | 0.83 | 1.08* | 0.63 |
| Japan | .90* | 0.69 | 1.25* | 0.56 | Netherlands | .75* | 0.63 | 0.29 | 0.07 |
| Australia | .39* | 0.53 | .40# | 0.18 | Portugal | .72* | 0.58 | .39+ | 0.3 |
| United Kingdom | .56+ | 0.26 | .59* | 0.48 | Spain | .84* | 0.76 | .61+ | 0.34 |
| Sweden | .94* | 0.58 | .71* | 0.65 | China | 1.32* | 0.64 | -0.39 | 0.01 |
| Denmark | .52* | 0.35 | .44* | 0.63 | Korea | .70* | 0.4 | .30* | 0.52 |
| Austria | 1.21* | 0.81 | .90+ | 0.26 | Taiwan | 1.25* | 0.71 | .66* | 0.89 |
| Belgium/Lux | .40# | 0.2 | 0.24 | 0.11 | India | .82+ | 0.34 | -0.15 | 0.03 |
| Finland | .94* | 0.59 | .85* | 0.6 | Indonesia | 2.04* | 0.56 | 0.68 | 0.17 |
| France | .81* | 0.73 | .77* | 0.57 | Brazil | .61* | 0.36 | .60+ | 0.25 |
| Germany | .81* | 0.77 | .57* | 0.49 | Mexico | .99+ | 0.31 | .94* | 0.43 |
| Greece | .39+ | 0.59 | .35* | 0.4 | Russia | .47+ | 0.31 | 0.09 | 0.13 |
*significant at 1% level, + significant at 5% level, # significant at 10% level.
References
Amador, Joao and Sonia Cabral, "Global Value Chains: Surveying Drivers and Measures," ECB Working Paper 1739, 2014.
Antras, Po and Davin Chor, "Organizing the Global Value Chain," NBER Working Paper 18163, 2012.
Bems, Rudolfs, and Robert Johnson, "Value-Added Exchange Rates," NBER Working Paper 18498, 2012.
Chen, Hogan, Matthew Kondratowicz, and Kei-Mu Yi, "Vertical Specialization and Three Facts about U.S. International Trade," North American Journal of Economics and Finance, 16: 35-39, 2005.
Daudin, Guillaume, Christine Rifflart, and Danielle Schweisguth, "Who Produces for Whom in the World Economy?" Canadian Journal of Economics, 2011.
Dietzenbacher, E., B. Los, R. Stehrer, M.P. Timmer and G.J de Vries, "The Construction of World Input-Output Tables in the WIOD Project," Economic Systems Research, 25, 71-98, 2013.
Fally, Thibault, "On the Fragmentation of Production in the US," 2011.
Feenstra, R.C., and G.H. Hanson, "Globalization, Outsourcing, and Wage Inequality," American Economic Review 86(20), 240-45, 1996.
Georgiadis, Georgios, Johannes Grab, and Fabian Trottner, "Global Chain Participation and Current Account Imbalances," December 2014.
Hummels, David, Jun Ishii, and Kei-Mu Yi, "The Nature and Growth of Vertical Specialization in World Trade," Journal of International Economics, Vol. 54(1), 2001.
IMF, "Trade Interconnectedness: The World With Global Value Chains," 2013.
Johnson, Robert, "Five Facts about Value-Added Exports and Implications for Macroeconomics and Trade Research," Journal of Economic Perspectives, 2014.
Johnson, Robert, and Guillermo Noguera, "Fragmentation and Trade in Value Added Over Four Decades," NBER Working Paper 18186, 2012.
Johnson, Robert, and Guillermo Noguera, "Accounting for Intermediates: Production Sharing and Trade in Value Added," Journal of International Economics, 2011.
Koopman, Robert, William Powers, Zhi Wang, and Shang-Jin Wei, "Give Credit Where Credit is Due: Tracing Value Added in Global Production Chains," NBER Working paper 16426, 2010.
Koopman, Robert, Zhi Wang, and Shang-Jin Wei, "How Much of Chinese Exports is Really Made in China? Assessing Domestic Value-Added When Processing Trade is Pervasive," NBER Working paper 14109, 2008.
Lejour, Arjan, Hugo Rojas-Romagosa and Paul Veenendall, "Identifying Hubs and Spokes in Global Supply Chains Using Redirected Trade in Value Added," ECB Working Paper 1670, 2014.
Matras, Chor, D., Fally, T., and Hillberry, H., "Measuring the Upstreamness of Production and Trade Flows," NBER Working Paper 17819, February 2012
Riad, Nagwa, Luca Errico, Christian Henn, Christian Saborowski, Mika, and Jarkko, Turunen, "Changing Patterns of Global Trade," IMF, 2012.
Timmer, M. P., Erumban, A., Los, B., Stehrer, R., and de Vries, G., Slicing Up Global Value Cahins," Journal of Economic Perspectives 28(2), 99-118, 2014.
Timmer, M. P., Dietzenbacher, E., Los, B., Stehrer, R., and de Vries, G.J., "An Illustrated Guide to the World Input-Output Database: The Case of Global Automotive Production," Review of International Economics, 23: 575-605, 2015.
1. This note refers to trade in goods. Trade in services is much more difficult to measure across countries. Return to text
2. Timmer et. al (2015). Return to text
3. This is done by inverting the global input-output table. Return to text
Please cite as:
Haltmaier, Jane (2015). "The Slowdown in Global Trade," IFDP Notes. Washington: Board of Governors of the Federal Reserve System, December 30, 2015. https://doi.org/10.17016/2573-2129.13
Disclaimer: IFDP Notes are articles in which Board economists offer their own views and present analysis on a range of topics in economics and finance. These articles are shorter and less technically oriented than IFDP Working Papers.
