
IFDP Notes
 Print
PrintDecember 30, 2016
Drivers of Inflation Compensation: Evidence from Inflation Swaps in Advanced Economies1 (PDF)
Marius Rodriguez and Emre Yoldas
Summary
Central banks closely monitor survey- and market-based indicators of inflation expectations.2 The latter category is usually referred to as inflation compensation because, in addition to expected inflation, such measures contain risk premiums that reflect compensation required by market participants for taking on risks associated with inflation-related outcomes. A direct reading on inflation compensation can be obtained from inflation swaps, which are liquid financial derivatives.3 In this note, we provide a comparative analysis of inflation swaps for three advanced economies: the United States, the euro area, and the United Kingdom.4 We consider empirical proxies for energy prices, economic activity, exchange rates, and risky asset prices as potential drivers of inflation expectations and risk premiums in a regression framework.
We find that there is a striking difference in the relationship of oil prices with medium- versus long-term inflation compensation measures. Oil prices are an important common driver of medium-term inflation compensation across all of the advanced economies in our sample. In contrast, movements in long-term measures cannot typically be attributed to changes in oil prices. Nonetheless, our rolling-sample estimates suggest that the relationship between oil prices and long-term inflation compensation measures becomes economically and statistically significant during certain times, including most of 2016. This behavior likely reflects factors such as the signal in oil prices regarding the health of the global economy and the downward pressure on inflation that cannot be easily alleviated by central banks due to the effective lower bound on interest rates.5
The effects of economic news surprises and exchange rates on inflation compensation show significant variation across the advanced economies in our sample. The rolling-sample estimates indicate that U.S. inflation compensation measures became less sensitive to economic news and movements in the exchange value of the dollar after the Federal Reserve adopted a formal inflation target in 2012. In contrast, against the backdrop of the sovereign debt crisis, subdued growth, and a prolonged period of monetary accommodation, the euro-area measures became more sensitive to such factors in recent years despite the presence of a long-established inflation target that helps anchor expectations.
The role of inflation risk premiums increased for both the medium- and long-term inflation compensation measures after the global financial crisis. On balance, investors have been willing to pay more to insure against low inflation outcomes in an environment of subdued economic growth and highly accommodative monetary policies of advanced-economy central banks. Such considerations may have become less prevalent in investors' assessments of inflation risks in the second half of 2016 as inflation compensation measures moved up notably. Indeed, our regression analysis indicate that the reversal in inflation risk premiums played a significant role in the rise of U.S. inflation compensation over this period. In contrast, higher oil prices and an improved economic outlook predominantly account for the predicted increase for the euro-area.
Inflation Swaps
Inflation-linked bonds and inflation derivatives represent the broad class of securities where payoffs are directly affected by realized inflation. Inflation swaps make up the largest inflation derivative segment with respect to both the number of trades and notional volumes.6 We concentrate on zero-coupon inflation swaps in our analysis because of their greater liquidity. A zero-coupon inflation swap is an instrument where two parties agree to exchange some cash flows at a specific time in the future, usually referred to as the maturity of the contract, with the notional amount specifically adjusted for inflation. The buyer pays a pre-specified rate at maturity with respect to the notional amount of the contract, whereas the seller pays the accrued inflation.7 Similar to other common forms of over-the-counter swap contracts, only net cash flows change hands at maturity—that is, the difference between the pre-specified rate and the actual inflation rate is applied to the notional contract amount to determine the exact payout.
The inflation measures underlying zero-coupon inflation swaps are generally based on non-seasonally-adjusted consumer price indexes that capture headline inflation. In particular, the Consumer Price Index for all Urban Consumers (CPI-U) for the United States, the Harmonized Index of Consumer Prices excluding tobacco (HICPx) for the euro area, and the retail price index (RPI) for the United Kingdom are used. The RPI gives a smaller weight to energy prices than CPI-U and HICPx. In addition, the U.S. dollar pricing of oil and differences in the tax systems for motor fuel between the United States and Europe may lead to different sensitivity to oil prices across the regions.
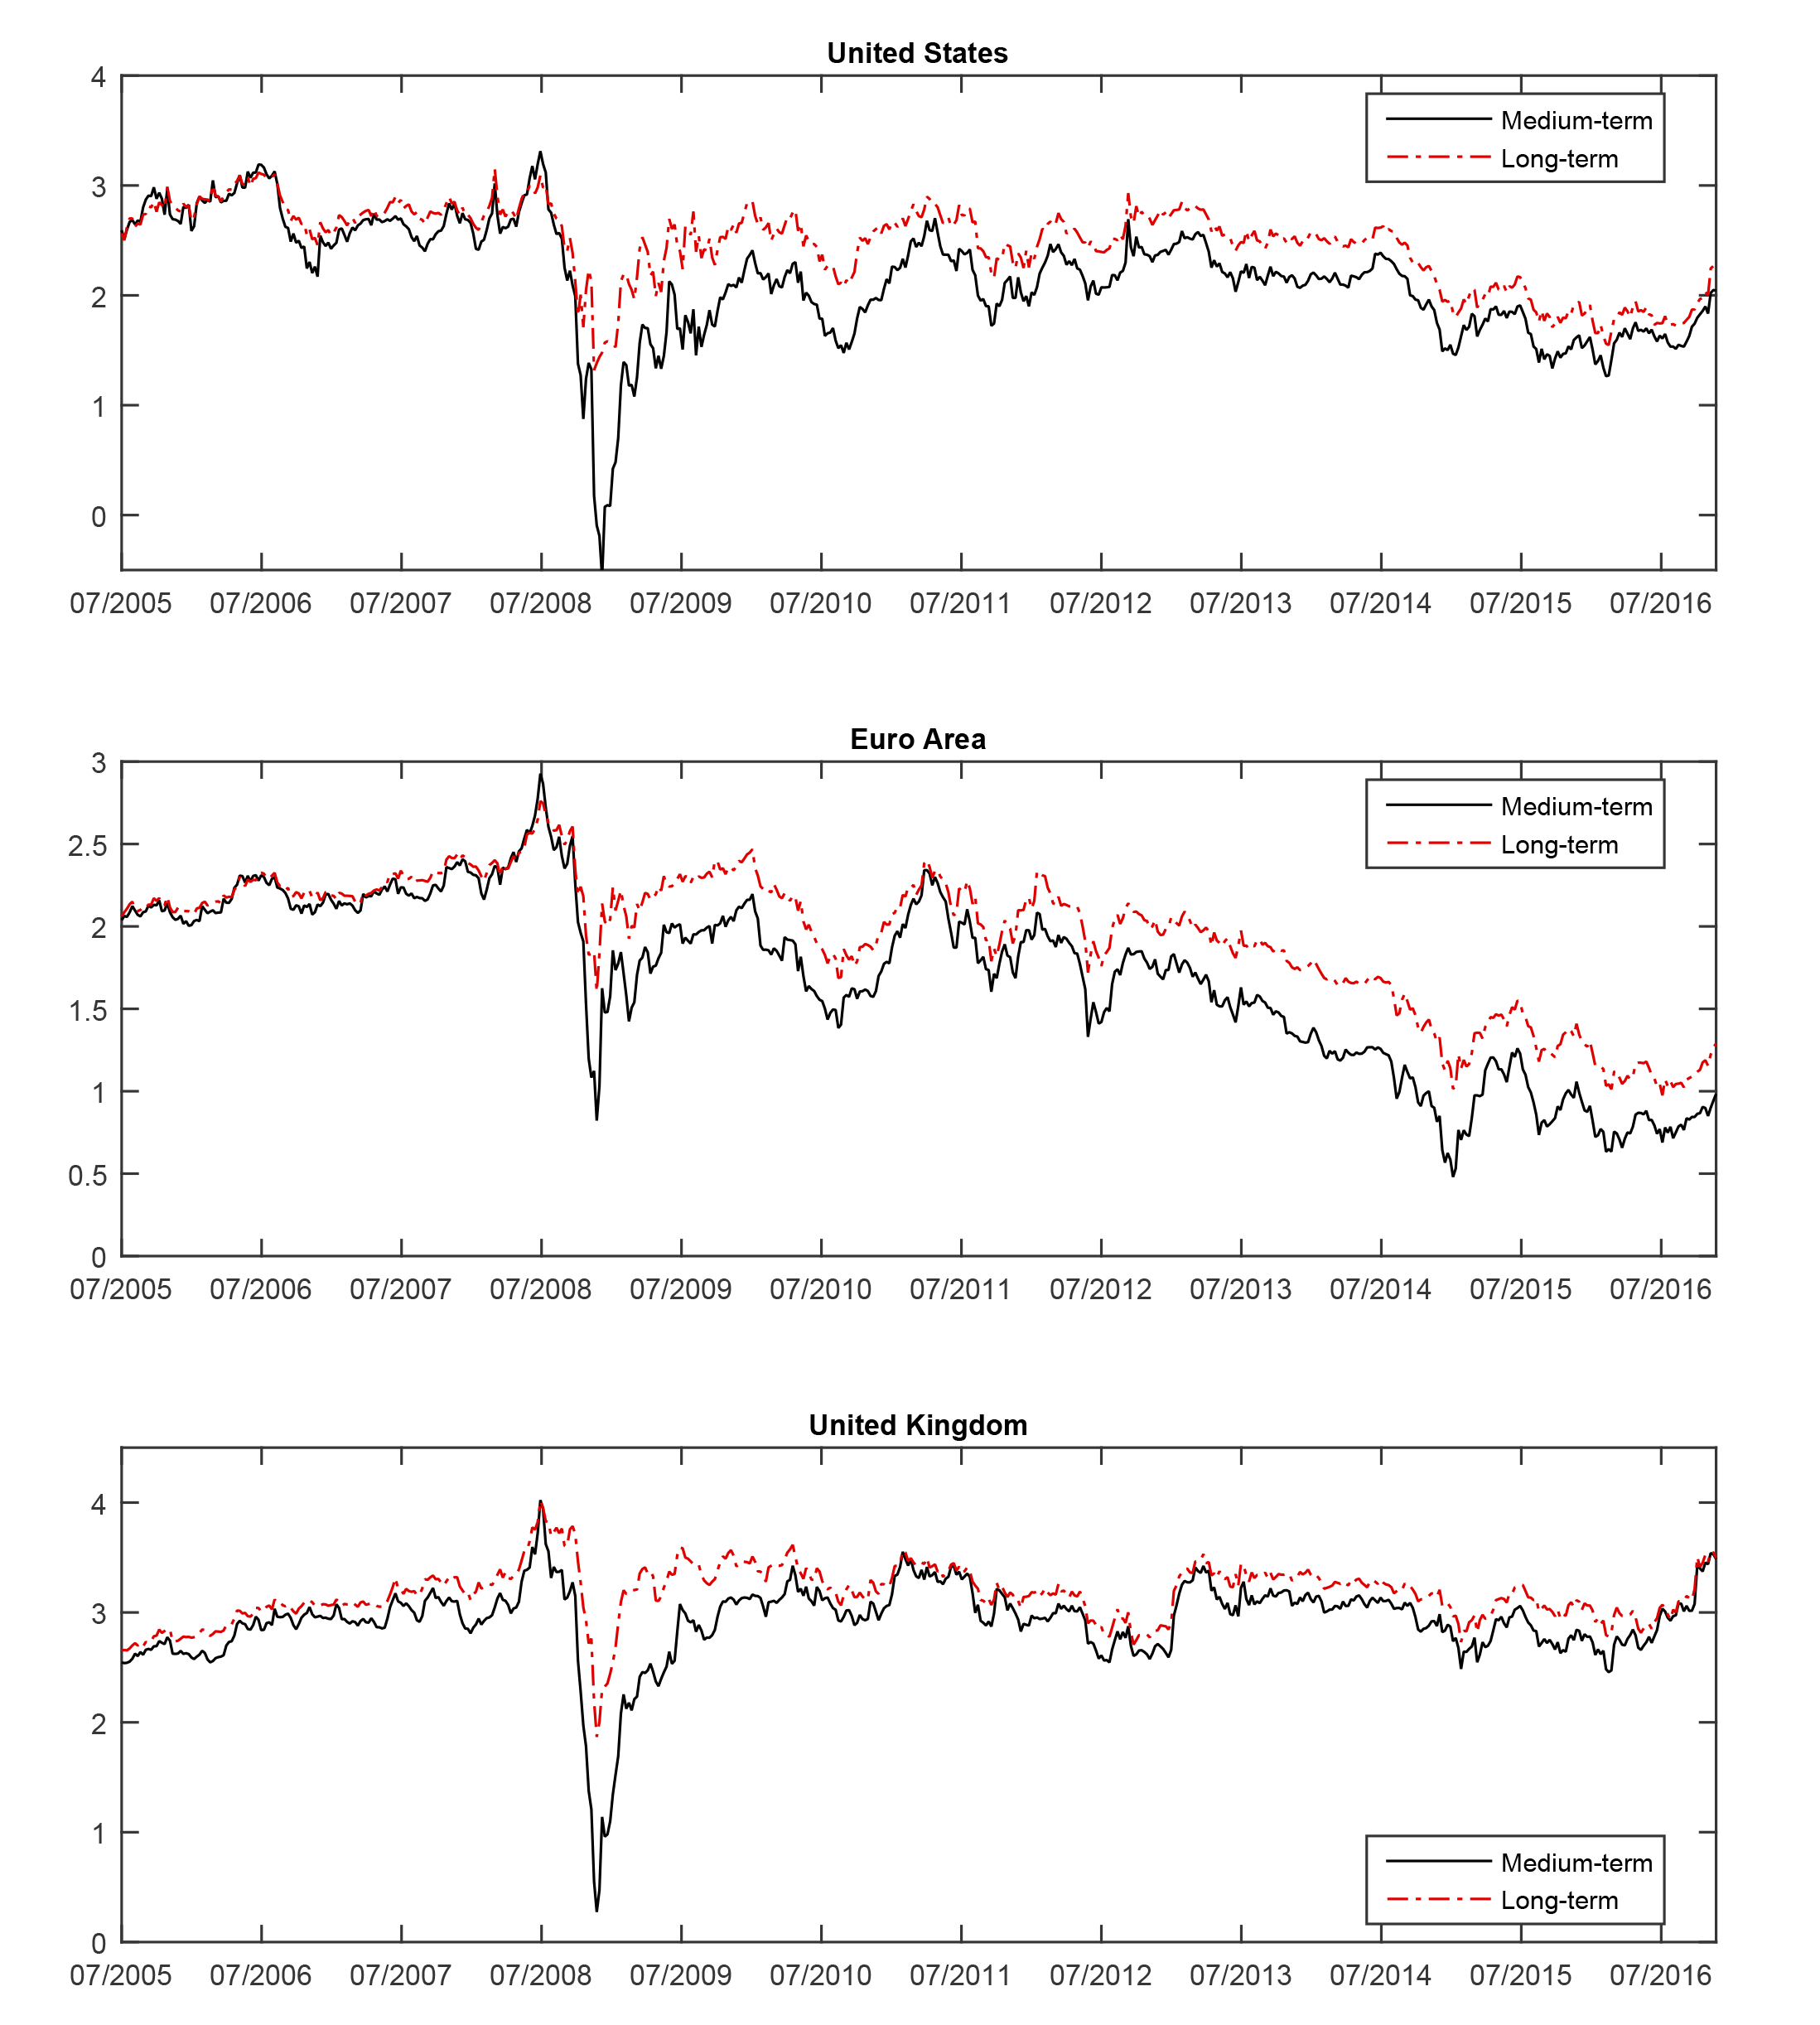
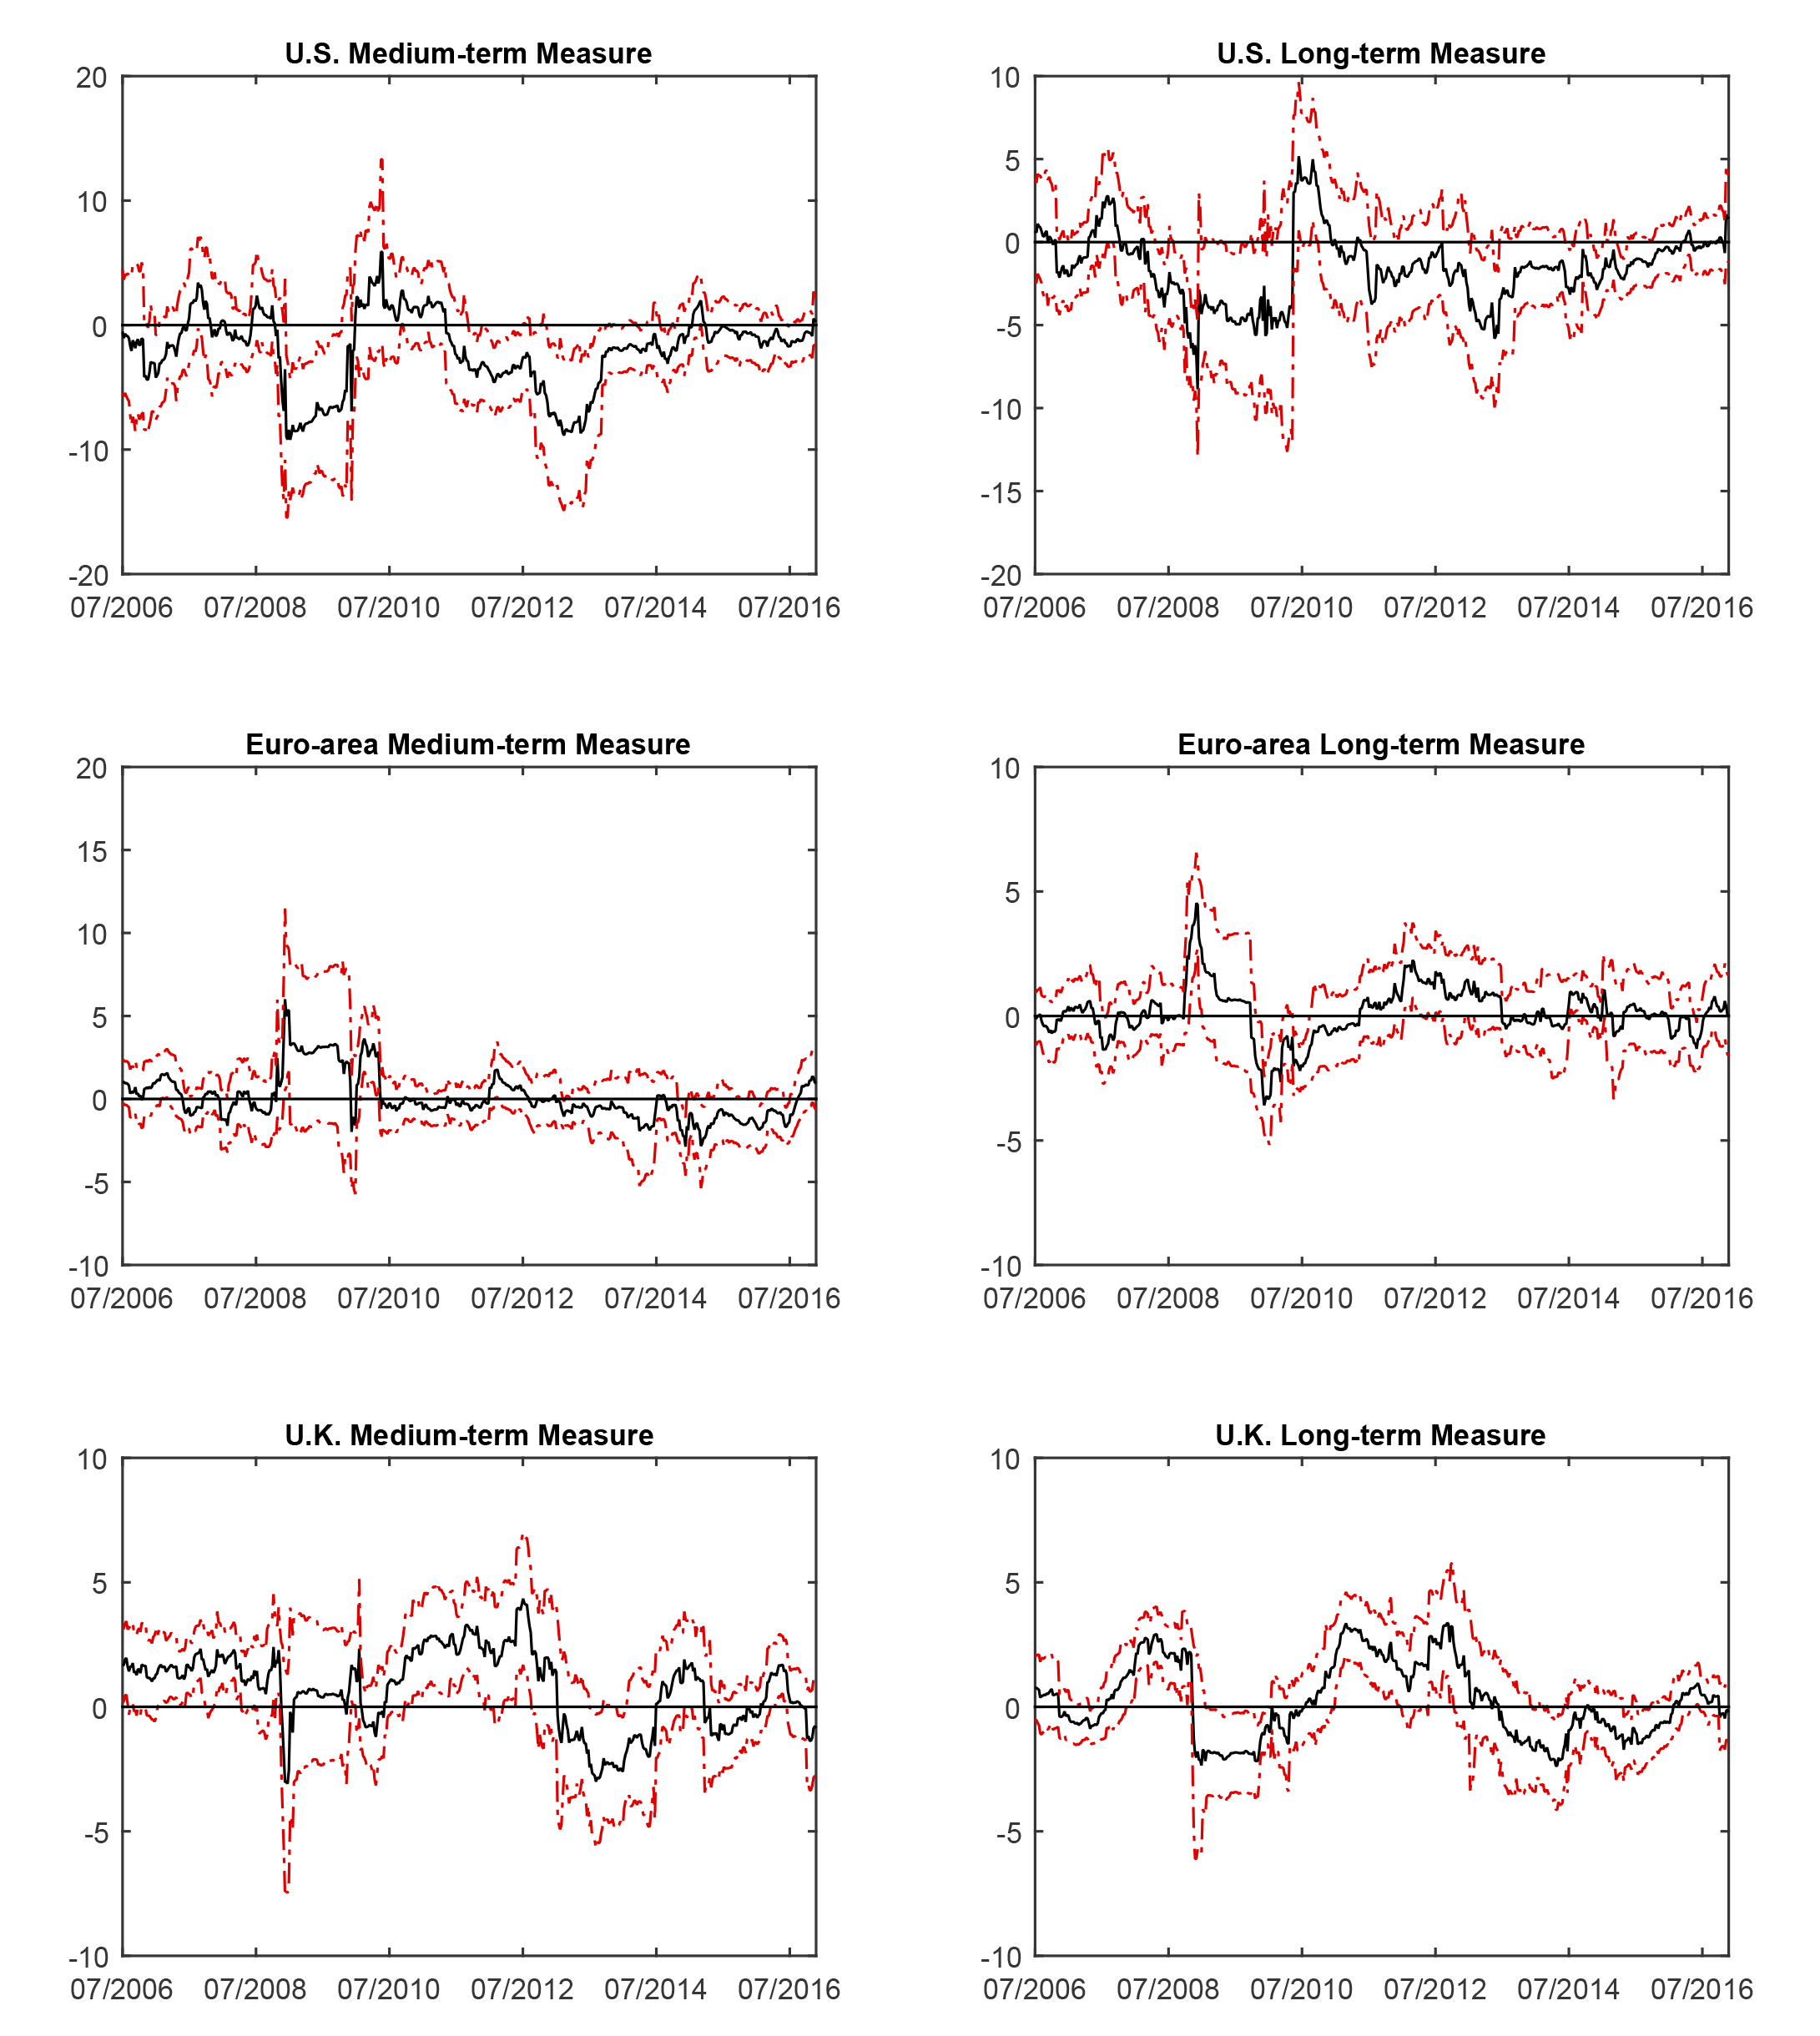
Because we aim to analyze both medium- and long-term inflation compensation dynamics, we focus on swaps with 5- and 10-year maturities, which are also typically the most actively traded contracts. We take the 5-year inflation swap rate as the medium-term measure. Our long-term measure is the 5- to 10-year-ahead inflation compensation implied by the two contracts, commonly referred to as the 5-year, 5-year forward inflation rate.8 This measure isolates transitory fluctuations in inflation, such as those driven by volatile food and energy prices; therefore, it is of particular importance to gauge whether market participants' long-term inflation expectations are anchored. Figure 1 shows the two measures at a weekly frequency from July 1, 2005 to November 25, 2016, the sample period subject to our analysis. As can be seen from the figure, inflation compensation in advanced economies registered a notable increase the second half of 2016. Nonetheless, the long-term inflation compensation measures for the United States and the euro area remain below their respective mid-2014 levels.
 |
|
Notes: Data are weekly (as of Friday) from July 1, 2005, to November 25, 2016.
Drivers of Inflation Compensation Measures
Inflation compensation measures are composed of inflation expectations and risk premiums. Expectations over short to medium horizons are largely affected by the level of economic activity, energy prices, and exchange rates, among other factors. In contrast, long-term inflation expectations are largely driven by the perceived credibility of central banks' price stability objectives. Both medium- and long-term inflation compensation are likely affected by the risk premiums that reflect either a changing probability distribution of inflation outcomes or the cost investors attach to them. We perform a regression analysis to capture these dynamics empirically with proxies for the aforementioned potential drivers.
We include four explanatory variables in our regressions. The first is the percent change in the Brent spot oil price, which constitutes a key component of energy prices. The remaining variables are all region specific. We use the change in the Citigroup Economic Surprise Index as a proxy for macroeconomic performance relative to expectations. The third variable is the percent change in a broad exchange rate index, which allows us to capture potential effects of import prices on inflation dynamics.9 Finally, we include the return on a broad stock market index as a measure of change in risky financial asset prices. Under the assumption that we capture variation in economic fundamentals with the first three variables, this component reflects the systemic-risk-driven part of inflation compensation, the inflation risk premium.10
Table 1 summarizes full-sample regression results, and figures 2 through 6 show results from rolling regressions with a one-year window. The regressions have significantly more explanatory power for the medium-term measures, likely because long-term inflation expectations are better anchored (table 1). The European Central Bank and the Bank of England had inflation goals well before the start of our sample period; in contrast, the Federal Reserve adopted an inflation target in 2012. Correspondingly, the model accounts for a notably higher proportion of variation in U.S. inflation compensation measures compared with those of the euro area and United Kingdom.11 Indicators of realized inflation in advanced economies have been persistently below target levels amid a substantial drop in oil prices since mid-2014, on net, and some market participants questioned the ability of the central banks to reach their inflation targets over the medium term. Against this backdrop, the explanatory power of the regressions has been high relative to the longer-run norms for most of 2016 and has declined only recently (figure 2).
| Panel A: Medium-term Measures | Panel B: Long-term Measures | |||||
|---|---|---|---|---|---|---|
| U.S. | Euro area | U.K. | U.S. | Euro area | U.K. | |
| Constant | -0.126 (0.42) |
-0.177 (0.26) |
0.178 (0.44) |
-0.067 (0.30) |
-0.094 (0.17) |
0.096 (0.25) |
| Oil price | 0.424* (0.24) |
0.412*** (0.08) |
0.51*** (0.11) |
0.144 (0.12) |
-0.046 (0.09) |
0.125* (0.08) |
| Economic news | 0.112*** (0.04) |
0.038 (0.02) |
-0.028 (0.02) |
0.022 (0.04) |
0.01 (0.02) |
-0.003 (0.02) |
| Exchange rate | -2.722*** (1.05) |
0.275 (0.56) |
0.469 (0.66) |
-1.896** (0.79) |
0.113 (0.40) |
-0.685 (0.50) |
| Stock prices | 1.043*** (0.25) |
0.455*** (0.17) |
0.465** (0.23) |
0.947*** (0.26) |
0.454*** (0.10) |
0.107 (0.15) |
| Adjusted R2 | 0.218 | 0.153 | 0.11 | 0.141 | 0.057 | 0.016 |
Notes: Weekly (as of Friday) data run from July 1, 2005, to November 25, 2016. Changes in inflation compensation measures are in basis points. Newey-West HAC standard errors are reported in parentheses. *, **, and *** indicate statistical significance at 90%, 95%, and 99% confidence levels, respectively.
 |
|
Notes: Adjusted R-squared from rolling regressions with a one-year window.
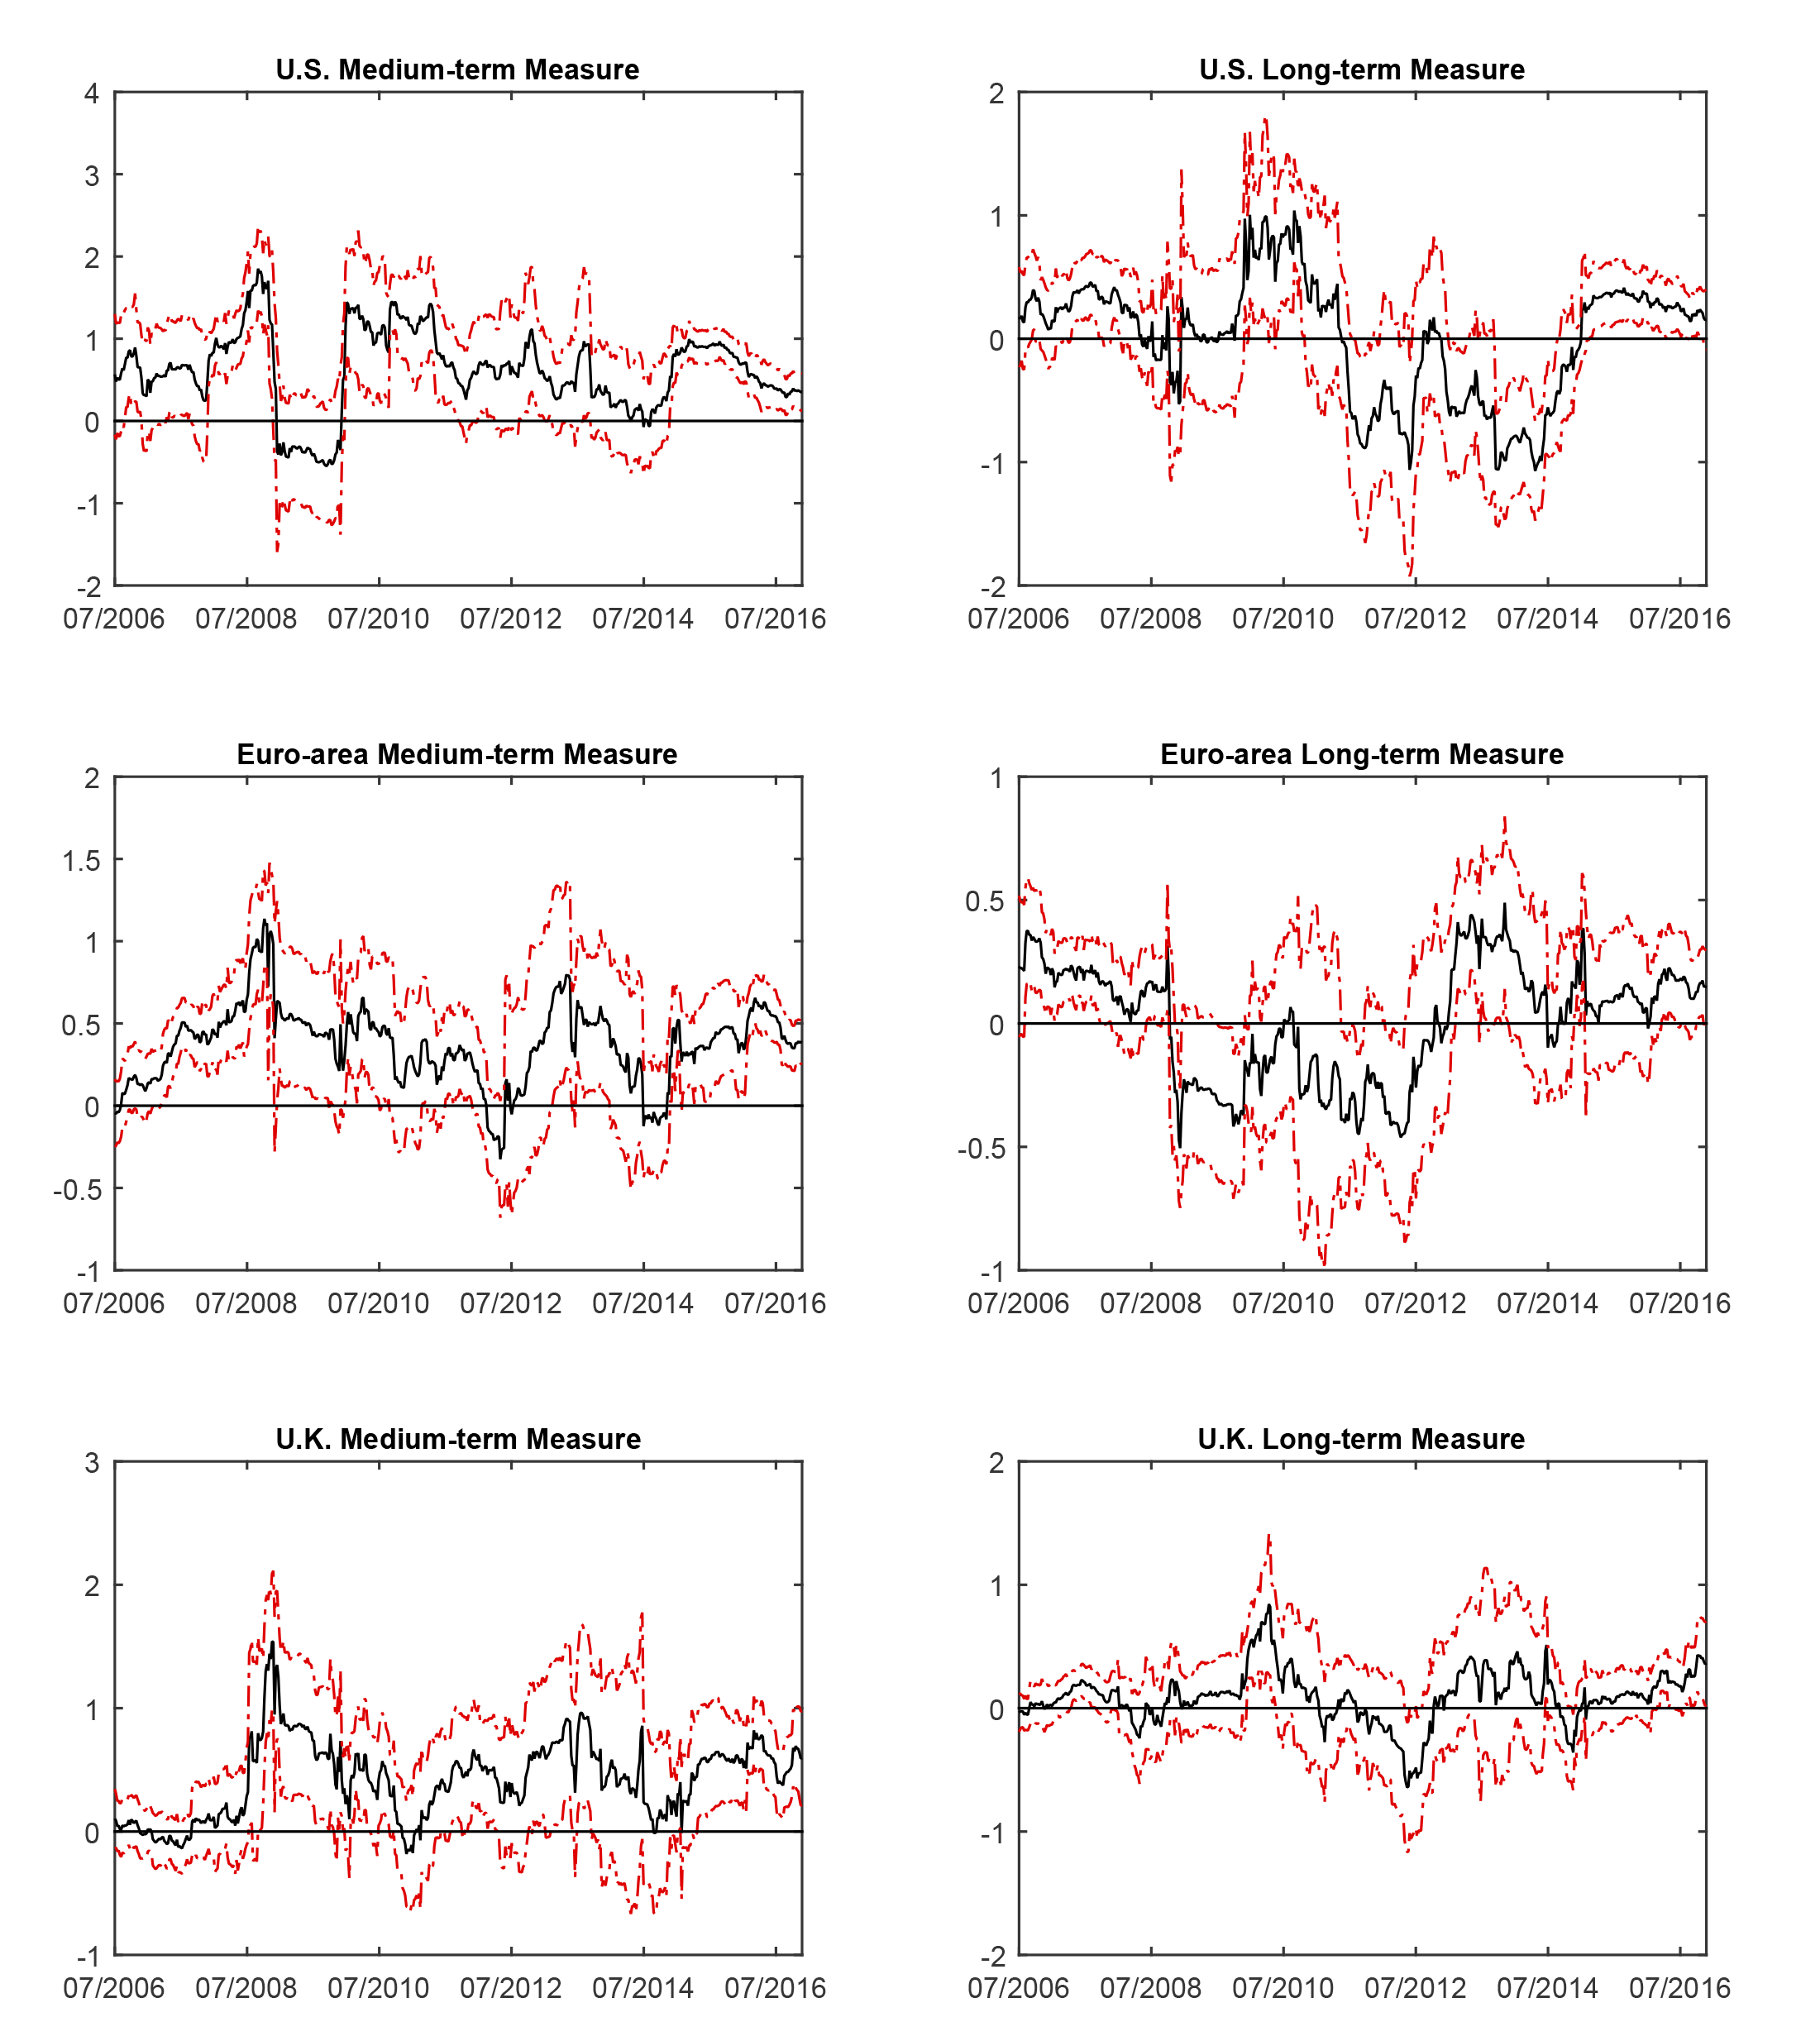
The coefficient of the oil price change is both economically and statistically significant for the medium-term measures across the advanced economies in the full-sample regressions. In particular, a 10 percent increase in the oil price predicts about a 4 to 5 basis point rise in the medium-term inflation compensation. After trending up for about two-years beginning from mid-2014, the sensitivity of the medium-term measures to the oil price declined somewhat in the second half of 2016, on net, but continues to be significant (figure 3).
As expected, movements in long-run inflation compensation cannot typically be attributed to oil price changes. However, rolling estimates have been positive and significant during most of 2016, perhaps reflecting a combination of the negative effects of lower oil prices on global demand through oil-exporting countries and the prolonged period of monetary accommodation by advanced economy central banks, which arguably left limited room for further monetary easing to combat falling inflation. Against the backdrop of higher oil prices and firming of actual inflation, the sensitivity of the long-term measures to oil price changes recently declined.
 |
|
Notes: Black lines show point estimates for the coefficient of the return on a broad stock index, and dotted-red lines are 90 percent confidence bands based on Newey-West HAC standard errors.
The relationship between macroeconomic news and inflation compensation measures exhibit significant variation across regions and over time. On average, economic news surprises have a modest but statistically significant effect on the U.S. medium-term measure. Interestingly, following the adoption of a formal inflation target by the Federal Reserve in 2012, the coefficient declined and became statistically insignificant on net (figure 4). In contrast, although full-sample results indicate no meaningful relationship for the euro area, estimates for most of 2016 are consistent with a modest and positive effect from economic news. Moreover, even the long-term measure for the euro area became sensitive to economic news of late. A similar observation applies to the long-term inflation compensation in the United Kingdom, These results suggest an increased sensitivity of inflation compensation to macroeconomic news outside the United States, especially the euro area amid slow growth and a prolonged period of low policy rates.
 |
|
Notes: Black lines show point estimates for the coefficient of the return on a broad stock index, and dotted-red lines are 90 percent confidence bands based on Newey-West HAC standard errors.
Other things being equal, a stronger domestic currency is expected to weigh on inflation through lower import prices.12 Consistent with this idea, the full-sample estimates of the coefficient of the broad dollar index in the medium-term inflation compensation equation is negative and statistically significant. On average, a 1 percent appreciation of the dollar is associated with a 3 basis point decrease in the medium-term inflation compensation. However, similar to the case of macroeconomic news surprises, the estimated sensitivity noticeably declined over the past five years (figure 5). Interestingly, until the adoption of a formal inflation target, the dollar had been exerting a similar effect on the long-term U.S. inflation compensation.
 |
|
Notes: Black lines show point estimates for the coefficient of the return on a broad stock index, and dotted-red lines are 90 percent confidence bands based on Newey-West HAC standard errors.
Response of inflation compensation measures to the trade-weighted exchange rates is quite different in the euro area and the United Kingdom compared with the United States. For the euro area, the effects are negligible in both the full-sample and the rolling regressions. In case of the United Kingdom, the relationship appears to be state dependent for both the medium- and long-term measures. In addition, the estimated partial effects have been small over the past few years, with relatively large confidence bands. Following the Brexit referendum, the medium-term inflation compensation became more sensitive to the exchange value of the pound, but there is significant uncertainty surrounding these estimates.
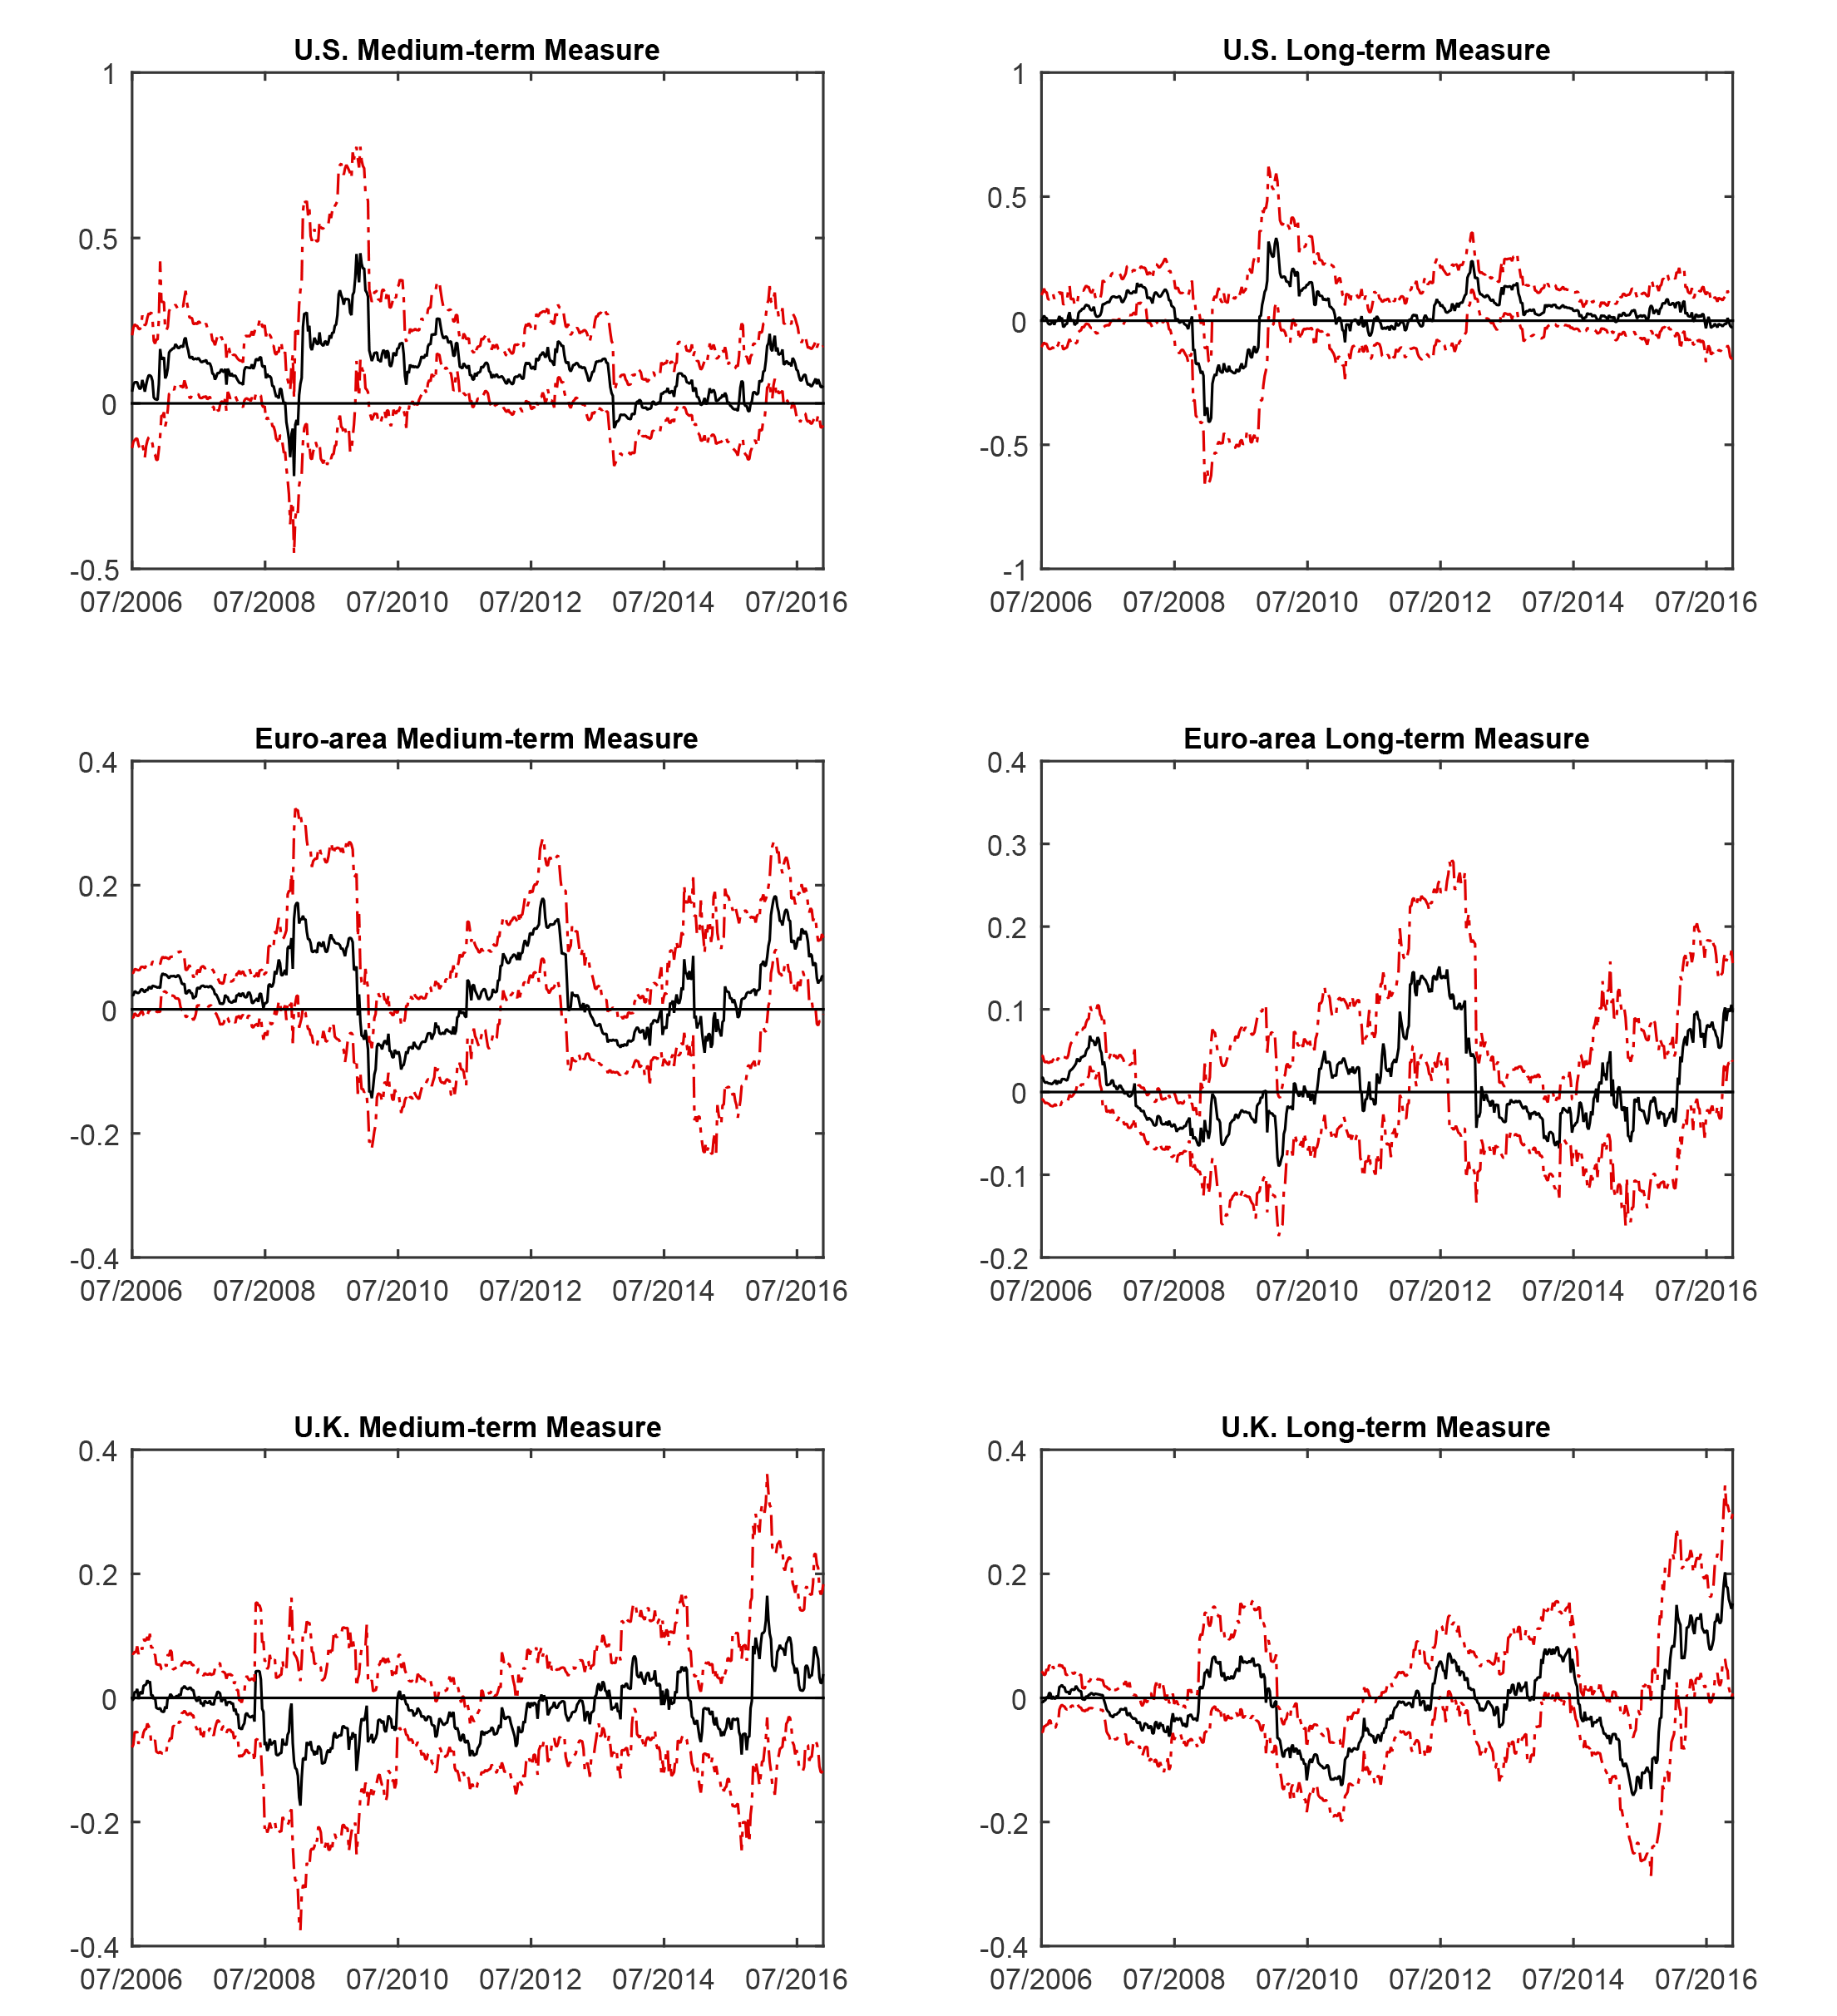
In contrast to the variables we discussed so far, the economic and statistical significance of stock returns is comparable across the medium- and long-term inflation compensation (table 1 and figure 6). In general, the long-term measures are less volatile and relatively insensitive to oil prices, macroeconomic news, and exchange rates. Therefore, these results suggest that movements in risk premiums generally play a more important role in driving movements in the long-term measures. In the aftermath of the global financial crisis, the relationship between risky asset prices and inflation compensation measures economically and statistically strengthened. For the euro area and the United Kingdom, the shift is more prevalent. Moreover, it is strongest in case of the U.K. medium-term measure, explaining the small and statistically insignificant coefficient in the full-sample regression.
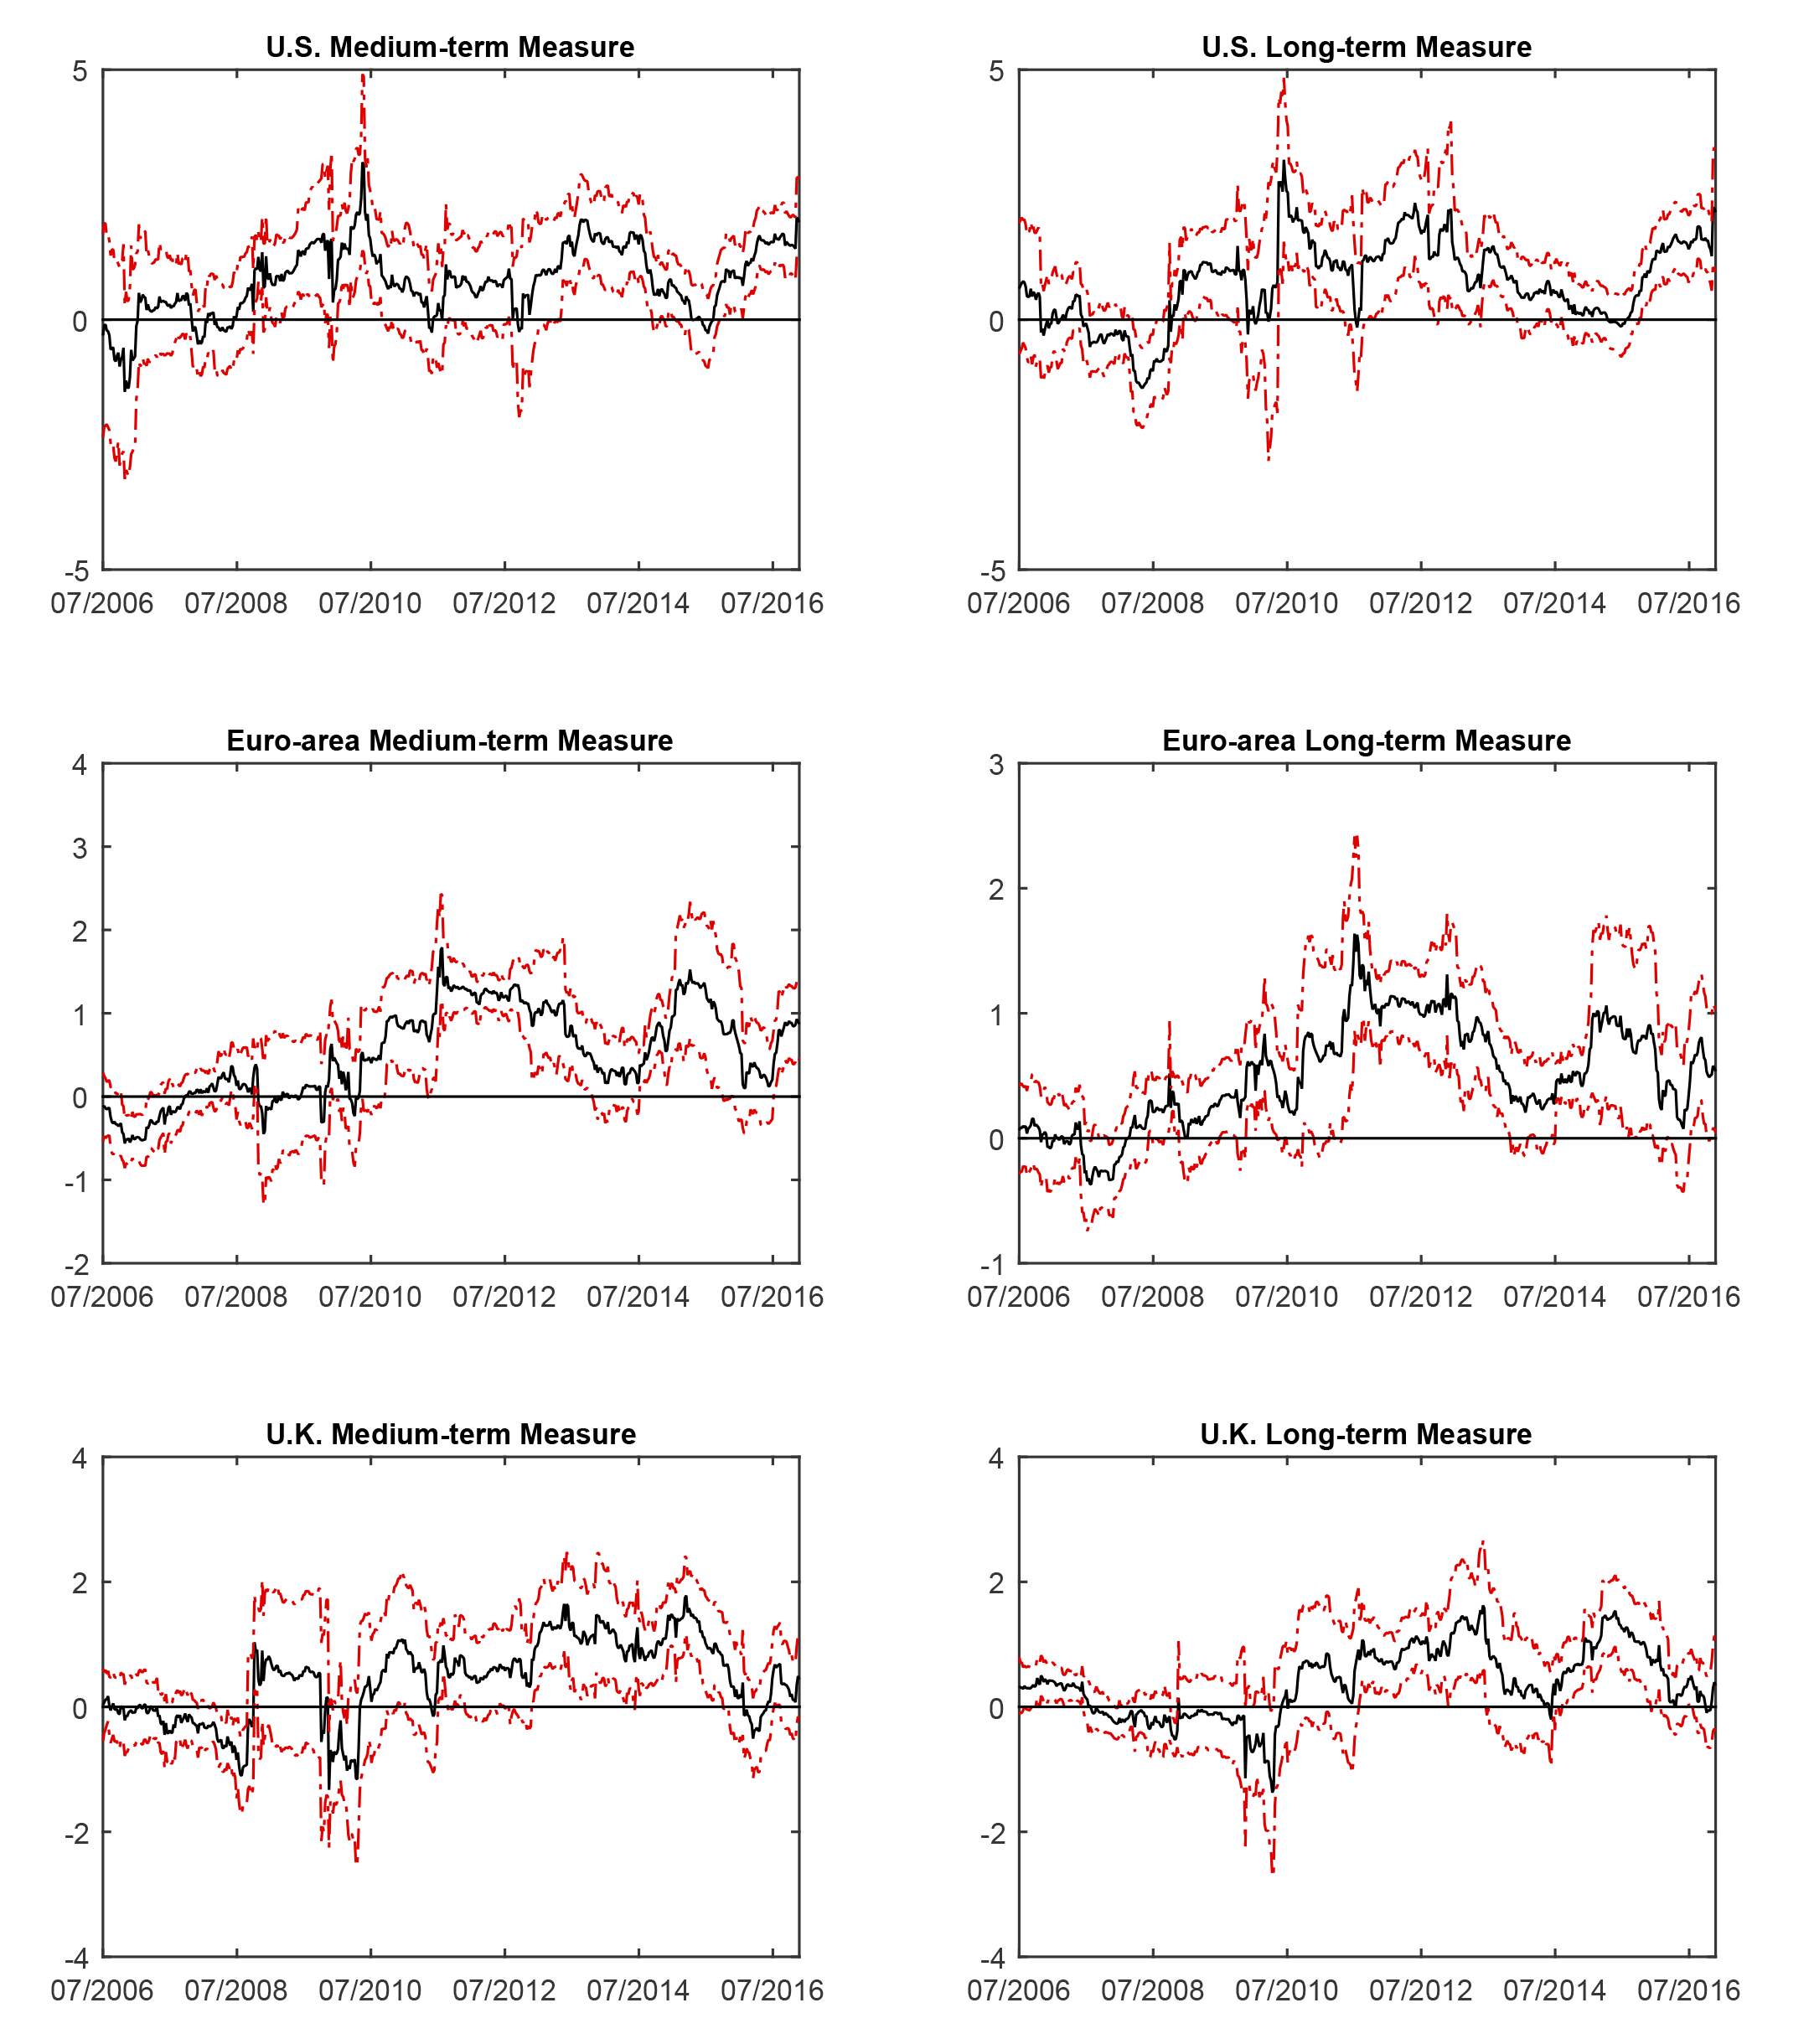 |
|
Notes: Black lines show point estimates for the coefficient of the return on a broad stock index, and dotted-red lines are 90 percent confidence bands based on Newey-West HAC standard errors.
The increased role of risk premiums in driving inflation compensation over the past several years is consistent with subdued economic growth and highly accommodative monetary policy stances in the advanced economies. The scope for further effective monetary easing perceived by investors seems to have declined amid the already low interest rates and large balance sheets of central banks. Accordingly, the probability investors attach to low inflation outcomes or perceived costs associated with such states of the world have been higher on average.
Recent Developments
Inflation compensation measures in advanced economies trended up, on net, in the second half of 2016 (table 2). We take a close look at these changes in light of our regression analysis.13 Our model accounts for about half of the rise in the medium-term measures for both the United States and the euro area. However, the role of the risk premium is notably larger for the United States while the predicted rise in the euro-area measure is predominantly accounted for by the changes in economic news and oil prices. Higher oil prices can explain only a fraction of the notable increase in U.K. medium-term inflation compensation, while other predictors have no significant explanatory power.
The model-based predictions generally account for a smaller portion of the increase in the long-term measures. The anticipated increase is about a third of the actual change for the United States while it is much smaller for the euro area and the United Kingdom. Most of the predicted rise in the long-term inflation compensation in the United States is due to rising inflation risk premium. Overall, the results suggest that expectations of higher inflation that cannot be attributed to the observables in our regressions dominated the rise in long-term inflation compensation in the advanced economies over the second half of 2016, especially outside the United States.14
| Panel A: Medium-term Measures | Panel B: Long-term Measures | |||||
|---|---|---|---|---|---|---|
| U.S. | Euro area | U.K. | U.S. | Euro area | U.K. | |
| Change (bps) | 42 | 35.8 | 54.2 | 49.4 | 33.8 | 44 |
| Predicted change | 22.6 | 15.1 | 6.8 | 16.6 | 2.7 | 4.3 |
| Oil price | 5.2 [2.6, 7.8] |
5.6 [3.9, 7.3] |
6.8 [4, 9.5] |
2.8 [0.7, 4.9] |
1.5 [-0.4, 3.3] |
2 [0.1, 3.9] |
| Economic news | 5.4 [0.6, 10.2] |
7.2 [2.4, 11.9] |
2.9 [-2.8, 8.5] |
1.4 [-2.7, 5.4] |
2.8 [-2.5, 8] |
3.8 [-0.2, 7.7] |
| Exchange rate | -6.7 [-18, 4.7] |
1.6 [-0.2, .3.3] |
-0.7 [-1.5, 0.2] |
-1.2 [-10.3, 8] |
0.8 [-0.8, 2.3] |
-0.3 [-0.9, 0.4] |
| Risk premium | 12 [9.4, 14.6] |
2.4 [0.3, 4.4] |
-0.7 [-2.4, 1.1] |
13.8 [11.1, 16.5] |
2.7 [0.8, 4.5] |
2.3 [0.8, 3.7] |
Notes: Data for the second half of 2016 are through December 16. Parameters used in predictions are the average of rolling estimates over the first half of 2016. 90 percent confidence bands based on Newey-West HAC standard errors are given in square brackets. Total predicted change is the sum of changes predicted by statistically significant variables.
References
Beechey, Meredith J., Benjamin K. Johannsen and Andrew T. Levin (2011). "Are Long-Run Inflation Expectations Anchored More Firmly in the Euro Area than in the United States?" American Economic Journal: Macroeconomics, 3, 104-129.
Bullard, James (2016). "Inflation Expectations Are Important to Central Bankers, Too," The Regional Economist, April, www.stlouisfed.org/publications/regional-economist/april-2016/inflation-expectations-are-important-to-central-bankers-too 
Chen, Andrew, Eric Engstrom and Olesya Grishchenko (2016). "Has the Inflation Risk Premium Fallen? Is it Now Negative?" FEDS Notes. Washington: Board of Governors of the Federal Reserve System, April 4, https://www.federalreserve.gov/econresdata/notes/feds-notes/2016/has-the-inflation-risk-premium-fallen-is-it-now-negative-20160404.html
Fleming, Michael and John Sporn (2013). "How Liquid Is the Inflation Swap Market?" Liberty Street Economics Blog, April 1, http://libertystreeteconomics.newyorkfed.org/2013/04/how-liquid-is-the-inflation-swap-market.html#.V5EfAqJQp1A
Gurkaynak, Refet, Andrew T. Levin and Eric Swanson (2010). "Does Inflation Targeting Anchor Expectations?" Journal of the European Economic Association, 8, 1208-1242.
Hamilton, James D. (2012). "Import Prices and Inflation," International Journal of Central Banking, 8, 271-279.
Haubrich, Joseph, George Pennacchi and Peter Ritchken (2012). "Inflation Expectations, Real Rates, and Risk Premia: Evidence from Inflation Swaps," Review of Financial Studies, 25, 1588-1629.
ISDA (2014). "Size and Uses of the Non-Cleared Derivatives Market", April, https://www2.isda.org/attachment/NjQ0MA==/FINAL%20-%20Size%20and%20Uses%20of%20the%20Non-Cleared%20Derivatves%20Market.pdf
Kocherlakota, Narayana R. (2016). "Information in Inflation Breakevens about Fed Credibility," webpage, https://sites.google.com/site/kocherlakota009/home/policy/thoughts-on-policy/1-14-16
Obstfeld, Maurice, Gian Maria Milesi-Ferretti and Rabah Arezki (2016). "Oil Prices and the Global Economy: It's Complicated", webpage, https://blog-imfdirect.imf.org/2016/03/24/oil-prices-and-the-global-economy-its-complicated/
Perez-Segura, Alejandro and Robert J. Vigfusson (2016). "The Relationship between Oil Prices and Inflation Compensation," IFDP Notes. Washington: Board of Governors of the Federal Reserve System, April 6, www.federalreserve.gov/econresdata/notes/ifdp-notes/2016/relationship-between-oil-prices-and-inflation-compensation-20160406.html
Appendix: Data
Data are weekly as of Friday from July 1, 2005, to November 25, 2016. All series were obtained from Bloomberg unless otherwise noted.
- Inflation swap rates were obtained from Barclays.
- Citigroup Economic Surprise Indexes: These indexes summarize the unexpected component of economic news releases relative to a survey of forecasters by weighting each component with respect to the impact it has on the foreign exchange market.
- Stock Indexes: S&P 500 for the United States, EURO STOXX for the euro area, and FTSE 100 for the United Kingdom.
-
Trade-weighted effective foreign exchange indexes:
- The broad dollar index was obtained from the H.10 release of the Board of Governors of the Federal Reserve System.
- JPMorgan Chase trade-weighted sterling and euro indexes.
- Long-term risk-free rate: 10-year government bond yields of the United States, Germany, and the United Kingdom.
1. We thank Shaghil Ahmed, Stephanie Curcuru, Zeynep Senyuz, and Beth Anne Wilson for useful comments and Joanne Im and Chelsea Hunter for research assistance. Return to text
2. See, for example, Bullard (2016) and Kocherlakota (2016). Return to text
3. In contrast, bond-based inflation compensation measures are obtained by subtracting yields on inflation-linked bonds from nominal bond yields of comparable maturity. Return to text
4. Inflation swaps provide the only inflation compensation measure for the euro area as a whole. Inflation swap market for Japan is relatively less liquid, so we do not include it in our analysis. Return to text
5. Perez-Segura and Vigfusson (2016) argue that the effect of oil prices on long-term inflation compensation can be largely explained by demand-driven changes that reflect strength or weakness in global demand. Obstfeld, Milesi-Ferretti, and Arezki (2016) argue that the strong positive correlation between seemingly supply-driven oil price changes and broad stock indexes in early 2016 could be explained by the negative effects of lower oil prices on global demand through oil exporting countries and the prolonged period of monetary accommodation by advanced economy central banks, which arguably left limited room for further monetary easing to combat falling inflation. Return to text
6. See, for example, ISDA (2014). Haubrich, Pennacchi and Ritchken (2012) and Fleming and Sporn (2013) argue that the market for inflation swaps is sufficiently liquid. Return to text
7. The realized inflation in such contracts is usually defined as a transformation (e.g., averaging and/or interpolation) of observed inflation rates near the contracts' maturities. Return to text
8. Approximately, we have 5-year/5-year forward rate = 2 ×10-year rate - 5-year rate. Return to text
9. A higher value of the index is associated with appreciation of the currency on a trade-weighted basis. Return to text
10. In a similar vein, Chen, Engstrom, and Grishchenko (2016) analyze the role of systemic risk premiums in the U.S. long-term inflation compensation in the context of the Capital Asset Pricing Model (CAPM) with time-varying betas. Return to text
11. The result is consistent with those of Beechey, Johannsen, and Levin (2011) and Gurkaynak, Levin, and Swanson (2010), who argue that inflation expectations were better anchored in the euro area and the United Kingdom mainly due to the presence of formal inflation targets. Return to text
12. Central banks may take actions to offset such effects. Moreover, as in the case of other variables in our regressions, the estimated effects do not necessarily imply causality. See Hamilton (2012) for a discussion of these issues pertaining to the relationship between inflation and import prices. Return to text
13. To attribute changes to different drivers, we hold betas constant by averaging rolling coefficient estimates through the first half of 2016 and then plug in the actual changes in right-hand-side variables in the second half of the year. The change in the risk premium estimate is calculated in a CAPM framework—that is, the market beta multiplied by the change in the equity premium. The market beta of the seller's (i.e., the party who receives the fixed rate and pays actual inflation) position is appropriately scaled to take into account the duration of our medium- and long-term measures. We assume a 10-year investment horizon and a constant 10-year-ahead stock price to calculate the change in the equity premium. Return to text
14. An important caveat is that our proxy for the change in risk premiums may underestimate the changes in inflation risk premium. Return to text
Please cite as:
Rodriguez, Marius, and Emre Yoldas (2016). "Drivers of Inflation Compensation Evidence from Inflation Swaps in Advanced Economies," IFDP Notes. Washington: Board of Governors of the Federal Reserve System, December 30, 2016. https://doi.org/10.17016/2573-2129.28
Disclaimer: IFDP Notes are articles in which Board economists offer their own views and present analysis on a range of topics in economics and finance. These articles are shorter and less technically oriented than IFDP Working Papers.