
FEDS Notes
 Print
PrintApril 4, 2016
Has the inflation risk premium fallen? Is it now negative?1
Andrew Chen, Eric Engstrom, Olesya Grishchenko
Inflation compensation is defined as the extra yield investors require to hold nominal assets that are exposed to inflation risk as opposed to those that offer a safe inflation-adjusted return such as Treasury inflation protected securities (TIPS). Inflation compensation is widely used by market commentators to gauge the expectations of investors regarding the outlook for inflation. Figure 1 depicts the daily time series of one market-based measure of inflation compensation, defined as the difference between zero-coupon nominal and TIPS yields of corresponding maturities.2 Since August 2014, measures of inflation compensation have trended down noticeably and, for many months now, have been below 2 percent (the red line)--the rate of consumer price inflation targeted by the Federal Open Market Committee (FOMC) over the longer-term.3
| Figure 1: TIPS-based measures of inflation compensation. |
|---|
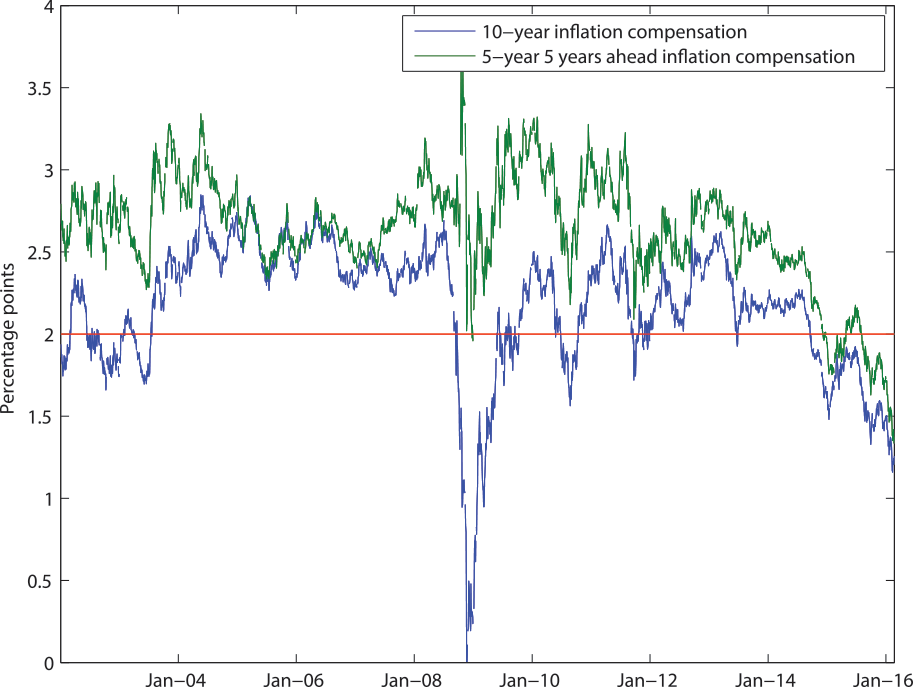 |
Source: Federal Reserve Board staff estimates
A straight read of these declines in inflation compensation might suggest that market participants expect inflation to fall significantly short of the target rate of inflation, even at long horizons. However, other factors in addition to expected inflation likely affect inflation compensation. In this note, we examine the theoretical determinants of one important component of inflation compensation, the inflation risk premium, and argue that a secular decline in the inflation risk premium may be responsible for a substantial portion of the decline in inflation compensation in recent years.
Measures of inflation compensation such as TIPS breakeven rates and inflation swap rates are related to market participants' expected rate of inflation by the relationship:
Inflation compensation = expected inflation + inflation risk premium + other factors
Identifying the inflation risk premium is useful for measuring expected rate of inflation that is embedded in market prices, but it is also a crucial quantity in its own right.4 For instance, if the premium is positive, then the government must pay an implicit positive premium for issuing nominal Treasury securities relative to inflation-protected securities such as TIPS. However, if the inflation risk premium is negative, then the relationship flips and issuing nominal bonds may be more cost effective for the Treasury.
Many market commentators appear to simply assume that the inflation risk premium is positive or ignore it altogether. According to these commentaries, long-term nominal interest rates have generally exceeded short-term nominal interest rates, on average, to a greater degree than is true for yields on securities that are protected from inflation risk such as TIPS. In the parlance of fixed-income analysts, the nominal term structure has tended to be more steeply upward-sloping than the real term structure. This evidence is said to suggest that assets like nominal bonds whose prices and returns suffer when inflation is unexpectedly high are viewed as risky by market participants, who have then required a positive inflation premium, pushing up long-term nominal yields.
This logic is sound, but the available time series of data to support this claim is relatively short (in the United States, TIPS were first issued in 1997). Further, as explored further below, there are good reasons to suspect that a structural change may have taken place and that the slope of the nominal yield curve may be somewhat flatter in the future.
Conventional asset pricing theory suggests that the sign of risk premiums depends on the sign of the covariance of the returns of those assets with the typical investors' consumption or wealth. For example, stocks require a high positive risk premium because equity prices tend to fall during recessions, precisely when consumption also falls. Assets with payoffs tied to inflation are often modeled in this way too.
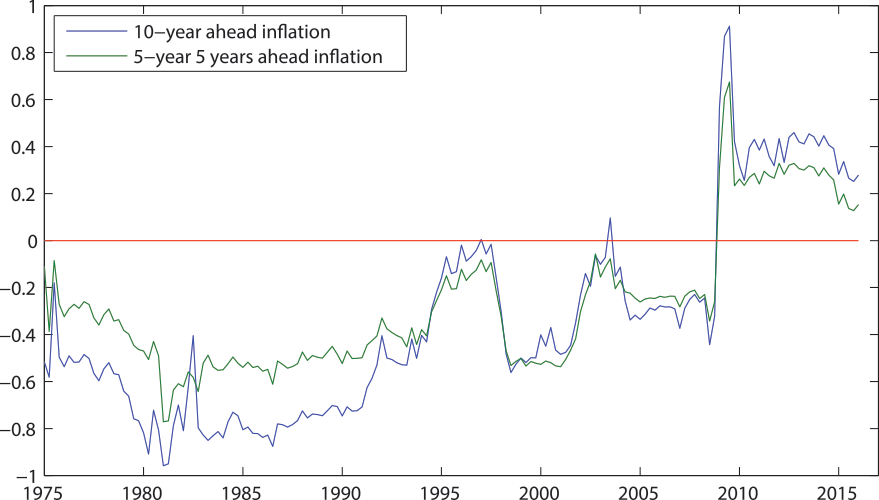
Figure 2 shows that the estimated correlation of long-run future inflation with long-run future consumption has not been stable over time.5 The correlation was deeply negative in the 1980s, when periods of high inflation were associated with poor economic outcomes, suggesting that the inflation risk premium was likely positive at that time. The negative correlation in the early sample is consistent with a predominance of economic shocks that move inflation and real growth in opposite direction, such as oil price ("supply-side") shocks that simultaneously raised inflation and lowered real economic activity.
However, Figure 2 shows that the correlation trended up over time and switched signs recently, implying that the risk premium may now be negative. The change is consistent with an increasing role for "demand-side" shocks that instead push inflation and real economic activity in the same direction. For instance, onset of the Great Recession saw both inflation and real activity plummeting simultaneously.
Using a-back-of-the-envelope calculation, we can roughly gauge the plausible magnitude of the negative risk premium. To do so, we appeal to conventional asset pricing theory using a standard utility function with constant relative risk aversion and risk aversion parameter, γ. Under these conditions, the inflation risk premium is
Inflation risk premium = -γ × covariance(inflation, consumption growth).
Using a risk aversion parameter of 20,6 the implied inflation risk premium at 10-year and 5-year 5 years ahead horizons at the end of the sample is negative 17 basis points and negative 5 basis points, respectively, compared with positive average levels of about 100 basis and 25 basis points for the two series in the 1980s.
However, there are important caveats to the above analysis. First, consumption-based asset pricing models have, at best, a mixed record of fitting risk premiums across assets. Second, the particular statistical model of the correlation between consumption growth and inflation depicted above may not coincide with investor perceptions.
To take a closer look at potential changes in the inflation risk premium over the past few years, we use higher-frequency data from asset prices to estimate correlations between consumption growth and inflation depicted in Figure 2. We can use the capital asset pricing model, according to which the risk premium associated with a position in inflation compensation (e.g. in inflation swaps) is:
Holding period inflation risk premium = market risk premium x beta(inflation compensation),
where the function "beta" is the usual concept that is proportional to the correlation between inflation compensation and equity returns.7
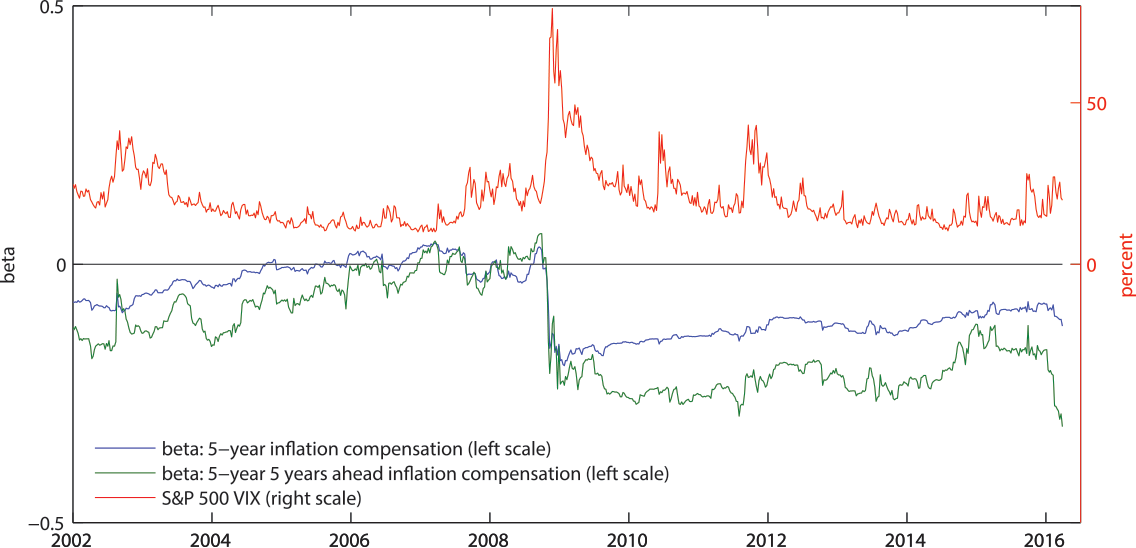
As Figure 38 depicts, the estimated betas of inflation compensation plunged into negative territory in 2009, similar to the results in Figure 2, and have remained negative ever since. Moreover, the betas have moved down sharply over the past few months.9 Also plotted is the option-implied one month-ahead implied volatility on the S&P 500 index the VIX a measure plausibly related to the equity market risk premium. The VIX has moved up somewhat, on net, over the past year as the betas have trended down, suggesting that the risk premium associated with inflation compensation has become substantially more negative.
| Figure 3. Beta of one-year ahead positions in inflation compensation with respect to the S&P500 index. |
|---|
 |
To sum up, this note points out that standard consumption-based asset pricing models and the capital asset pricing model suggest that the long run inflation risk premium has trended down over time, and is likely to be negative in the current macroeconomic environment. Moreover, a nontrivial portion of the decline in far-forward inflation compensation over the past year may reflect a decline in the inflation risk premium rather than a drop in investors' expected inflation rate.
A burgeoning academic literature has also investigated this issue, providing estimates of the inflation risk premium. For example, Chernov and Mueller (2012) argue that the inflation risk premium estimates are model-dependent and can switch sign from positive to negative in a model that accounts for survey-based inflation forecasts vs. the one that does exclude the survey forecasts from the estimation. Grishchenko and Huang (2013) find that the inflation risk premium implied by the nominal yields and the TIPS-based measure of inflation compensation was positive in the early 2000s but switched signs around the Great Recession. D'Amico, Kim, and Wei (2014) also find that the inflation risk premium has been trending down. Finally, recent papers in the macro-finance literature have made strides in incorporating the fundamental insights from consumption-based asset pricing into fully-fledged models of the term structure of interest rates.10
References:
Bansal, R., Shaliastovich, I., 2013, "A long-run risks explanation of predictability puzzles in bond and currency markets," the Review of Financial Studies, 26(1), pp. 1-33.
Chernov, M., Mueller, P., 2012, "The term structure of inflation expectations", Journal of Financial Economics, 106, pp. 367-394
Grishchenko, O., Huang, J., 2013, "The inflation risk premium: Evidence from the TIPS market", Journal of Fixed Income, 22(4), pp.5-30
Grishchenko, O., Song, Z., Zhou, H., 2015, "Term structure of interest rates with short-run and long-run risks," Finance and Economics Discussion Series 2015-095. Washington: Board of Governors of the Federal Reserve System
Gurkaynak, R., Sack, B., Wright, J., 2007, "The U.S. Treasury yield curve: 1961 to present", Journal of Monetary Economics, 54, pp. 2291-2304
Gurkaynak, R., Sack, B., Wright, J., 2010, "The TIPS yield curve and inflation compensation", American Economic Journal: Macroeconomics, 2(1), pp. 70-92
D'Amico, S., Kim, D., Wei, M., 2014, "Tips from TIPS: The informational content of Treasury Inflation-Protected Security Prices", Finance and Economics Discussion Series 2014-24, Board of Governors of the Federal Reserve System (U.S.)
Kocherlakota, N., 1996, "The equity premium: It's still a puzzle", Journal of Political Literature, 34(1), pp. 42-71
Koop, G., Korobilis, D., 2013, "Large time-varying parameter VARs", Journal of Econometrics, 177(2), pp. 185-198
Wachter, J., 2006, "A consumption-based model of the term structure of interest rates," Journal of Financial Economics, 79, pp. 365-399
1. Board of Governors of the Federal Reserve System. The views expressed in this note do not necessary reflect those of the Board of Governors, or its staff. The note benefitted from helpful comments from Francisco Palomino, Anthony Diercks, and Michael Palumbo. Return to text
2. Zero-coupon nominal and TIPS yields are estimated using Svensson functional form of the yield curve. See Gurkaynak et al. (2007, 2010) for details. Return to text
3. The FOMC targets Personal Consumer Expenditures (PCE) index while TIPS are indexed to Consumer Price Index (CPI). However, existing discrepancy between the two indices is not likely to explain a recent downward trend in inflation compensation. Return to text
4. "Other factors" may include liquidity premiums and technical, usually transitory, trading effects. Return to text
5. These estimates were produced using a time-varying parameter vector autoregression (TVP-VAR) including the variables: the output gap (CBO estimate), 4-quarter core PCE inflation, real consumption growth, headline PCE inflation, and the Federal funds rate. Data are quarterly from 1954-2015. The TVP-VAR methodology follows Koop (2013). Figure 2 shows the correlations between 10-year ahead consumption growth and 10-year ahead inflation (or 5-to-10 year ahead inflation) implied by the TVP-VAR. Return to text
6. Risk aversion of 20 is a level typically found in the academic literature to be sufficient to fit the equity risk premium. See, for example, Kocherlakota (1996). Return to text
7. The measured holding period risk premium is a slightly different concept from the inflation risk premium because it represents the excess return to holding a position in inflation compensation for just one year. Return to text
8. The S&P 500 VIX ("Index") is a product of S&P Dow Jones Indices LLC and/or its affiliates and has been licensed for use by the Board. Copyright © 2016 S&P Dow Jones Indices LLC, a subsidiary of the McGraw Hill Financial Inc., and /or its affiliates. All rights reserved. Redistribution, reproduction and/or photocopying in whole or in part are prohibited without written permission of S&P Dow Jones Indices LLC. For more information on any of S&P Dow Jones Indices LLC's indices please visit www.spdji.com. S&P® is a registered trademark of Standard & Poor's Financial Services LLC and Dow Jones® is a registered trademark of Dow Jones Trademark Holdings LLC. Neither S&P Dow Jones Indices LLC, Dow Jones Trademark Holdings LLC, their affiliates nor their third party licensors make any representation or warranty, express or implied, as to the ability of any index to accurately represent the asset class or market sector that it purports to represent and neither S&P Dow Jones Indices LLC, Dow Jones Trademark Holdings LLC, their affiliates nor their third party licensors shall have any liability for any errors, omissions, or interruptions of any index or the data included therein. Return to text
9. We also use a TVP-VAR for this analysis. The endogenous variables include real and nominal Treasury yields at the 5- and 10-year maturities, the VIX index, and returns on the S&P 500 index. Data are weekly from January 2010 - February 2016. Return to text
10. See Wachter (2006), Bansal and Shaliastovich (2013) and Grishchenko, Song and Zhou (2015). Return to text
Please cite this note as:
Chen, Andrew Y., Eric C. Engstrom, and Olesya V. Grishchenko (2016). "Has the inflation risk premium fallen? Is it now negative? ," FEDS Notes. Washington: Board of Governors of the Federal Reserve System, April 4, 2016, http://dx.doi.org/10.17016/2380-7172.1720.
Disclaimer: FEDS Notes are articles in which Board economists offer their own views and present analysis on a range of topics in economics and finance. These articles are shorter and less technically oriented than FEDS Working Papers.
